

Prices

December 9, 2021
HRC & BUS Futures: The Ghost of Christmas Past Takes You Back to 2014
Written by David Feldstein
Editor’s note: SMU Contributor David Feldstein is president of Rock Trading Advisors. Rock provides customers attached to the steel industry with commodity price risk management services and market intelligence. RTA is registered with the National Futures Association as a Commodity Trade Advisor. David has over 20 years of professional trading experience and has been active in the ferrous derivatives space since 2012.
This is a chart of the CME hot rolled coil futures curve as of July 16 and Nov. 16. What’s interesting about this chart is how the futures curve was in approximately the same place In mid-November as it was in mid-July despite steel market fundamentals being completely different. Whether it be lead times, mills’ willingness to negotiate, service center inventory levels, imports, etc. it’s night and day. Yet the two curves through the third quarter of next year weren’t that different.
CME Hot Rolled Coil Futures Curve $/st
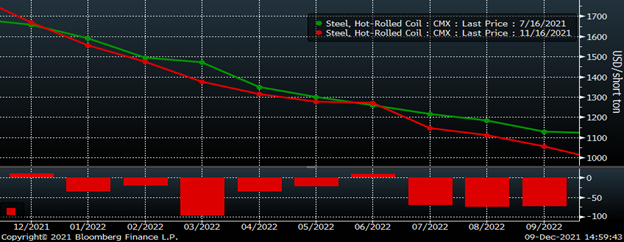
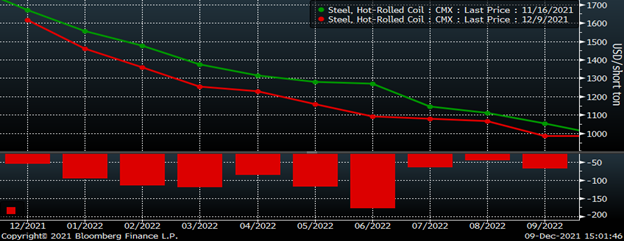
Since mid-November, the curve has traded lower with the futures months of January through May each declining around $100. During that same time, the CRU Midwest HR Index has declined $136 from $1,786 to $1,650/st. Looking at steel market fundamentals and then looking back at the HR futures curve, I wonder if the slow steady decline currently priced by the curve will turn out to be accurate or not. While there’s always the possibility that HR rebounds back above $1,900, current steel fundamentals not only challenge the bull case, but also bolster the notion that the curve might be wildly optimistic. For someone who believes the latter to be true, they might see futures prices as being sticky, that they are not adapting or reflecting the underlying reality happening in the domestic flat rolled steel market.
CME Hot Rolled Coil Futures Curve $/st
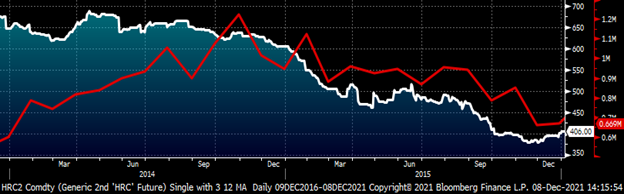
The last two years have been unlike any seen before. HR trading above $1,900 is all you need to know. Nevertheless, fundamentals will ultimately exert their forces clearing the market and bringing it back to equilibrium. That being said, it’s worthwhile looking for historical parallels as a guide to shape future expectations. The current market shares a number of characteristics with the 2014 market. In 2014, domestic mills had a number of supply issues constraining production, pushing out lead times, and driving up flat rolled prices. Buyers responded by placing orders with international suppliers and imports climbed all year long with flat rolled sheet peaking at 1.225 million short tons in October. Despite the surge of imports, HRC prices remained sticky in the fourth quarter falling only $40 from $640 to $600. Then a week or two into the new year, the 2015 bear market began taking HR first down to $450 and then eventually to $375 in November.
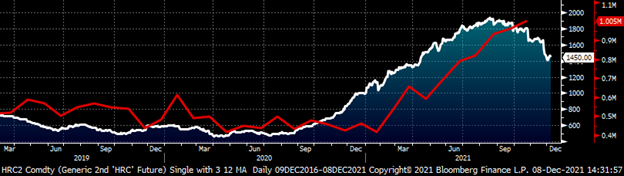
Rolling 2nd Month CME HR Future $/st (wh) & Flat Rolled Sheet Imports st (red)
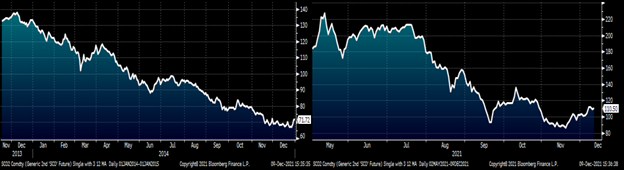
Another similarity between 2014 and the present was China struggling with economic growing pains. You might remember stories of ghost cities where Chinese developers built high rise buildings, shopping malls, etc. that were completely uninhabited and empty. Throughout 2014, iron ore collapses from $140 to $70. Throughout 2021, iron ore has also collapsed from $225 to as low as $90/t.
SGX Iron Ore Future 2014 (left) & 2021 (right)
China is having another bout of economic growing pains now with those same property developers collectively insolvent and no longer with the inherent backstop of the Chinese government. Earlier today, China’s largest property developer, Evergrande, was officially declared to be in default by Fitch Ratings.

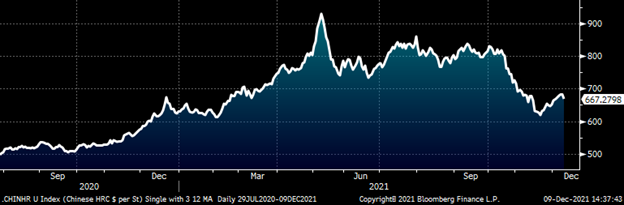
Chinese steel prices have rapidly declined as well with the January Chinese HR future falling from over $800/st in October to the low $600s a couple weeks ago, then rebounding and closing at $667 today.
January SHFE Chinese HRC Future $/st
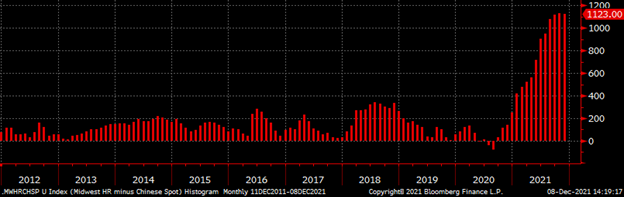
Chinese steel imports into the U.S. have been prevented by massive AD/CV duties, however, China’s price heavily influences global prices and can be used as a proxy for global import markets. This graph shows the (monthly) difference between Midwest and Chinese spot HR prices. This data point has been and will continue to be a reliable predictor for HR imports. Notice that the highs have remained above $1,100 over the last three months. This happened because the Chinese price has fallen at a rate similar to the Midwest HR spot price. This is the equivalent of a slow moving hurricane sitting on top of the domestic steel market that will continue to pound away until domestic mills pull out their foreign fighter marketing campaigns by abruptly slashing prices. The longer domestic prices stay elevated, the greater the damage will be in 2022.
Midwest Spot HR Minus Chinese Spot HR $/st
Coming back to the present, the similarities with 2014 are shown in the current chart below with flat rolled sheet imports steadily climbing to just above 1 million short tons in October and prices move slowly, steadily lower. Sticky like in 2014 as 2022 approaches.
Rolling 2nd Month CME HR Future $/st (wh) & Flat Rolled Sheet Imports st (red)
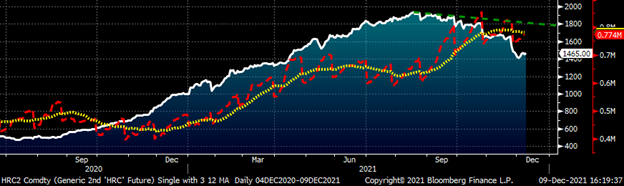
Open interest across the HR curve remains near all-time highs. Despite the increased participation in the market, I had suspected buyers would retreat once the market started to fall and that illiquidity would cause sharp price declines in the futures.
Rolling 2nd Month CME HR Future $/st & Open Interest (red)
However, so far the curve has been generally supported by OEM buyers locking in forward pricing steeply discounted to spot. Over the last few weeks, buying has slowed along with transactions and average daily volume. Nevertheless, the buyers keep returning and bidding up the market following sell-offs. Over the last few weeks, the futures market has been characterized as having buyers below and sellers above with neither showing much conviction. However in the last few days, there appear to be sellers lurking in the shadows ready to hit mid-market bids shortly after they appear on the screen.
Today’s HR markets with settlements are shown below. Most of this week’s trading has been focused in the months of December and Q1. You can see the bid-ask spreads widen out dramatically the farther you get down the curve. The bid-ask spreads are narrower earlier in the day, especially in the early morning as a number of futures market participants are based in London.
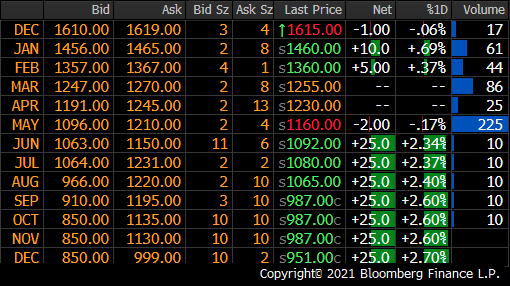
December’s busheling settlement will be out within the next 24 hours. Earlier this month, expectations were for prime to gain $20, but those expectations have slowly receded with December’s settlement now expected to be about flat MoM. Open interest in busheling has steadily declined throughout the year.
Rolling Second Month CME Busheling Future $/lt & Open Interest
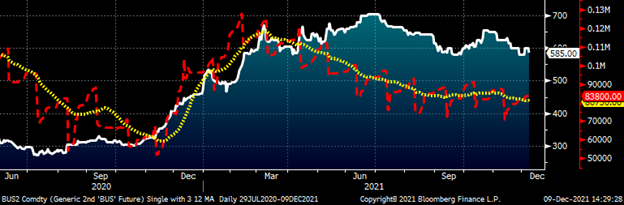
Busheling has held up remarkably considering the crash in iron ore. Will busheling be dragged down along with iron ore or will the growing demand from EAFs keep prices extremely elevated on a historical basis.
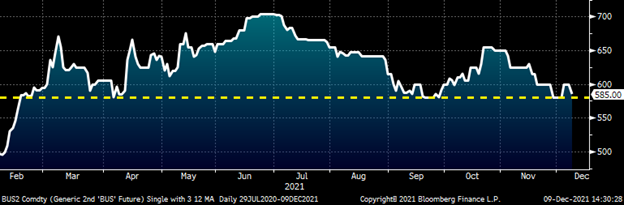
Let’s get technical. The rolling second month CME busheling future declined off its late June high of $702, falling to $580 in September. Then it rallied back above $650 at the end of October before declining back towards its $580 support level. This is a textbook example of a “head and shoulders” top pattern, which can be used to predict a trend reversal. The chart has formed. Now watch to see if busheling brakes below the $580 neckline, for if it does, it will have completed the pattern, which then forecasts for a steep decline to follow.
Rolling Second Month CME Busheling Future $/lt
Bono said, “nothing changes on New Year’s Day,” but apparently he wasn’t in the steel business in 2015.
Disclaimer: The content of this article is for informational purposes only. The views in this article do not represent financial services or advice. Any opinion expressed by Feldstein should not be treated as a specific inducement to make a particular investment or follow a particular strategy, but only as an expression of his opinion. Views and forecasts expressed are as of date indicated, are subject to change without notice, may not come to be and do not represent a recommendation or offer of any particular security, strategy or investment. Strategies mentioned may not be suitable for you. You must make an independent decision regarding investments or strategies mentioned in this article. It is recommended you consider your own particular circumstances and seek the advice from a financial professional before taking action in financial markets.


