

Market Data

December 10, 2021
October Shipments and Supply of Steel Products
Written by David Schollaert
Total mill shipments of steel products edged up 1.4% in October to 8.619 million tons, following a 12.2% fall the month prior. Apparent supply slipped for the second straight month in October, down 2.2% on top of a 6.9% decline in September. October’s contraction marks the first month-on-month decrease in steel supply since apparent supply fell consecutively at the onset of the pandemic from March through June of last year.
This analysis is based on steel mill shipment data from the American Iron and Steel Institute (AISI) and import-export data from the U.S. Department of Commerce (DOC). The analysis summarizes total steel supply by product from 2008 through October 2021 and year-on-year changes.
The supply/demand differential continues to shift as supply catches up with demand. October imports scaled back, down 13.3% month on month after surging nearly 18.0% in September. Despite a decrease of nearly 350,000 tons of imported finished steel in October, domestic shipments for the month were largely sideways.
Domestic mill utilization remained around 85% on average through October, running near capacity, but reduced demand across certain sectors and supply-chain disruptions have slowed overall shipments. Mill lead times shortened and steel prices continued to fall throughout the month.
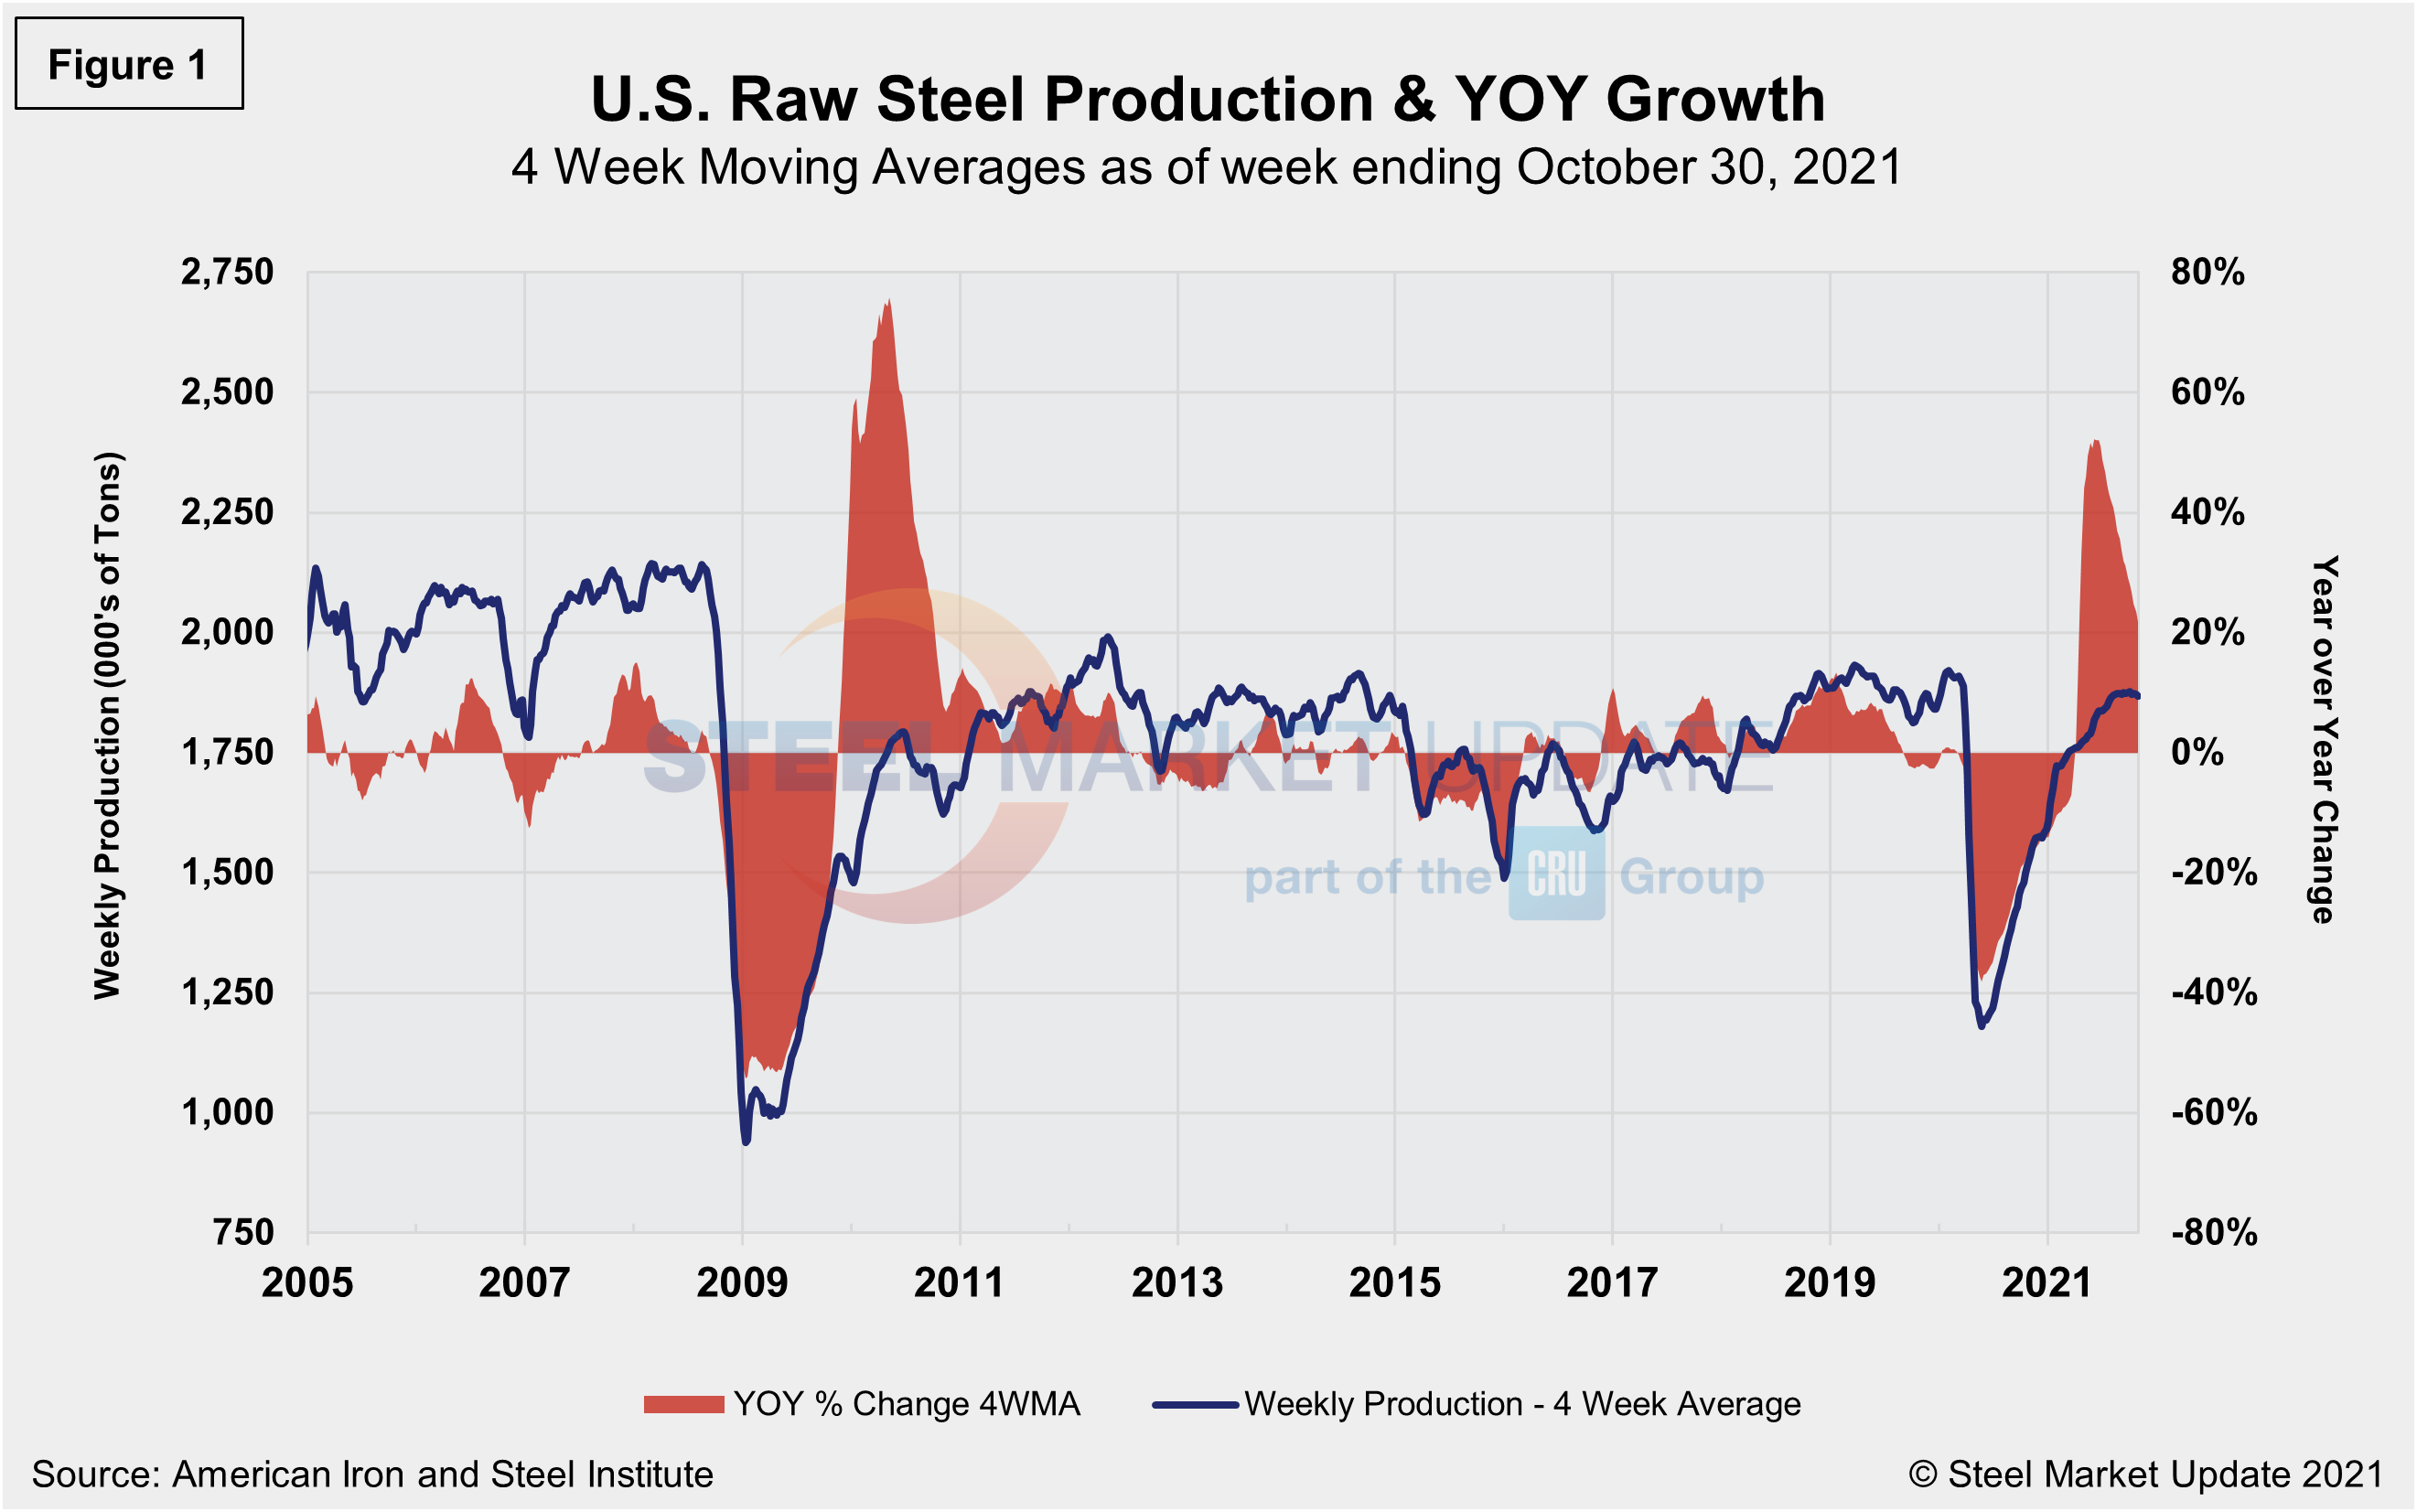
SMU’s benchmark hot-rolled coil price range averaged $1,955 per net ton FOB mill at the beginning of September. Prices dropped by nearly $100 per ton through October and have continued to fall, down by $225 per ton to an average of $1,730 as of Dec. 7. Raw steel production shown below in Figure 1 is based on weekly data from the AISI displayed as four-week moving averages through Oct. 30.
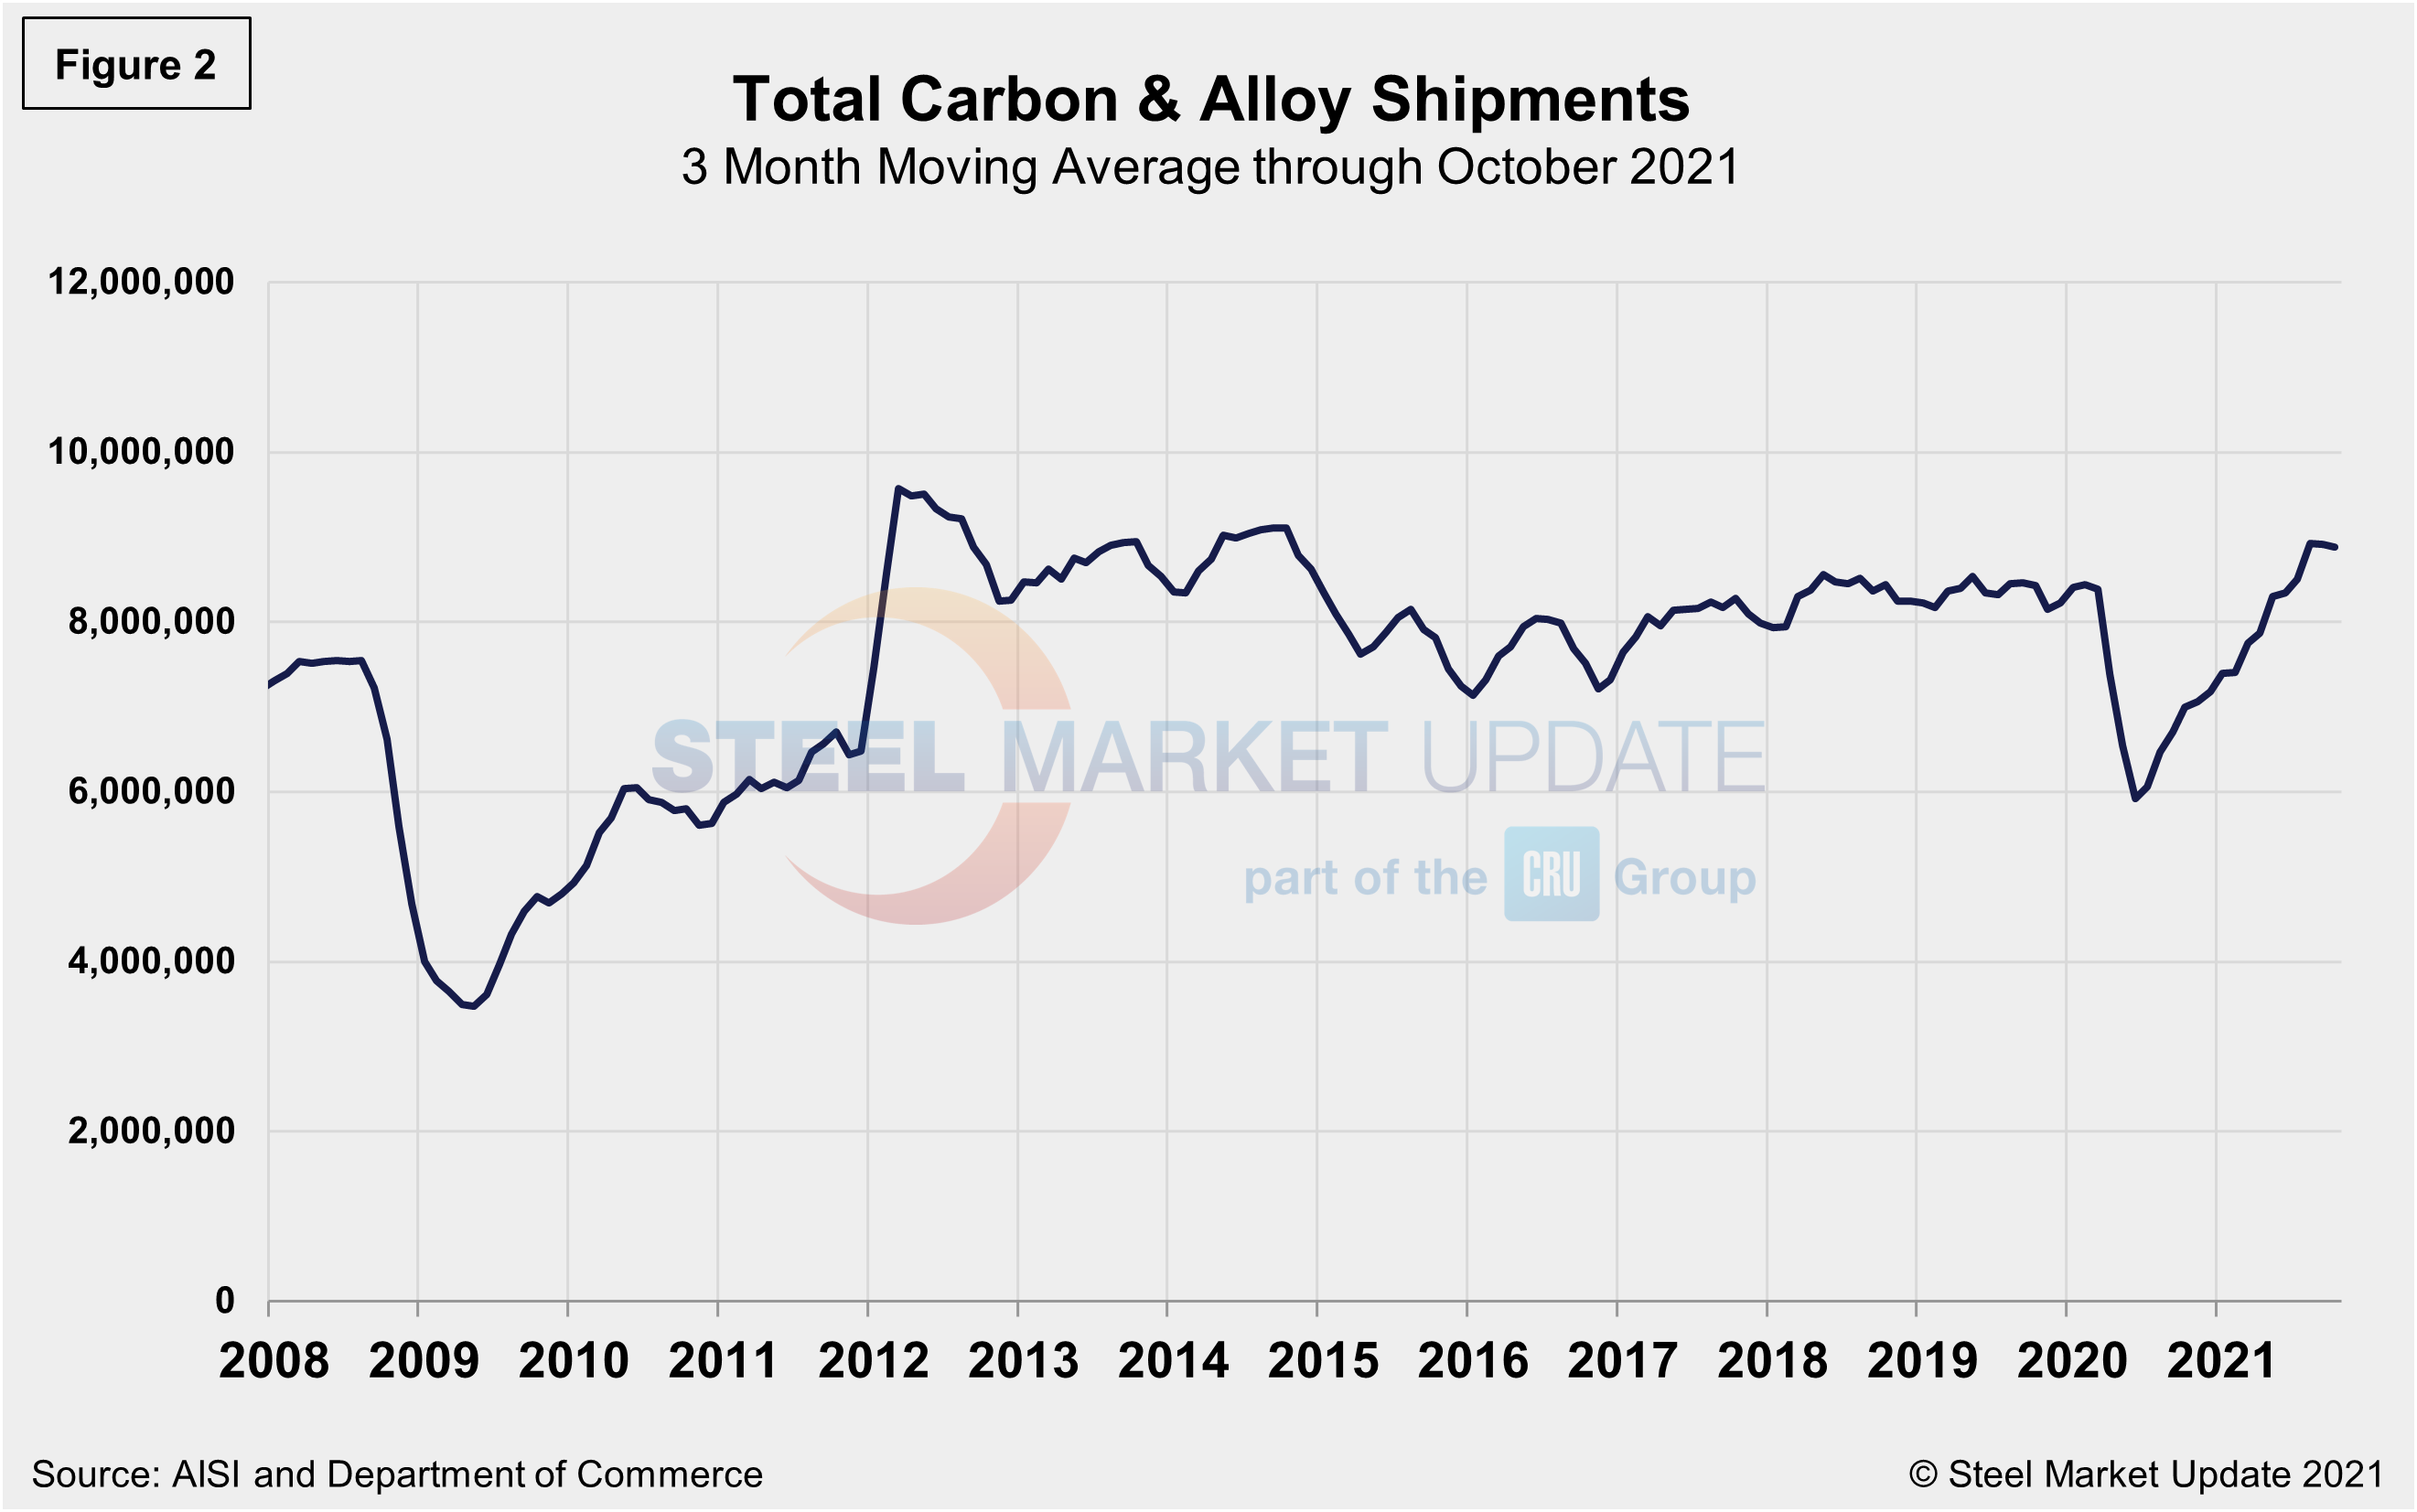
Monthly shipment data for all rolled steel products is noted in Figure 2. The trajectories of the rebounds since Q2 2020 are comparable in Figures 1 and 2. Measured as a three-month moving average (3MMA) of the monthly data, October’s total was 8.876 million tons, compared to 8.909 million tons in September, a decrease of 0.2% and the first consecutive decline since the initial COIVID-related disruptions last March. Shipments were up 26.9% in October compared to the year prior when shipments were 7.170 million tons. The recovery from the COVID-related shutdowns has been meaningful. Current shipments are up 2.7% from the same pre-pandemic period in 2019.
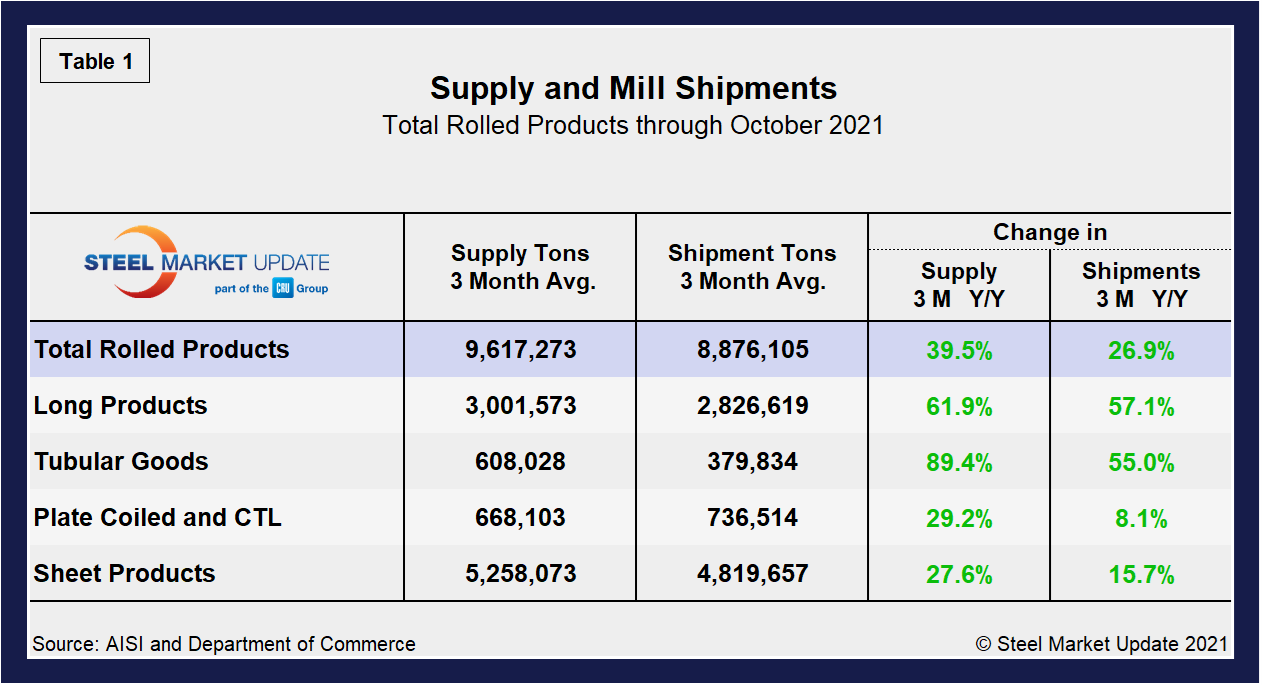
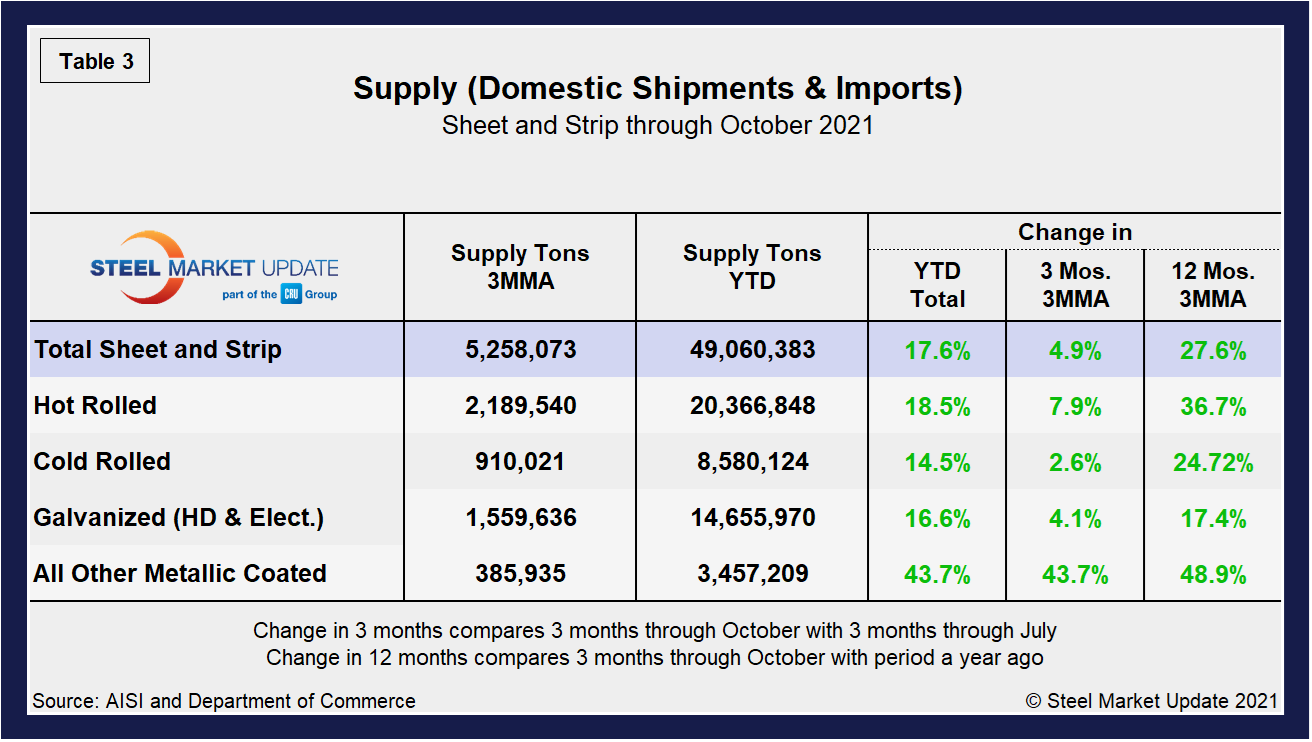
Shipment and supply details for all product groups are noted in Table 1, followed by individual sheet products in Table 2, and domestic supply (shipments and imports) in Table 3. Total supply (proxy for market demand) as a 3MMA was up 39.5% year over year in October, a big turnaround from the 21.3% decline last October as the market was trying to rebound from the pandemic-driven doldrums. Apparent supply is defined as domestic mill shipments to domestic locations plus imports. Mill shipments were up 26.9% in October, also a complete reversal from a decrease of 17.0% seen during the same year-ago period in the same 3MMA comparison. The recovery has varied significantly among various products, but should remain up due to steady domestic output, but especially should foreign material continue to make its way onto U.S. shores.
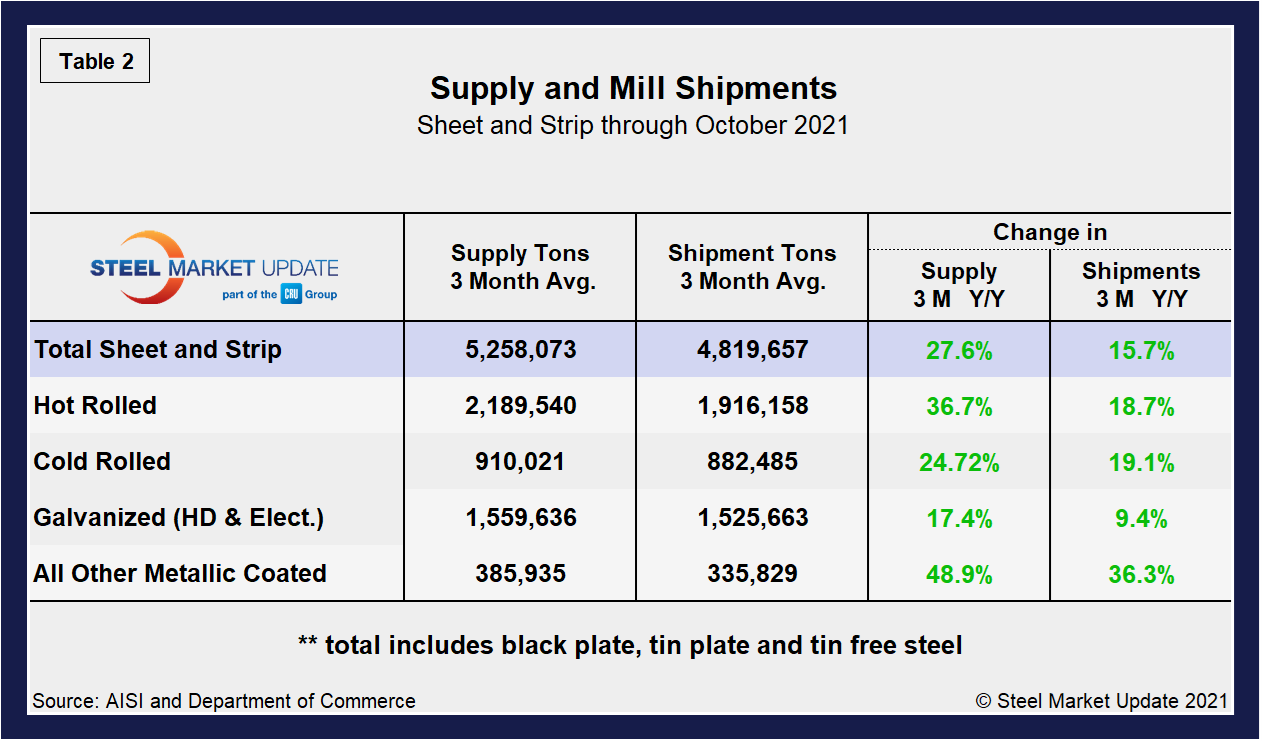
Overall sheet product shipments and supply (Table 2) have improved markedly month on month. Sheet supply increased by 27.6% and shipments by 15.7% in October, a strong recovery from declines of 13.6% and 11.3% seen one year ago. In the three months through October 2021, the average monthly supply of sheet and strip was 5.258 million tons, up from 5.222 million tons or 0.7% above the prior month. Total sheet and strip apparent supply is up 17.6% year to date (Table 3) compared to 2020. Note that year-over-year comparisons have seasonality removed.
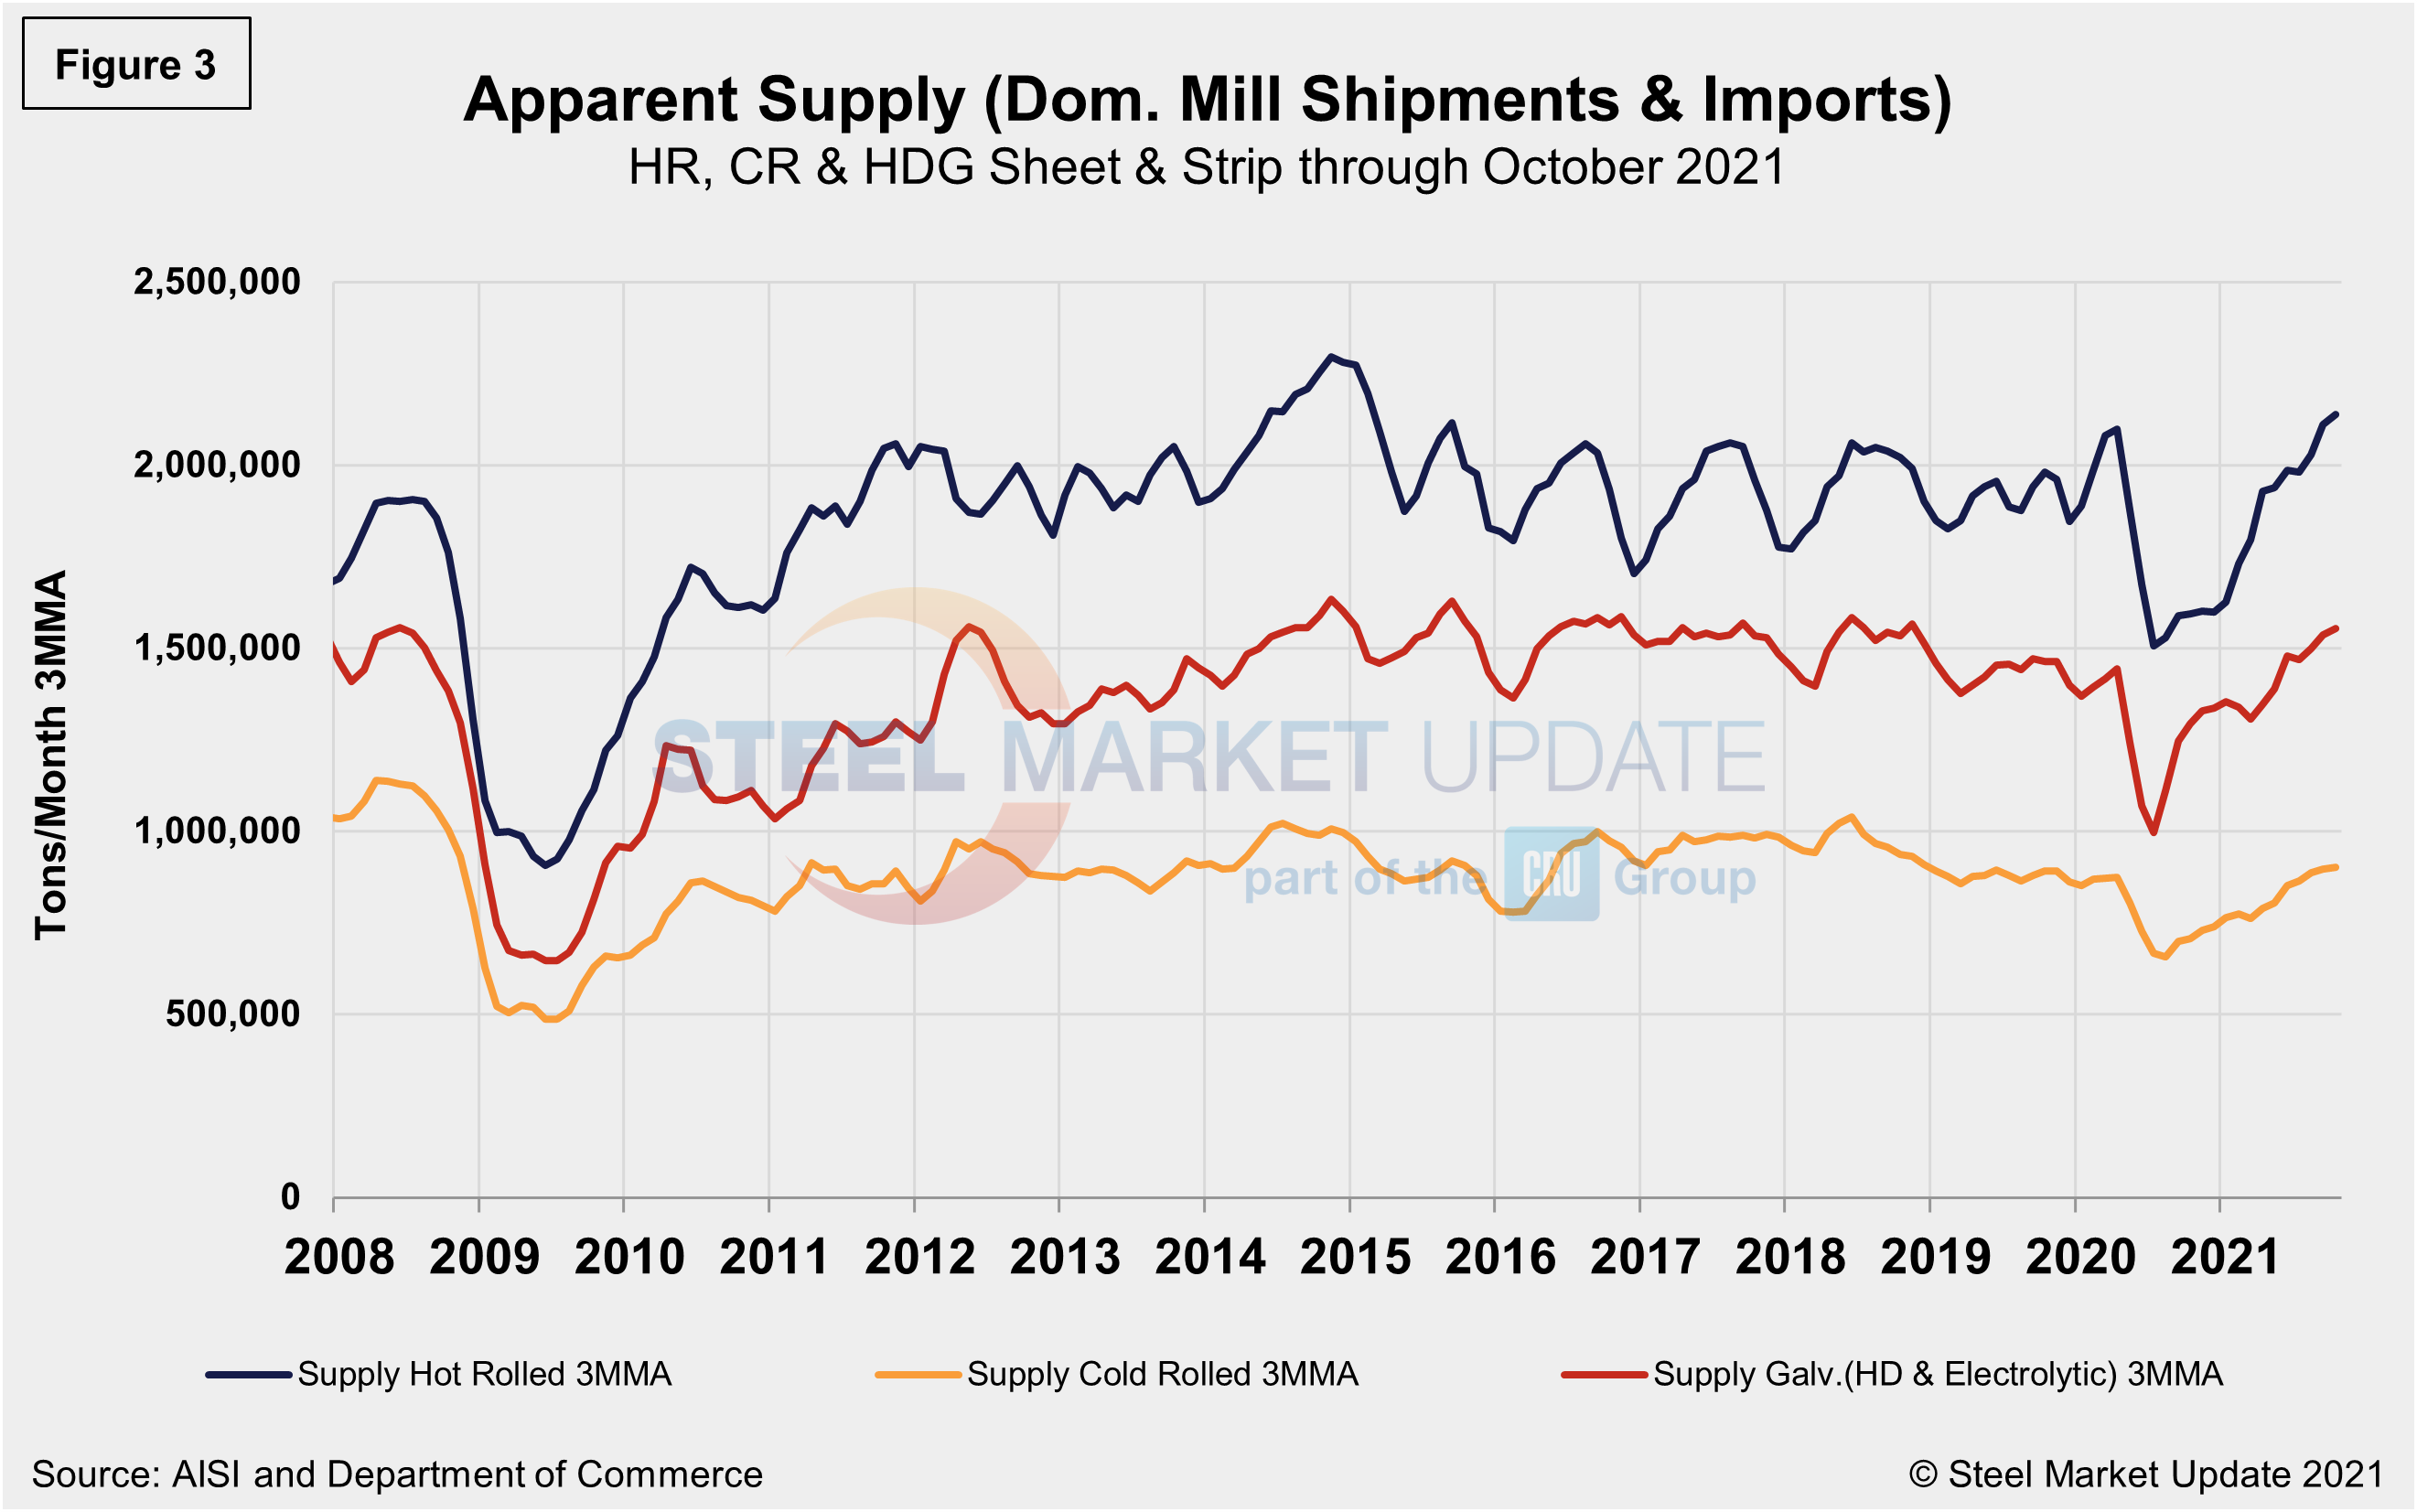
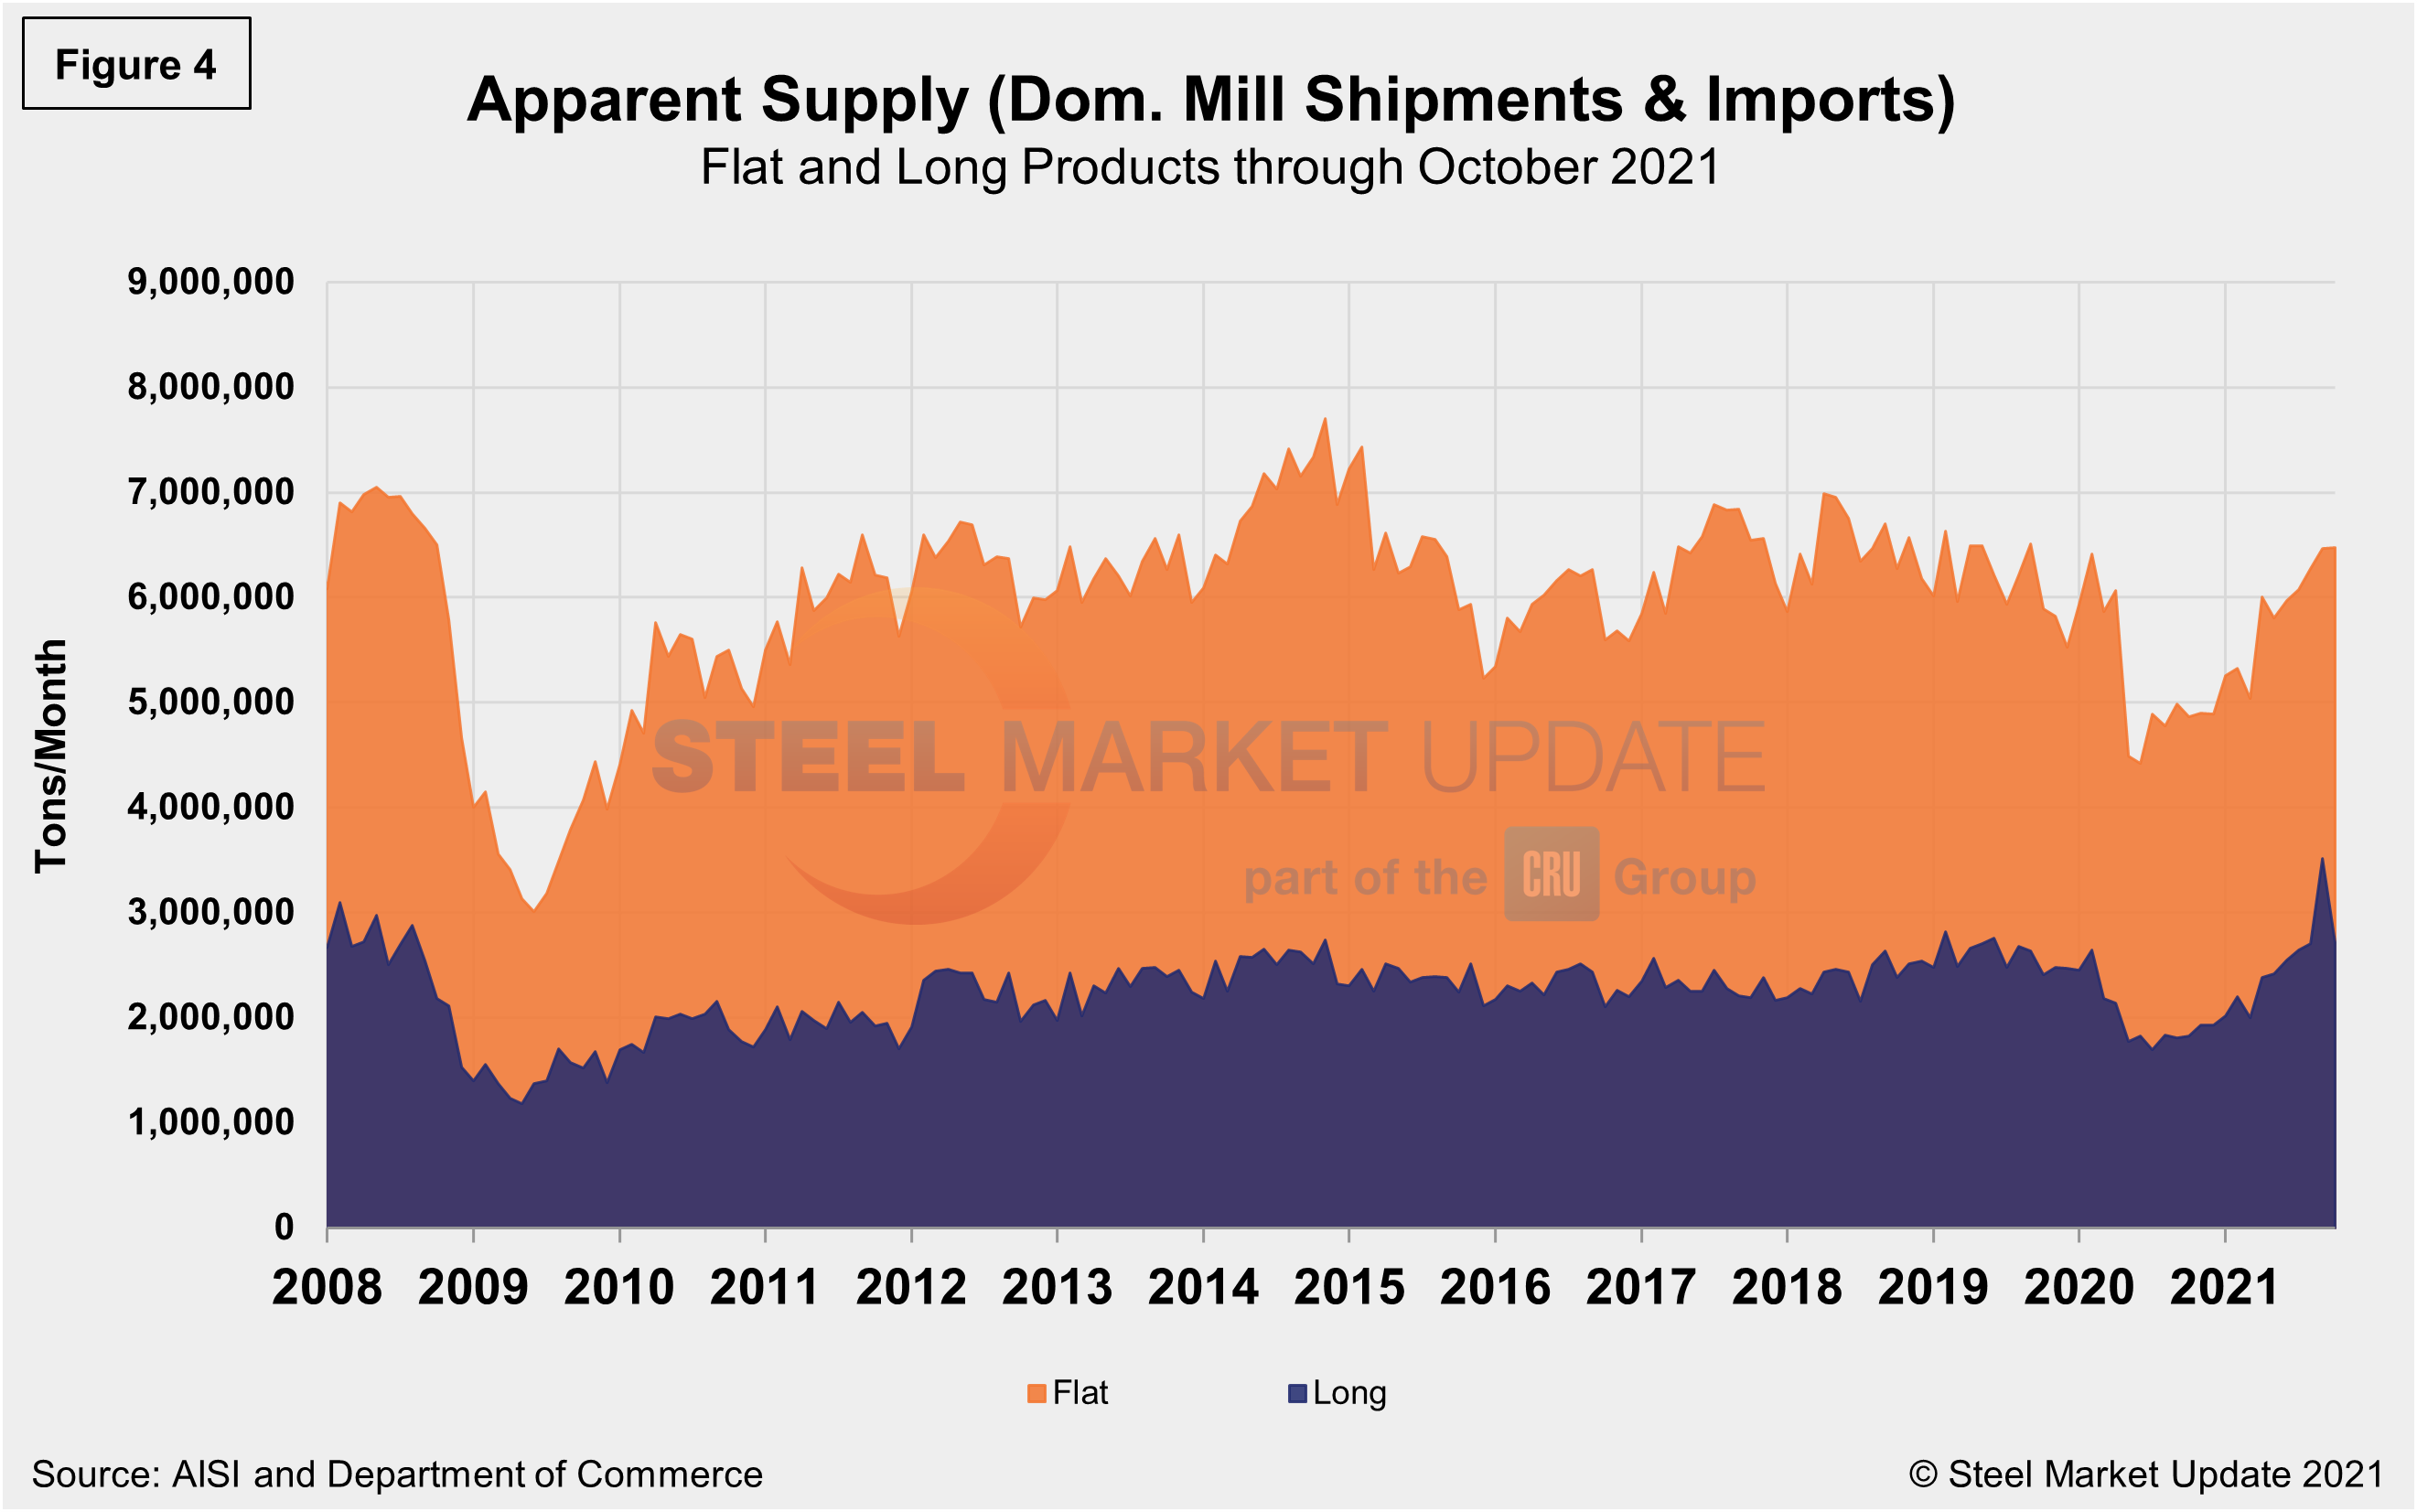
The supply picture for HRC, CRC and HDG since August 2008 as three-month moving averages in Figure 3 and Figure 4 shows the long-term comparison between flat and long products. All three sheet products have experienced some improvement since mid-2020, but galvanized (hot dipped and electrolytic) has seen the strongest rebound, a 60.4% jump since reaching bottom in June 2020, and up 0.4% month on month in October. When compared to the same pre-pandemic period in 2019, the supplies of all three products are presently higher; hot rolled coil at an 11.6% increase is the highest, followed by galvanized (hot dipped and electrolytic) at 10.1% higher, while cold rolled is just 2.0% above the same pre-pandemic period in 2019. In Figure 4, note that these are monthly numbers (not 3MMAs), which show the trend difference between longs and flat products including plate.
By David Schollaert, David@SteelMarketUpdate.com


