

Market Data

January 13, 2022
Producer Prices Edged Up Slightly in December
Written by David Schollaert
Steel Market Update is pleased to share this Premium content with Executive members. For information on upgrading to a Premium-level subscription, email Info@SteelMarketUpdate.com.
Producer prices expanded by 0.2% in December, seasonally adjusted, maintaining their upward climb since reaching the most recent bottom 21 months ago, reports the U.S. Labor Department. The unyielding trend continues to highlight the jammed supply chains and rising inflation.
The Labor Department said that its Producer Price Index (PPI) for final demand, which measures inflation at the wholesale level before it reaches consumers, surged 9.7% in December from the year-ago period. It marked the highest figure on record since the government began tracking the data in 2010.
The core PPI inflation at the wholesale level, which excludes the more volatile measurements of food and energy, increased 0.4% in December, following on a 0.8% jump in November. Over the past 12 months, core prices were up 6.9%.
The PPI data, which cover more than 10,000 goods and services, is helpful in comparing the direction of price changes in the short and medium term. In specific, this analysis is intended to provide subscribers with a view of the relative competitive positions of sheet steel, aluminum, plastic and wood. It also includes some downstream products and a comparison of truck and rail transportation.
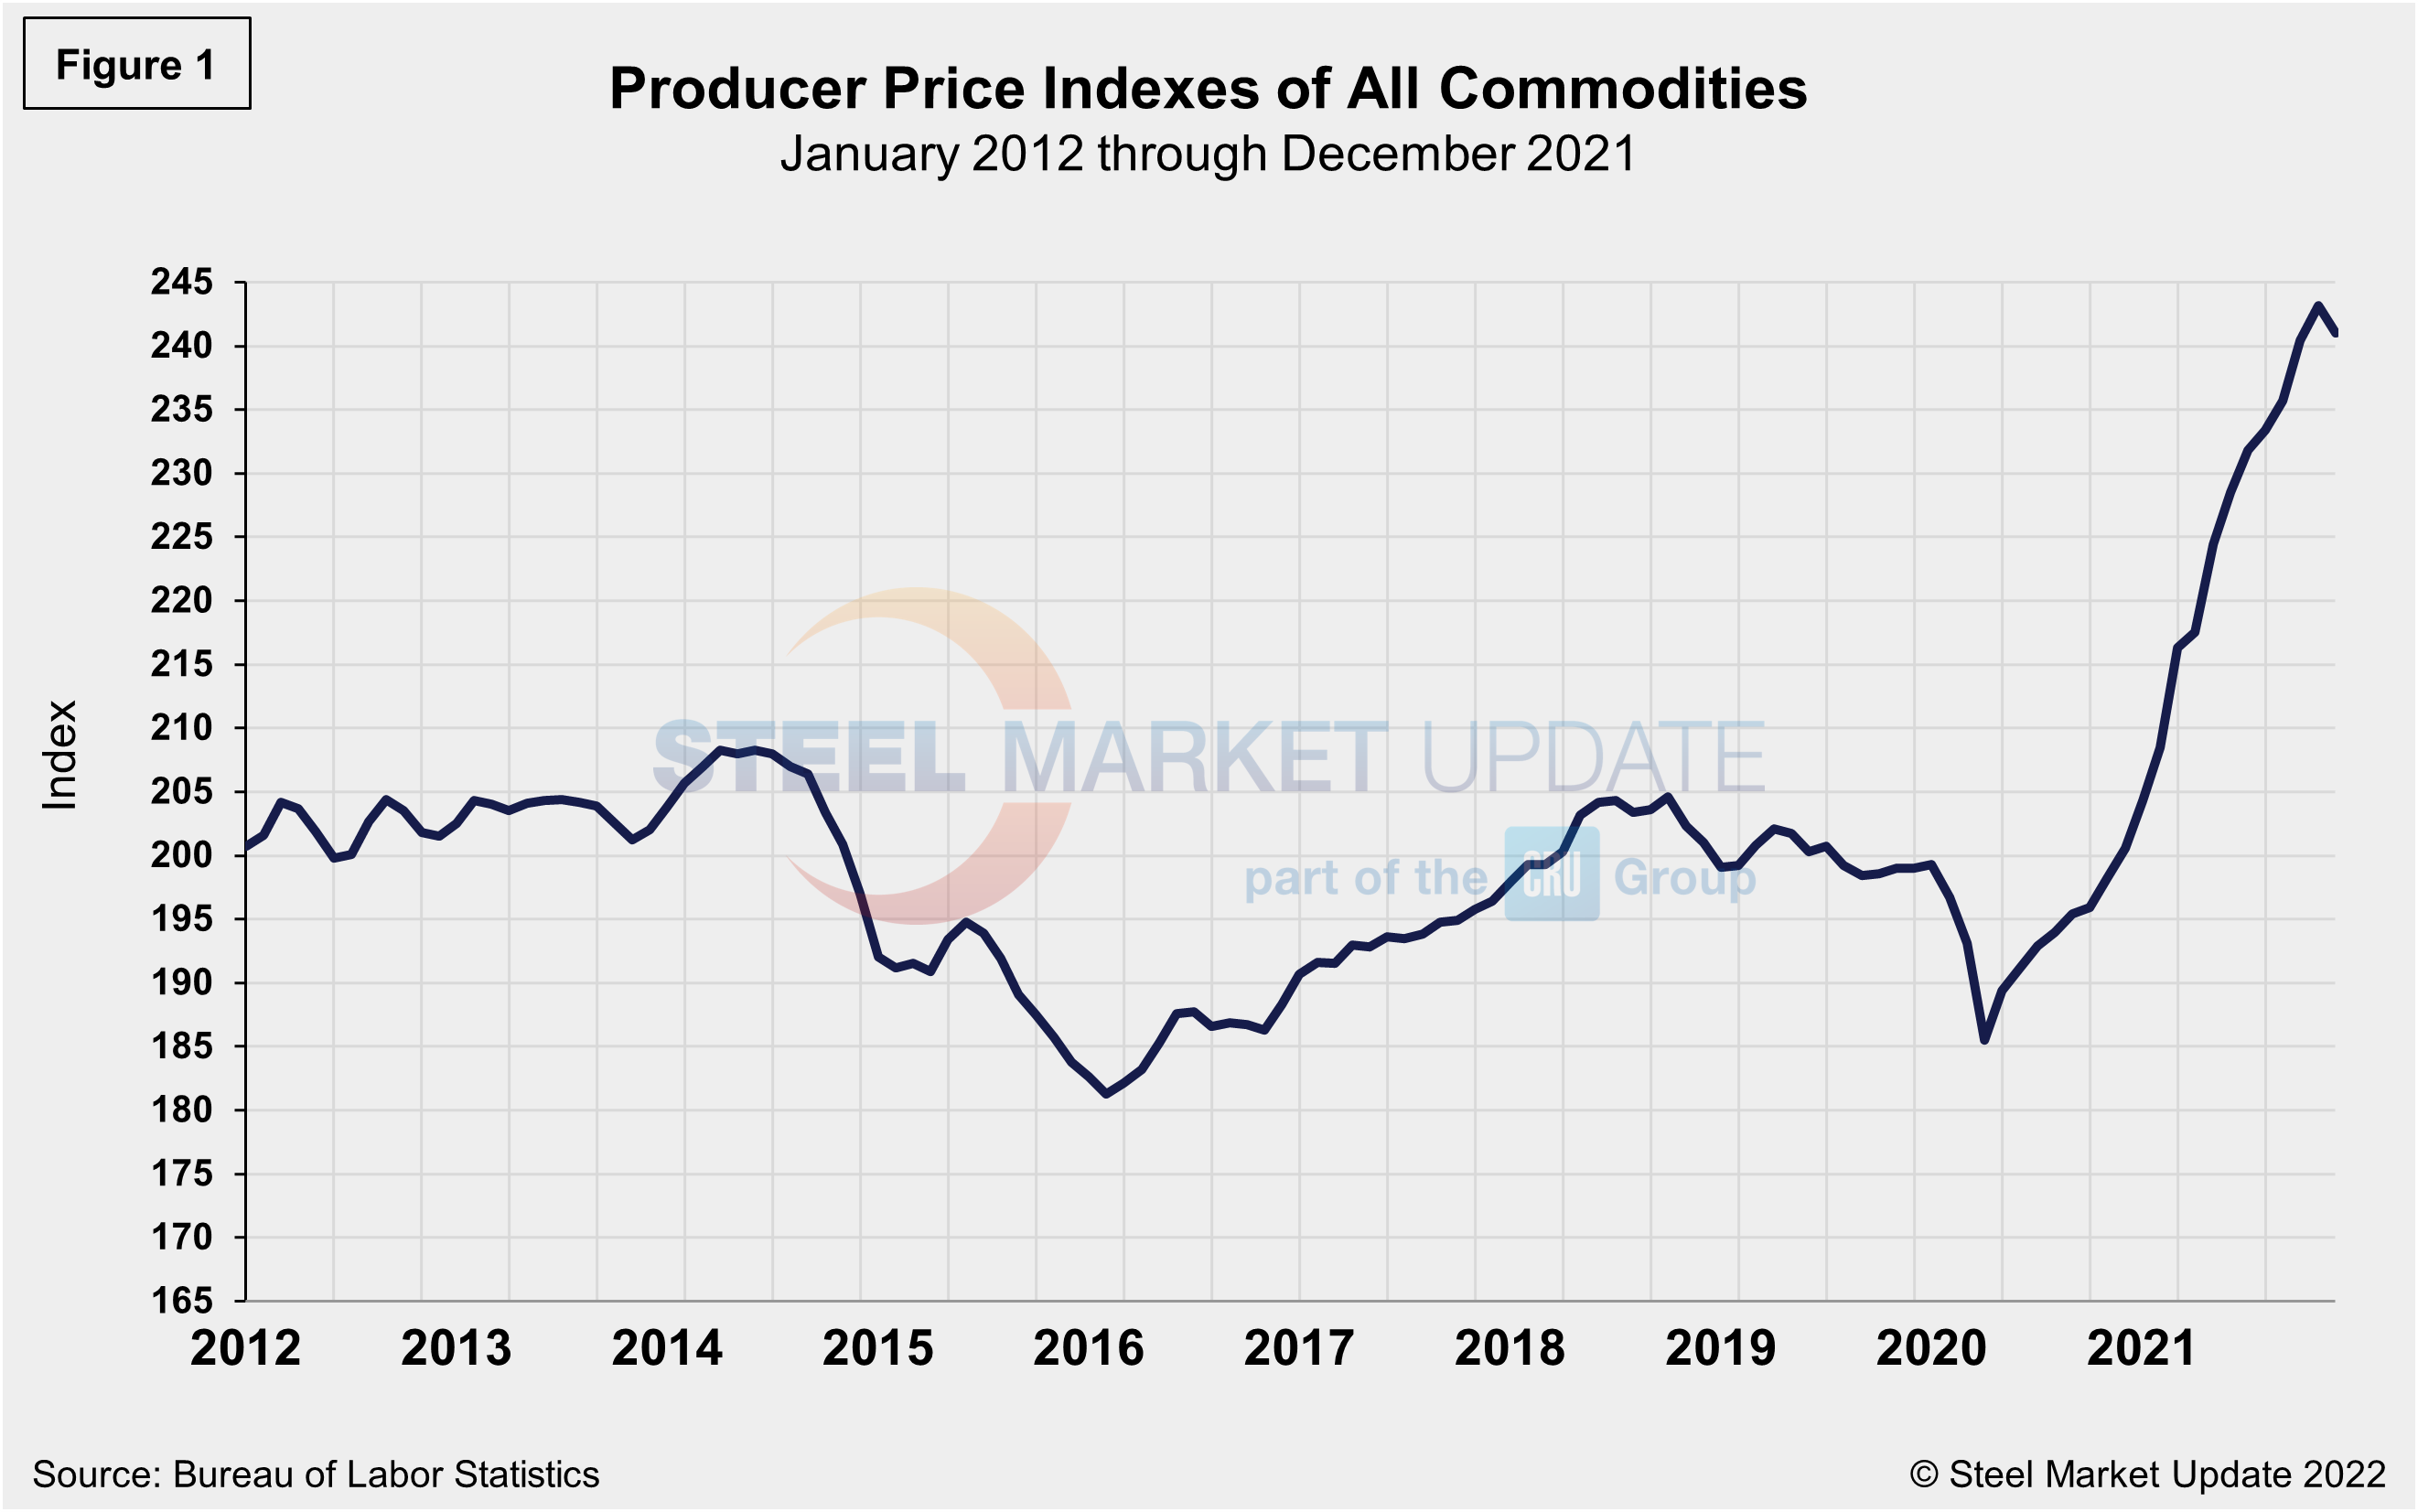
The composite PPI for all commodities (Figure 1) tumbled by more than 4.0% at the onset of the pandemic last spring. The recovery has been outstanding for the U.S. economy and historic for the steel industry. On an unadjusted basis, the final demand index is up 20.1% for the 12 months ended in December, slipping 2.7 percentage points month on month. The PPI was at 241.0 in December, down from 243.6 in November, but up from 200.6 one year ago.
SMU’s benchmark hot-rolled coil price range stood at $1,400-$1,560 per net ton ($70.00-$78.00/cwt) with an average of $1,480 per ton ($74.00/cwt) FOB mill, east of the Rockies as of Jan. 11. HRC prices have declined by $190 per net ton since SMU’s PPI report last month. The past year’s surge in steel prices peaked in September and has declined since then. PPI prices have seen a slowdown in their rate of rise, with a slight dip in December, but have not yet shown clear signs of a downturn as seen in SMU’s HRC benchmark.
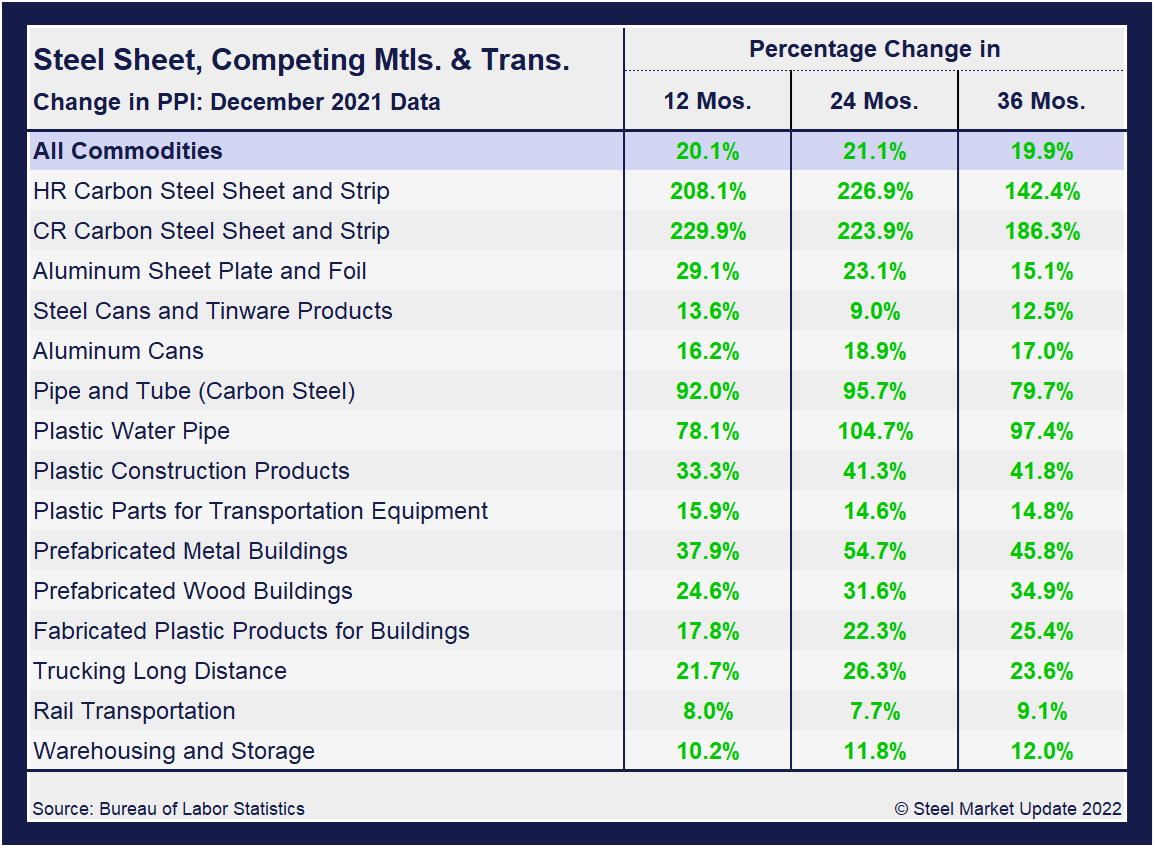
A summary of each segment on a year over one-, two- and three-year basis is shown in the table below. The gain/loss pattern is shown by the color codes; rising prices are considered positive. The positive swing on a 12-month basis is not a surprise, as the market has rebounded from the initial coronavirus collapse. The growth at 24 months, but more importantly the 36-month level, however, is significant. The clear surge further reinforces this historic recovery and growth trajectory for the overall economy since the initial COVID fall as inflationary concerns extend. Through December, all 16 sectors were on the rise at the 12-month level, with HR and CR carbon steel sheet and strip showing huge increases of 208.1% and 229.9%, respectively.
Despite the noteworthy growth, last month’s gains are down compared to November, when percentage changes for HR and CR carbon steel sheet and strip were 242.0% and 247.0%, respectively. The shift supports the downtrend seen in steel prices over the past couple of months. Despite that, the 24-month and 36-month increases are of even greater significance, as they include pre-pandemic periods.
The table includes direct comparisons where possible between steel and competing products, while also including plastic products, transportation, warehousing and storage to further highlight current market conditions. Even though there may not be a direct or specific comparison of steel, these PPI numbers clearly match the trend of rising demand and prices seen across the steel market. Construction-related products are up anywhere from 15.9% to 92.0% at the 12-month level, with similar increases for the 24- and 36-month periods as well. Despite growing concerns surrounding the impact of inflation on the marketplace, it has been resilient, surpassing every speculated high. The steady slowdown in the rate of rise has now shifted down for some products. The turn may indicate that the growth momentum has run out of steam and already peaked, as we’ve seen with HRC. Yet, supply-chain bottlenecks may keep PPI indices rising or firm for the time being.
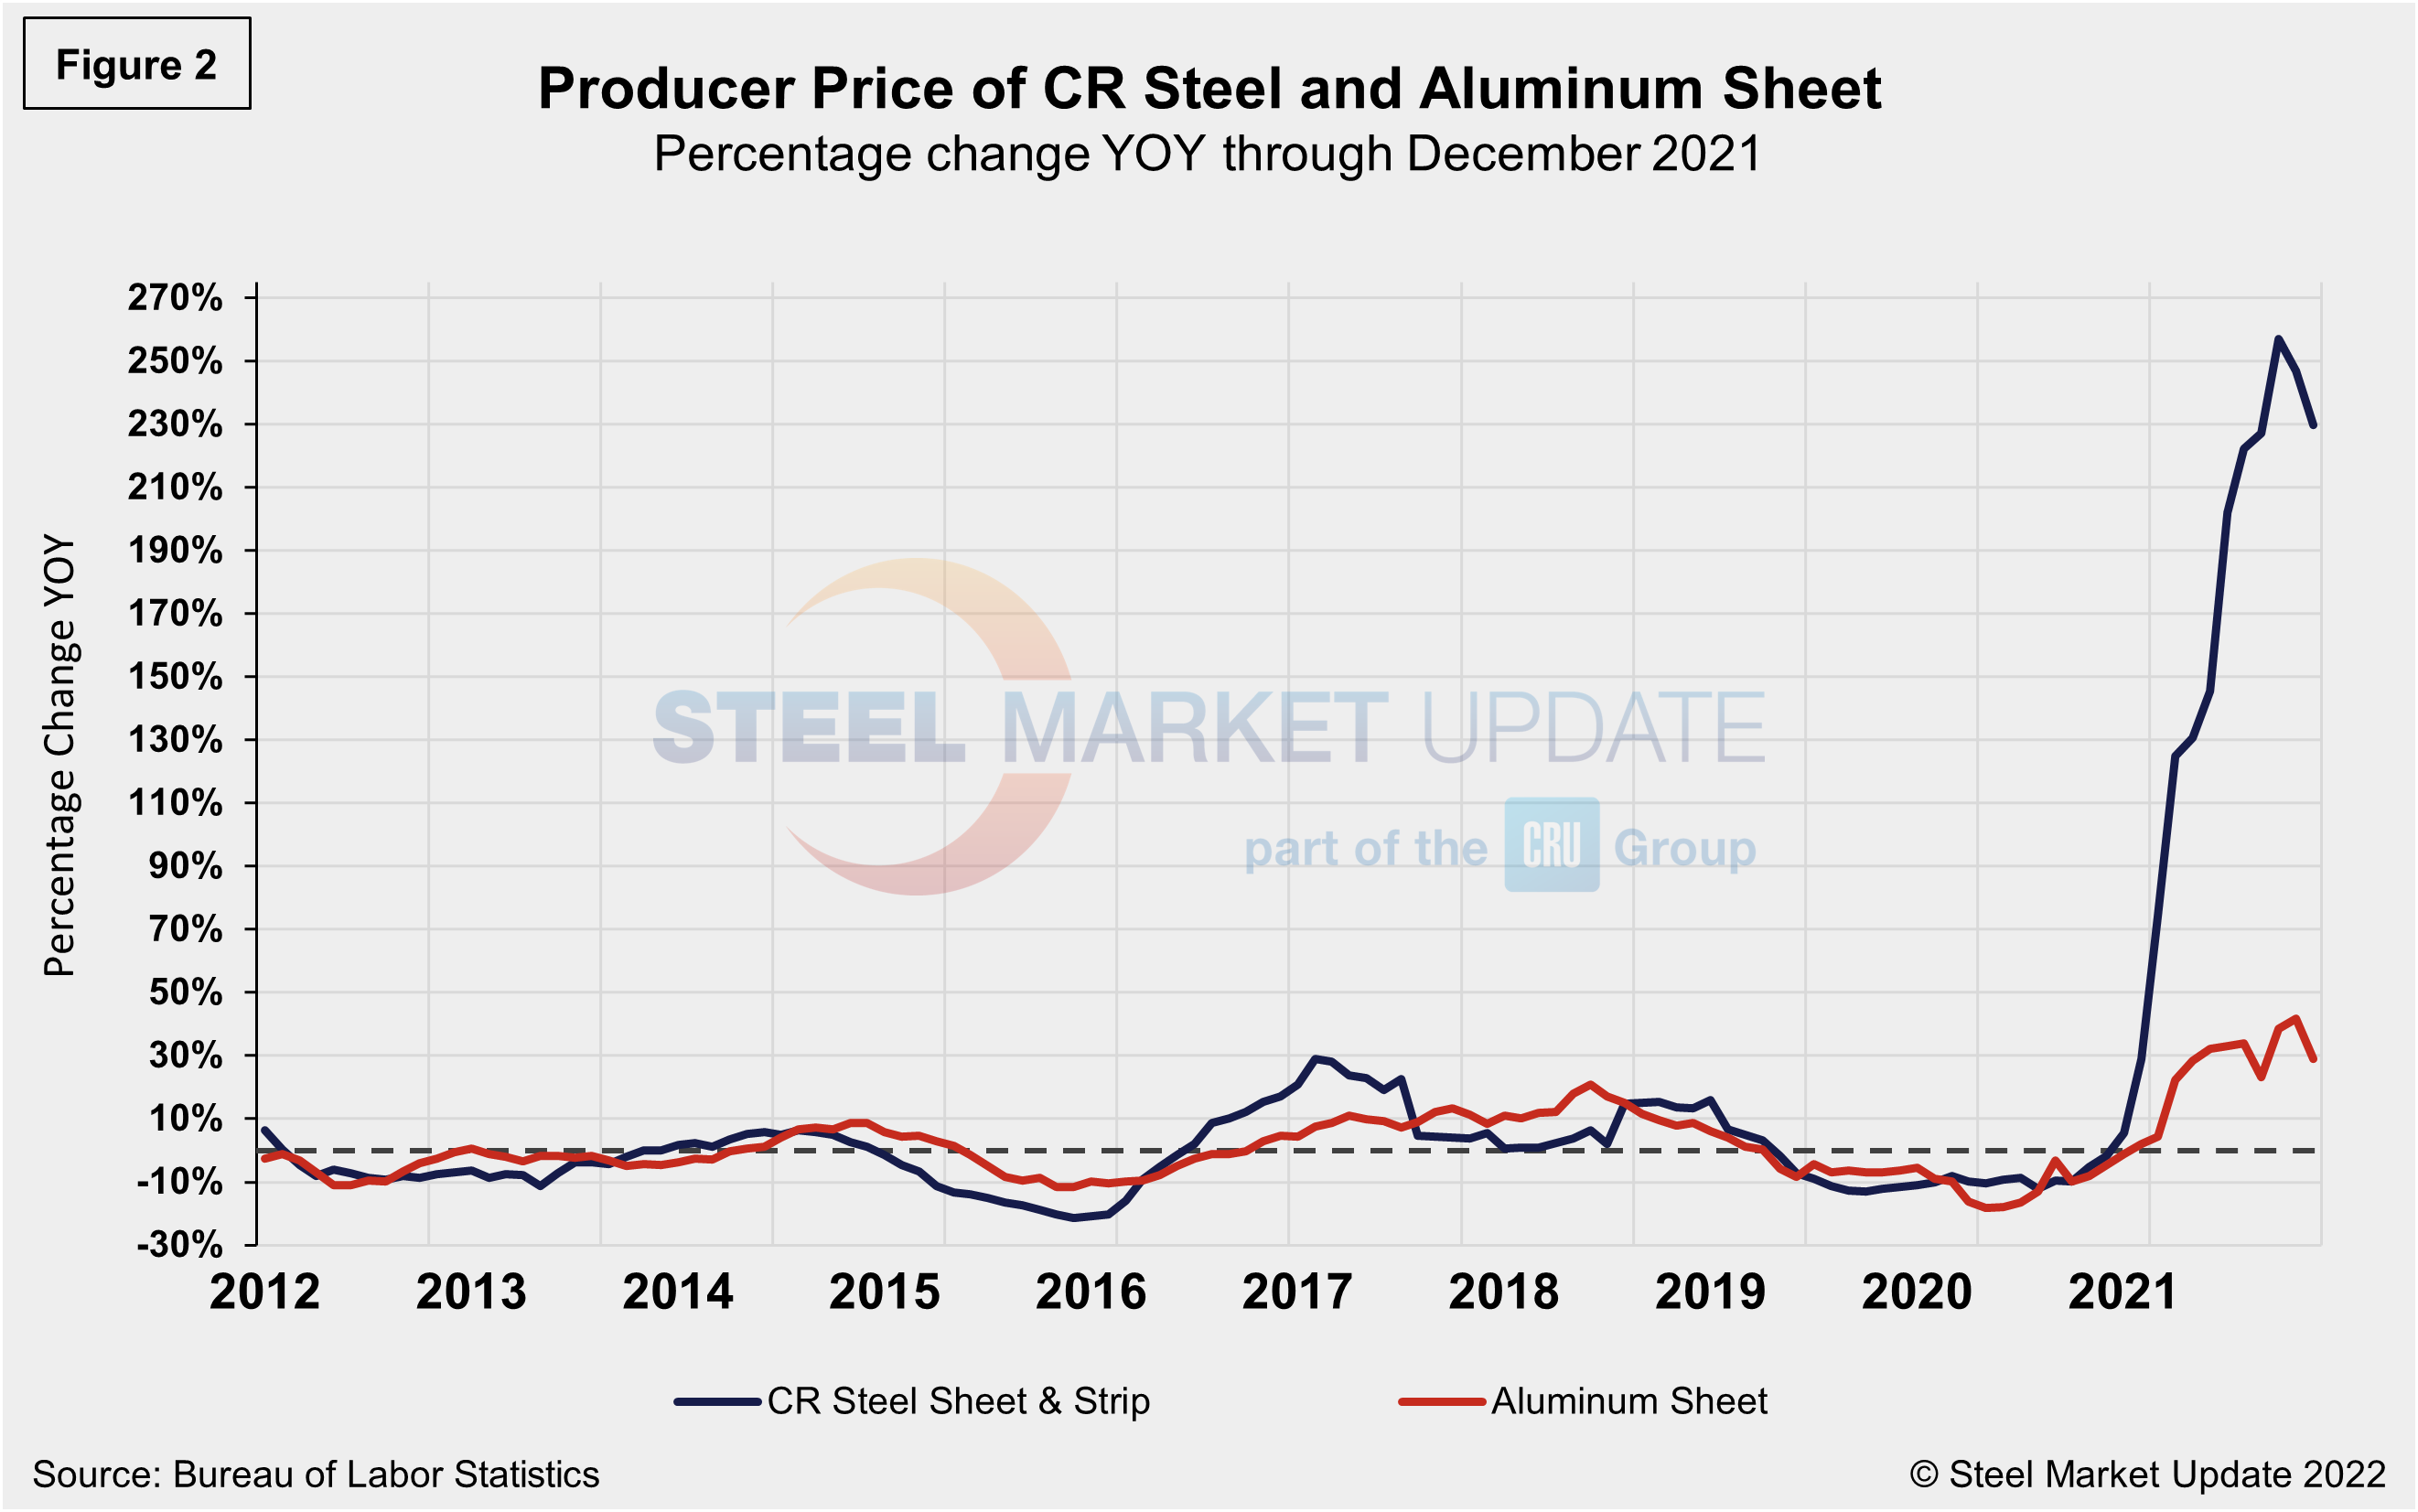
Both steel and aluminum products (Figure 2) have easily overtaken pre-pandemic PPI figures and reached recent highs. Both steel and aluminum products, however, have begun to lose ground, with steel products slipping for the second consecutive month. Comparing the price changes of cold rolled steel sheet and flat rolled aluminum, both recovered from last year’s losses and reached historic highs. The trajectory in cold rolled steel sheet prices had undoubtedly overshadowed the impressive rebound in flat rolled aluminum. Both have edged down slightly on a year-on-year comparison through December.
Cold rolled steel prices reached positive territory for the first time since last January after the initial fall in April 2020. Since, they jumped by 229.90% through December, but are down from 256.6% in October. Flat rolled aluminum, by comparison, is presently at 29.1%, down 12.6 percentage points from November’s total. Cold rolled steel price gains have shown significant growth since July. Its earlier growth rate lead on a percentage basis over hot rolled steel prices has shifted though. In December, cold rolled slipped 0.7% month on month, compared to a 1.3% decrease for hot rolled.
Although aluminum prices are well behind steel in terms of growth, they had a strong run, improving month on month for nearly a year since last October. In contrast, steel tinware and aluminum cans have remained largely stable over the past 15 months, as their gains and losses have not been as historically accentuated. Although steel tinware was unchanged for the second straight month, aluminum cans grew by 5.8% month on month and were up 12.8% year on year through December.
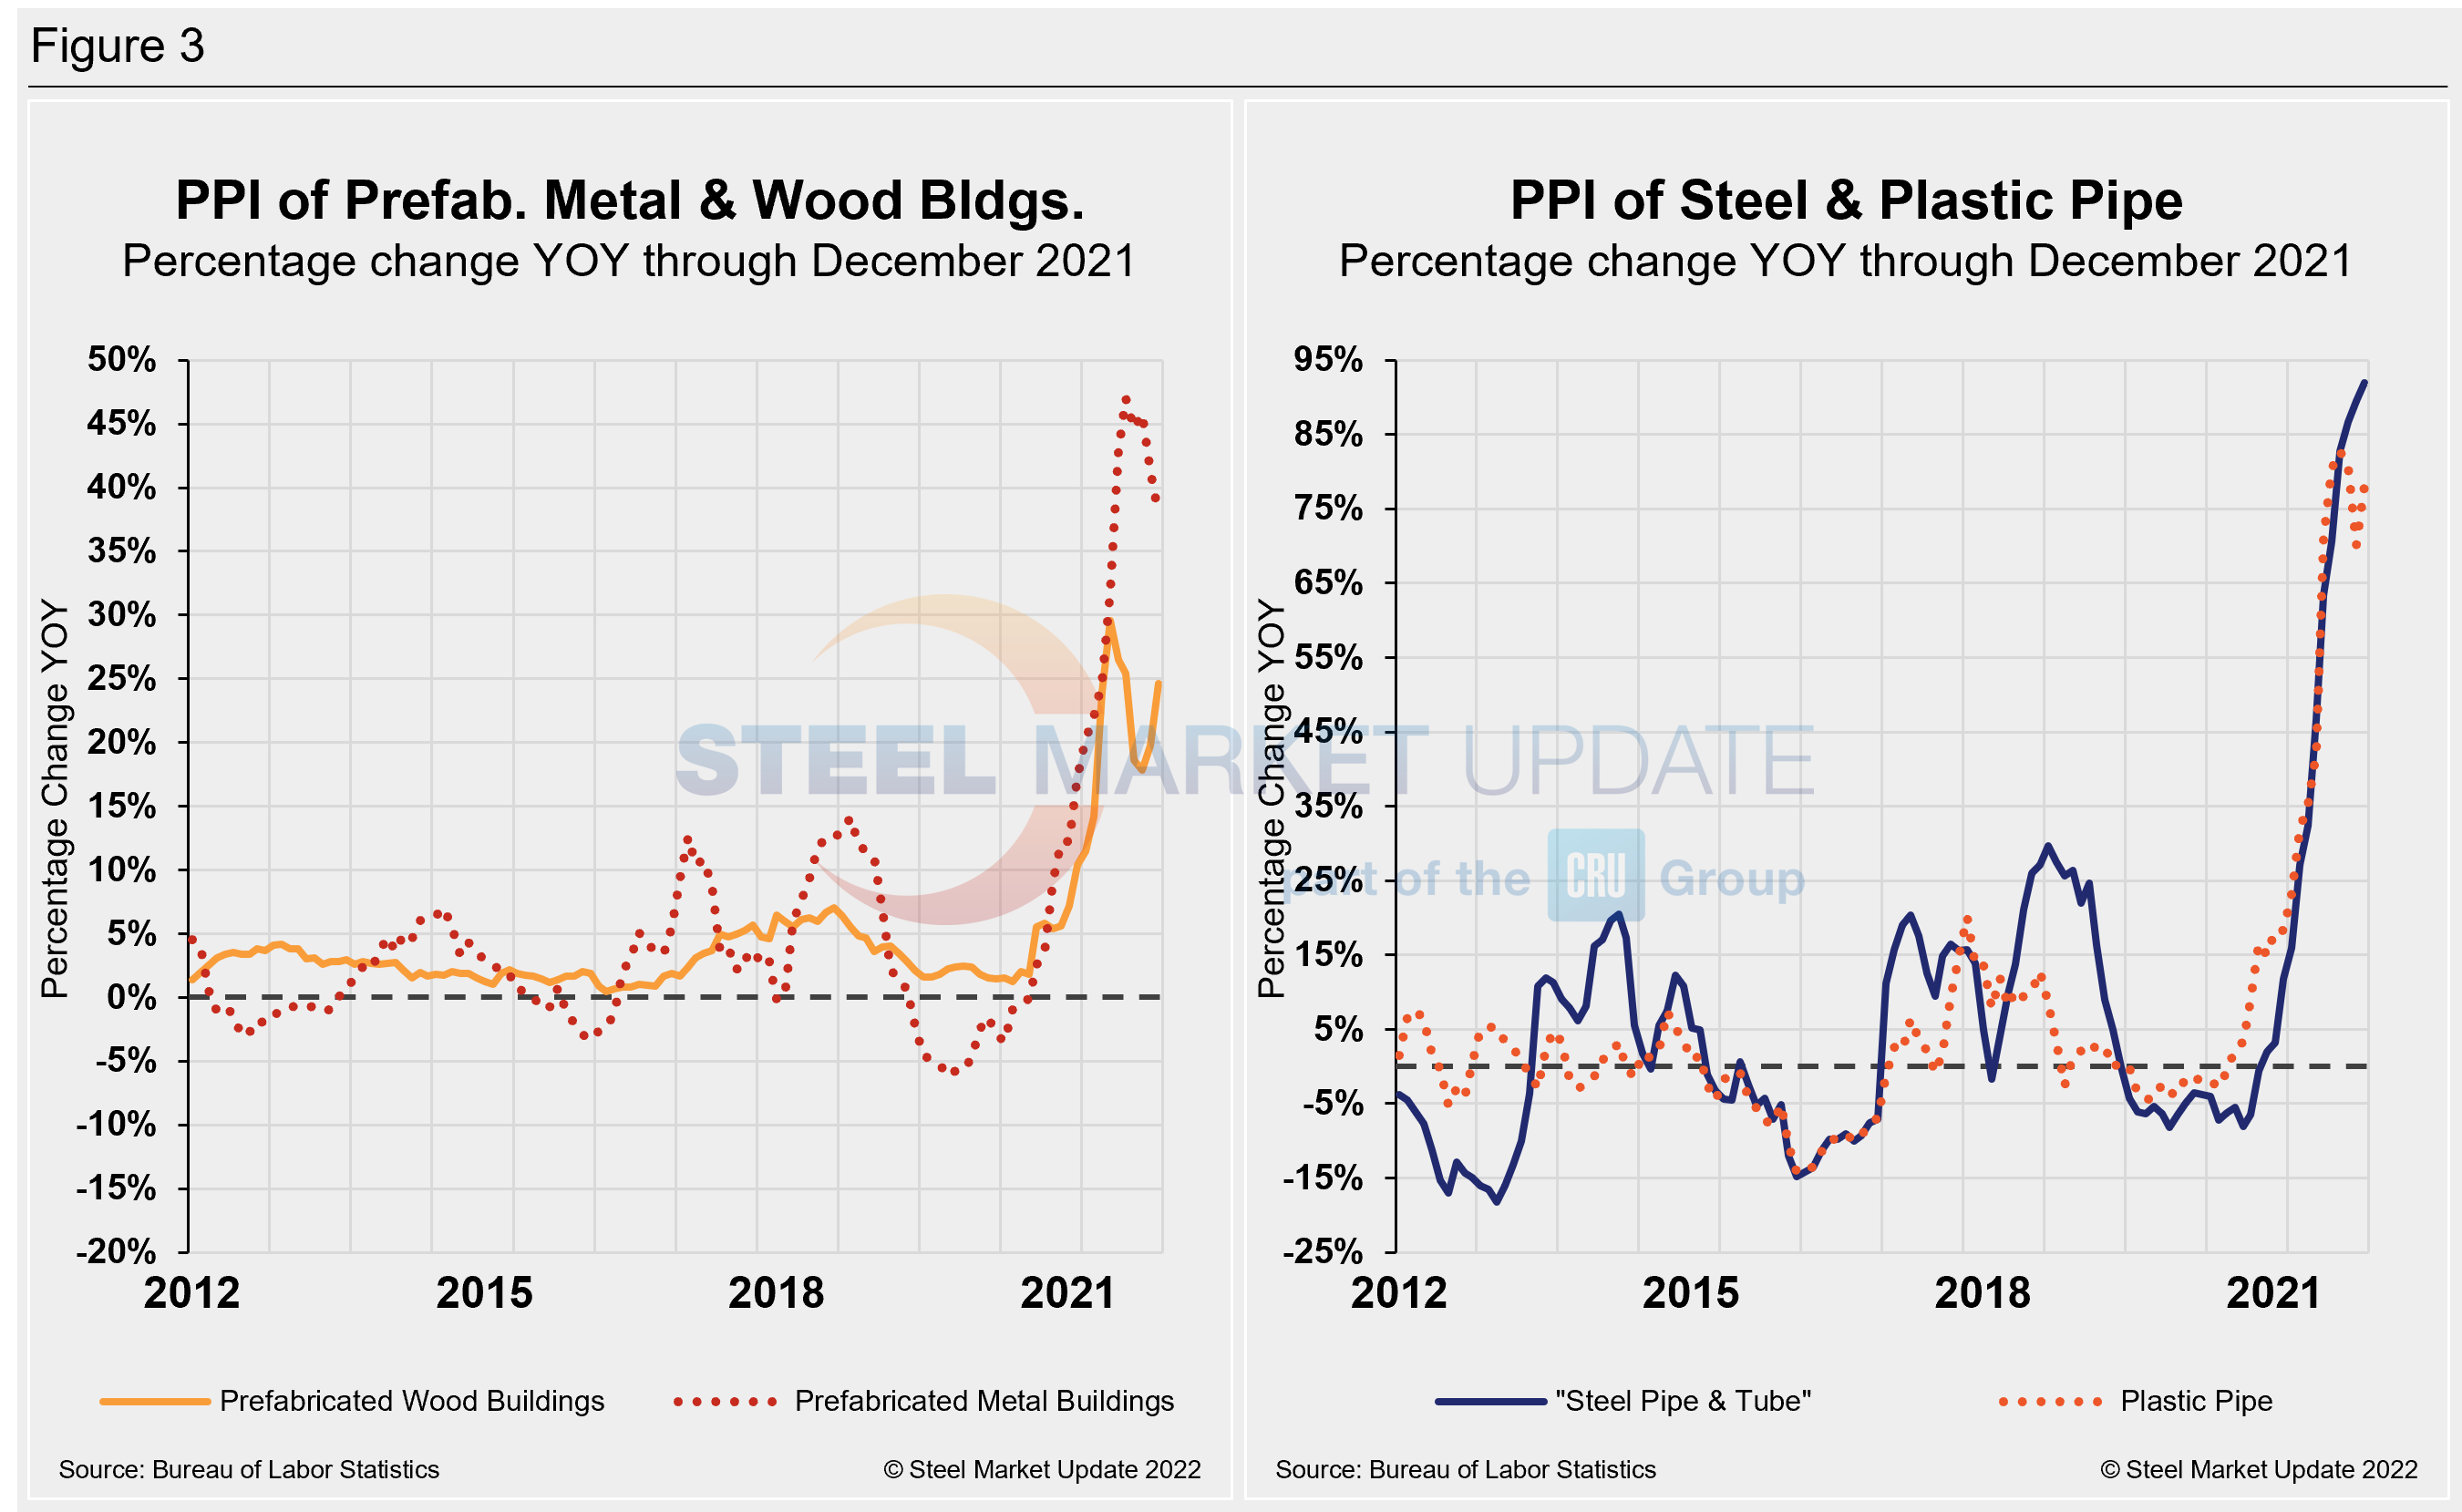
Prices of prefabricated metal buildings and prefabricated wood buildings have both seen significant increases since the beginning of 2021, but the rate of growth has diverged over the past few months, with prices for prefabricated wood buildings expanding at a slightly stronger rate to close out the year. Prefabricated steel building prices fell to a negative 3.5% last June, but rallied to a positive by 37.9% over 17 months, but down 3.4 percentage points month on month. A similar trend was seen for prefabricated wood buildings over the same period, at 24.6% growth. Momentum has shifted of late, as prefabricated wood buildings have expanded repeatedly, while prefabricated metal buildings slipped for the first time in December.
The prices of steel and plastic pipe have both experienced big swings due to COVID-19 as well. Steel pipe prices dropped to a negative 8.0% through September last year, but rallied to a positive 92.0% 15 months on, with a 2.7% increase in December. By comparison, plastic pipe has rallied by more than 73.0%% since January, reaching a positive 78.1% growth in December on a year-on-year basis. Figure 3 is a side-by-side comparison of prefabricated buildings and pipe price dynamics.
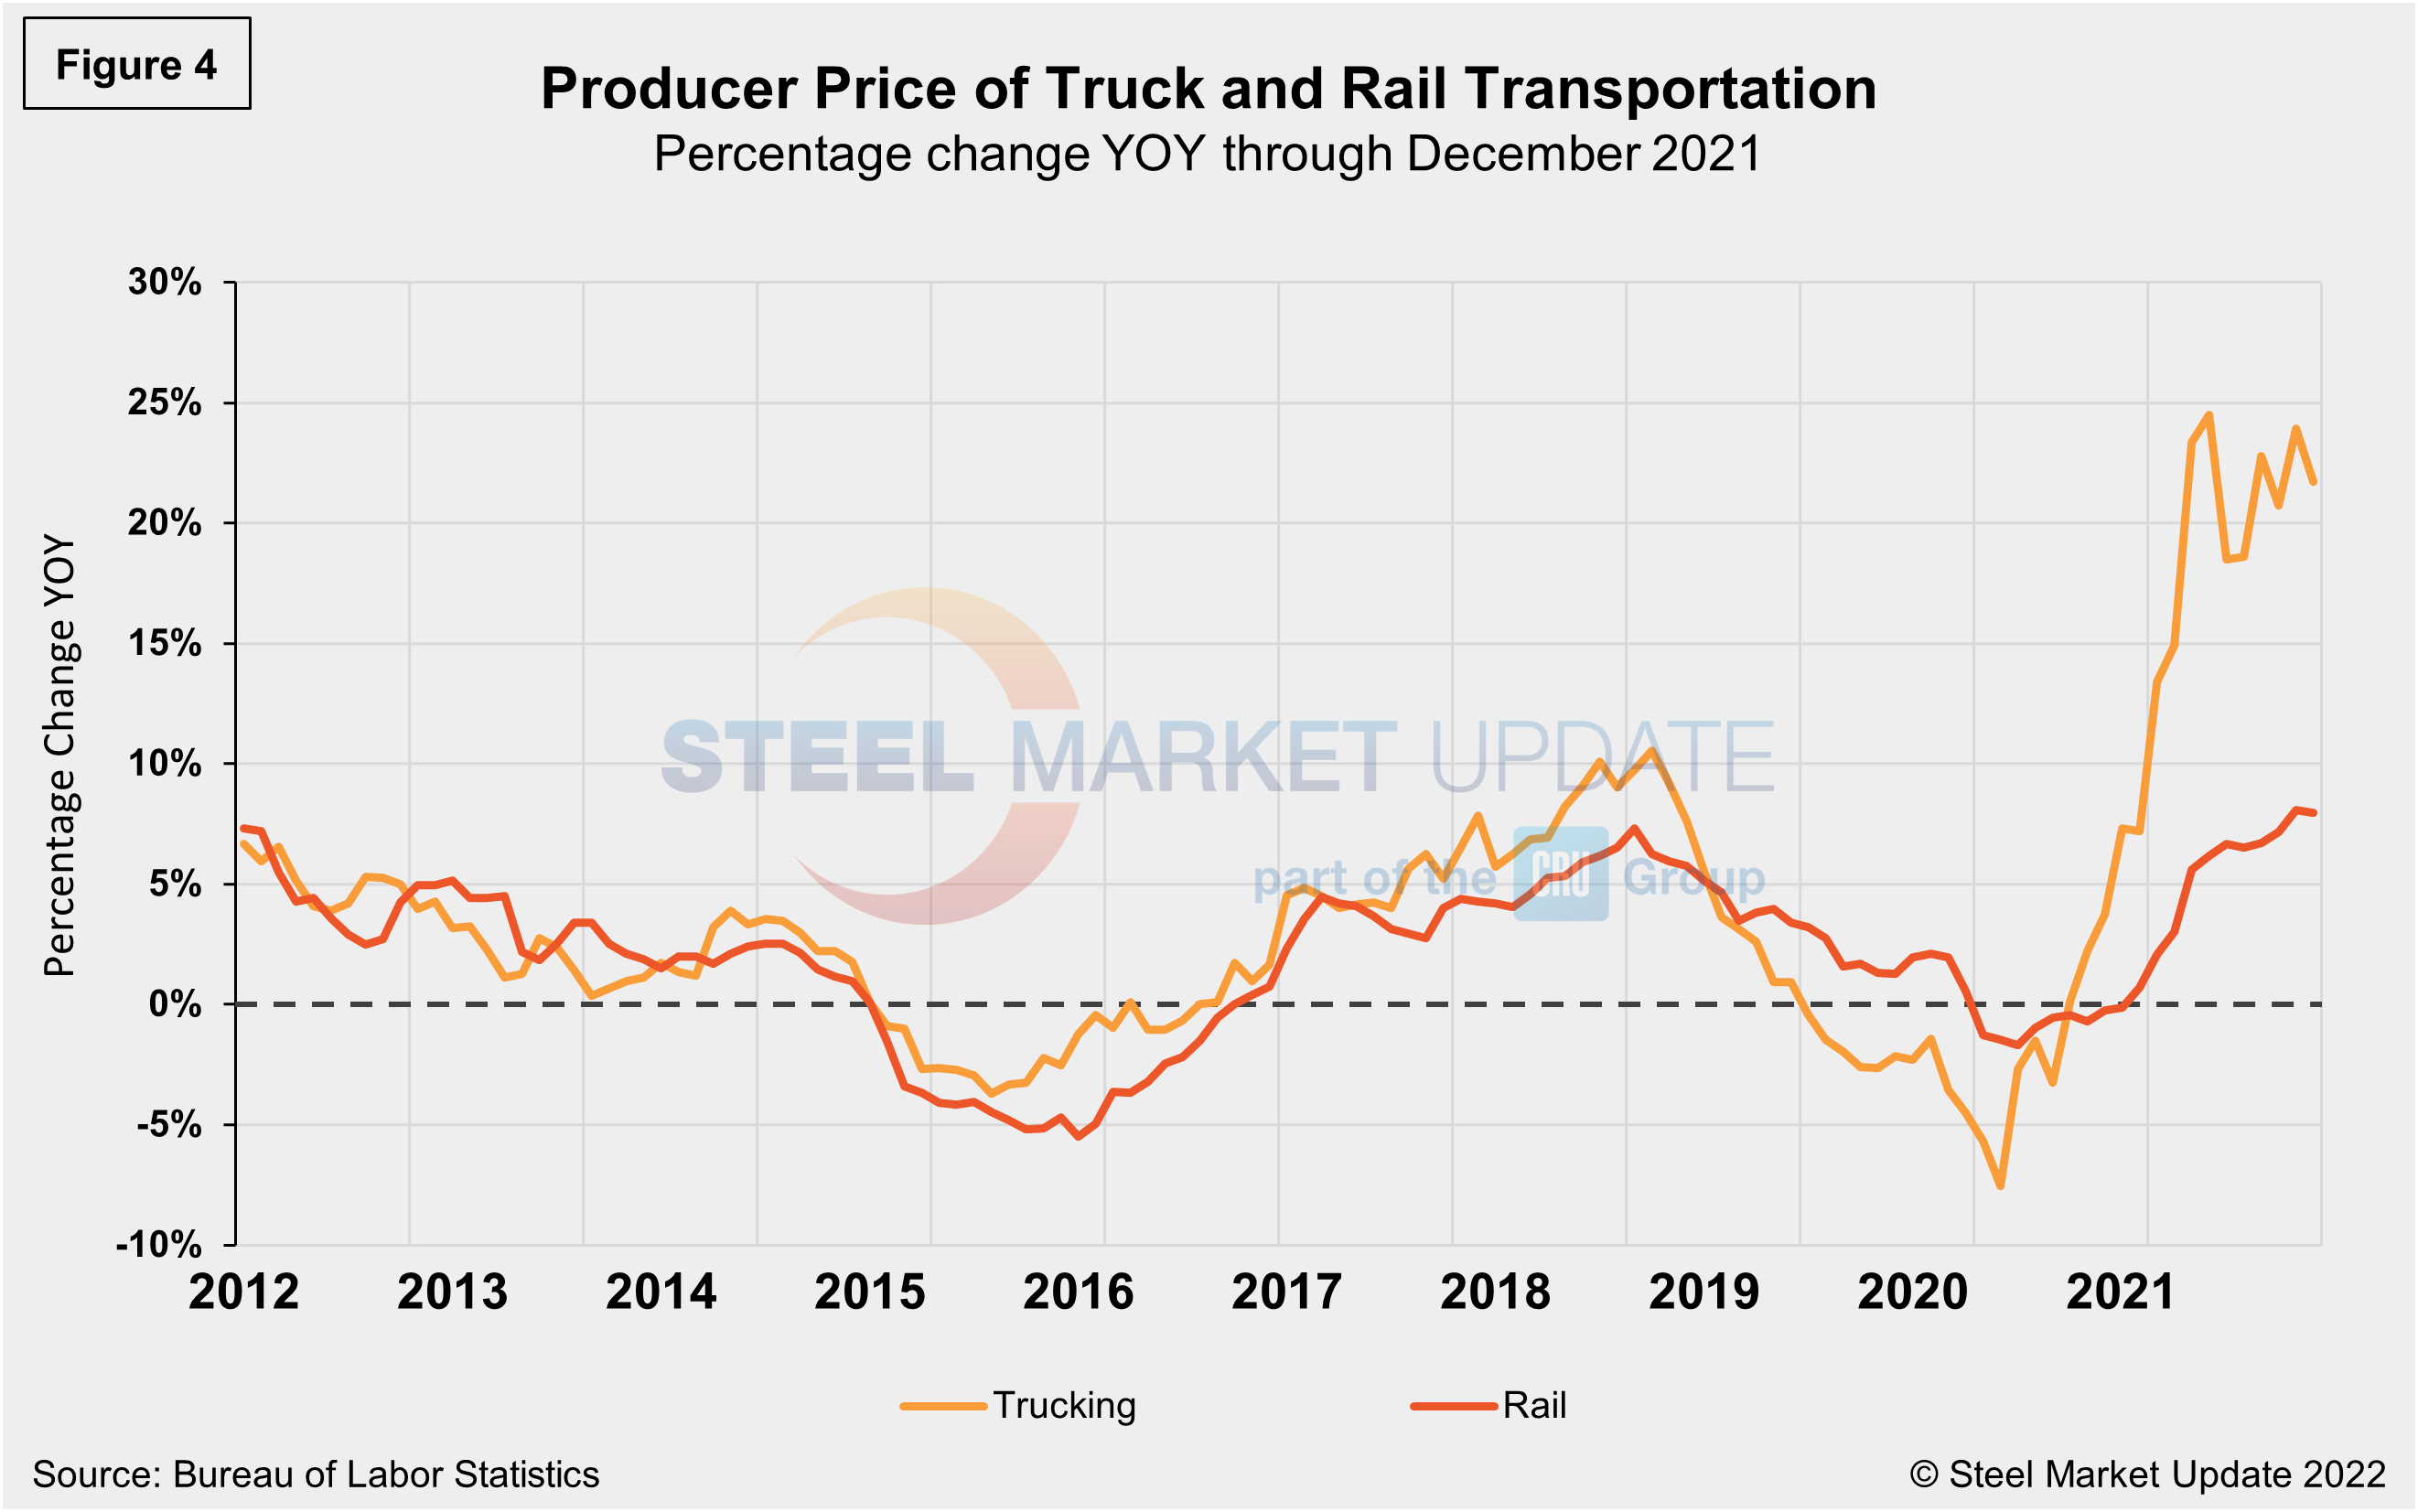
The growth of truck transportation prices has far exceeded those of rail (Figure 4) since they both bottomed out in June of last year. Rail dipped to a negative 1.7% last June and has since slowly corrected to a positive 8.0% through December 2021. Long distance trucking, on the other hand, recovered to positive 23.98% in November after falling to negative 7.5% last July. Trucking has been a bit erratic of late, however, the increased freight pricing over the past year has been a significant factor for steel buyers dealing with historically high finished steel prices. Even though long-distance grew by just 0.3% month on month, freight costs have experienced the most significant increase in more than a decade.
Warehousing and storage prices also have risen. After initially falling to a negative 2.3% at the onset of the global pandemic, they had rebounded to a positive 10.0% through October. Prices for warehousing and storage slipped 2.0% in November to a reading of 118.6, but expanded 2.9% month on month in December to 122.0.
The official description of this program from the BLS reads as follows: “The Producer Price Index (PPI) is a family of indexes that measure the average change over time in the prices received by domestic producers of goods and services. PPIs measure price change from the perspective of the seller. This contrasts with other measures, such as the Consumer Price Index (CPI). CPIs measure price changes from the purchaser’s perspective. Sellers’ and purchasers’ prices can differ due to government subsidies, sales and excise taxes, and distribution costs. More than 10,000 PPIs for individual products and groups of products are released each month. PPIs are available for the products of virtually every industry in the mining and manufacturing sectors of the U.S. economy. New PPIs are gradually being introduced for the products of industries in the construction, trade, finance, and services sectors of the economy. More than 100,000 price quotations per month are organized into three sets of PPIs: (1) stage-of-processing indexes, (2) commodity indexes, and (3) indexes for the net output of industries and their products. The stage-of-processing structure organizes products by class of buyer and degree of fabrication. The commodity structure organizes products by similarity of end use or material composition. The entire output of various industries is sampled to derive price indexes for the net output of industries and their products.
By David Schollaert, David@SteelMarketUpdate.com


