

Market Data

February 11, 2022
December Shipments and Supply of Steel Products
Written by David Schollaert
Total mill shipments of steel products rebounded in December to 8.985 million tons, a 7.8% increase over November’s 8.334 million tons, and the highest monthly total for 2021. Apparent supply saw a 5.0% boost in December, rising for the second straight month following repeated decreases in September and October.
This analysis is based on steel mill shipment data from the American Iron and Steel Institute (AISI) and import-export data from the U.S. Department of Commerce (DOC). The analysis summarizes total steel supply by product from 2008 through December 2021 and year-on-year changes.
The supply/demand differential continues to shift as supply continues to top demand. Scaling back was seen in December, as both imports and exports fell during the month by 11.8% and 11.3%, respectively. The rise in shipments (exports plus domestic production) during the month was driven, however, by a 9.4% rise in domestic production.
Domestic mill utilization averaged 81.9% through December, slipping 1.9 percentage points versus month-ago totals. Mill lead times continued to shorten, averaging just over four weeks, while steel prices kept falling throughout the month as supply outpaced demand.
SMU’s benchmark hot-rolled coil price fell by nearly $200 per net ton in December, closing out the year at an average of $1,650 per net ton FOB mill, east of the Rockies. The downtrend has accelerated, with HR reaching an average of $1,190 per net ton as of Feb. 8. Raw steel production shown below in Figure 1 is based on weekly data from the AISI displayed as four-week moving averages through Jan. 1, 2022.
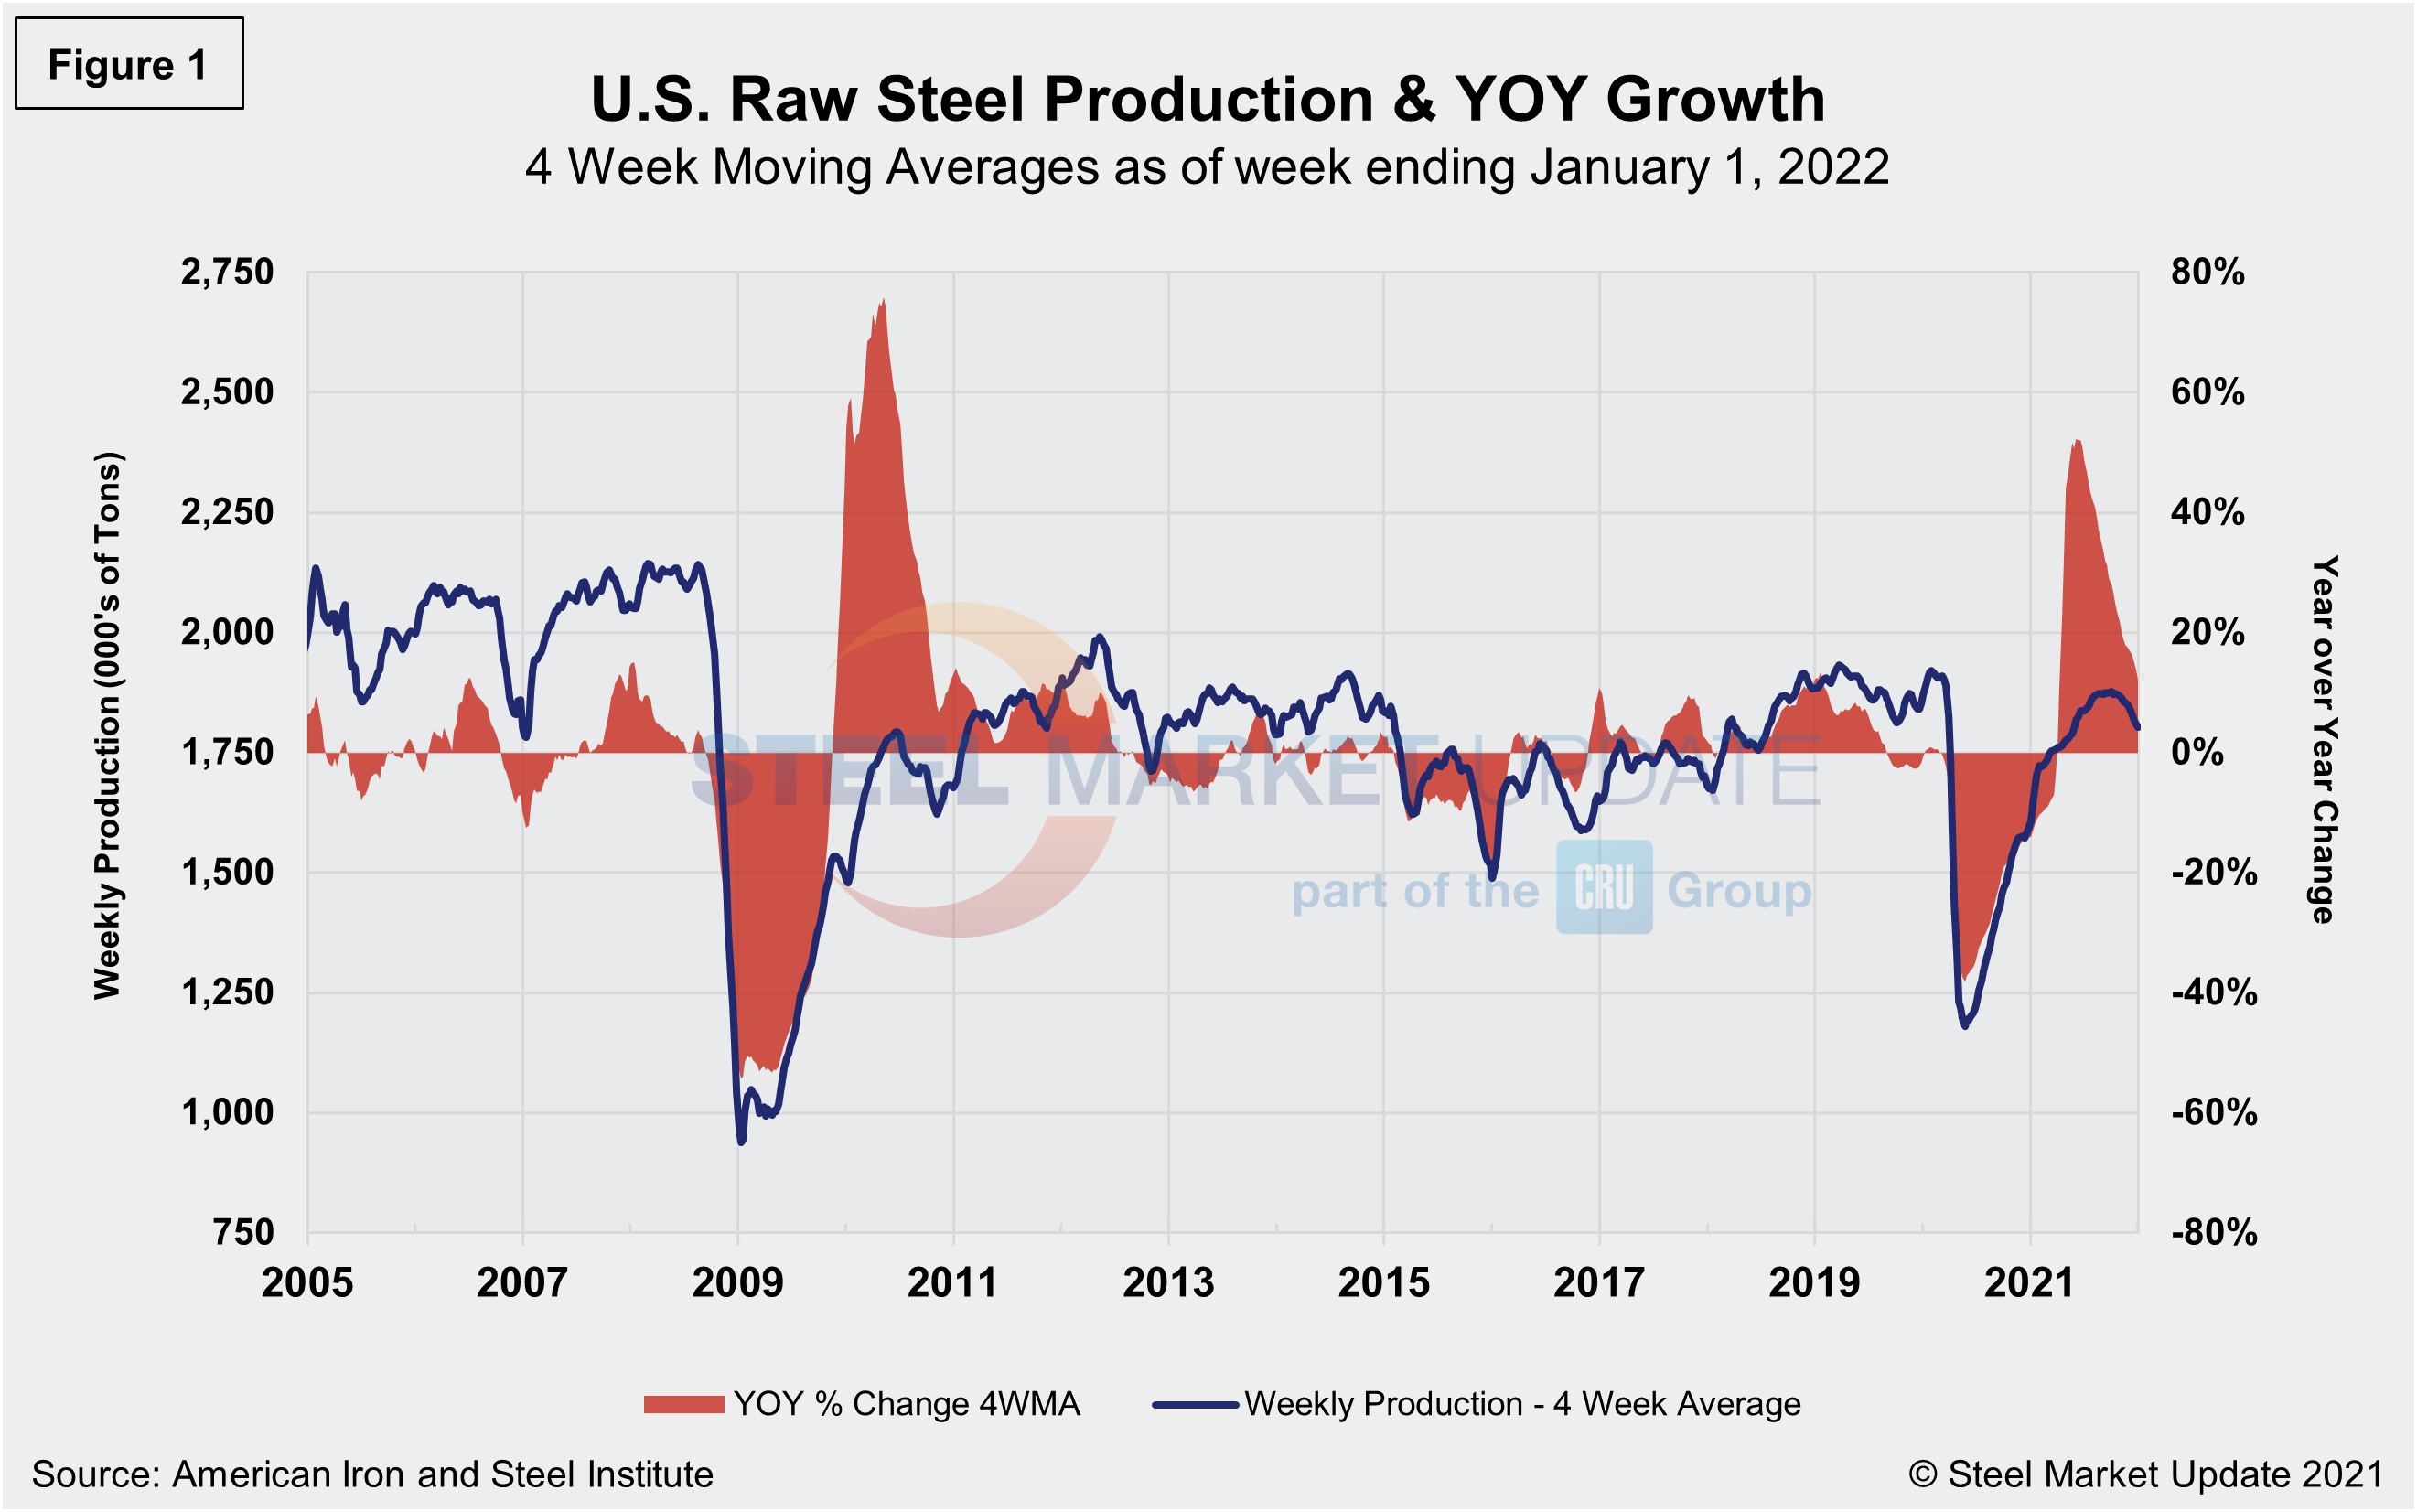
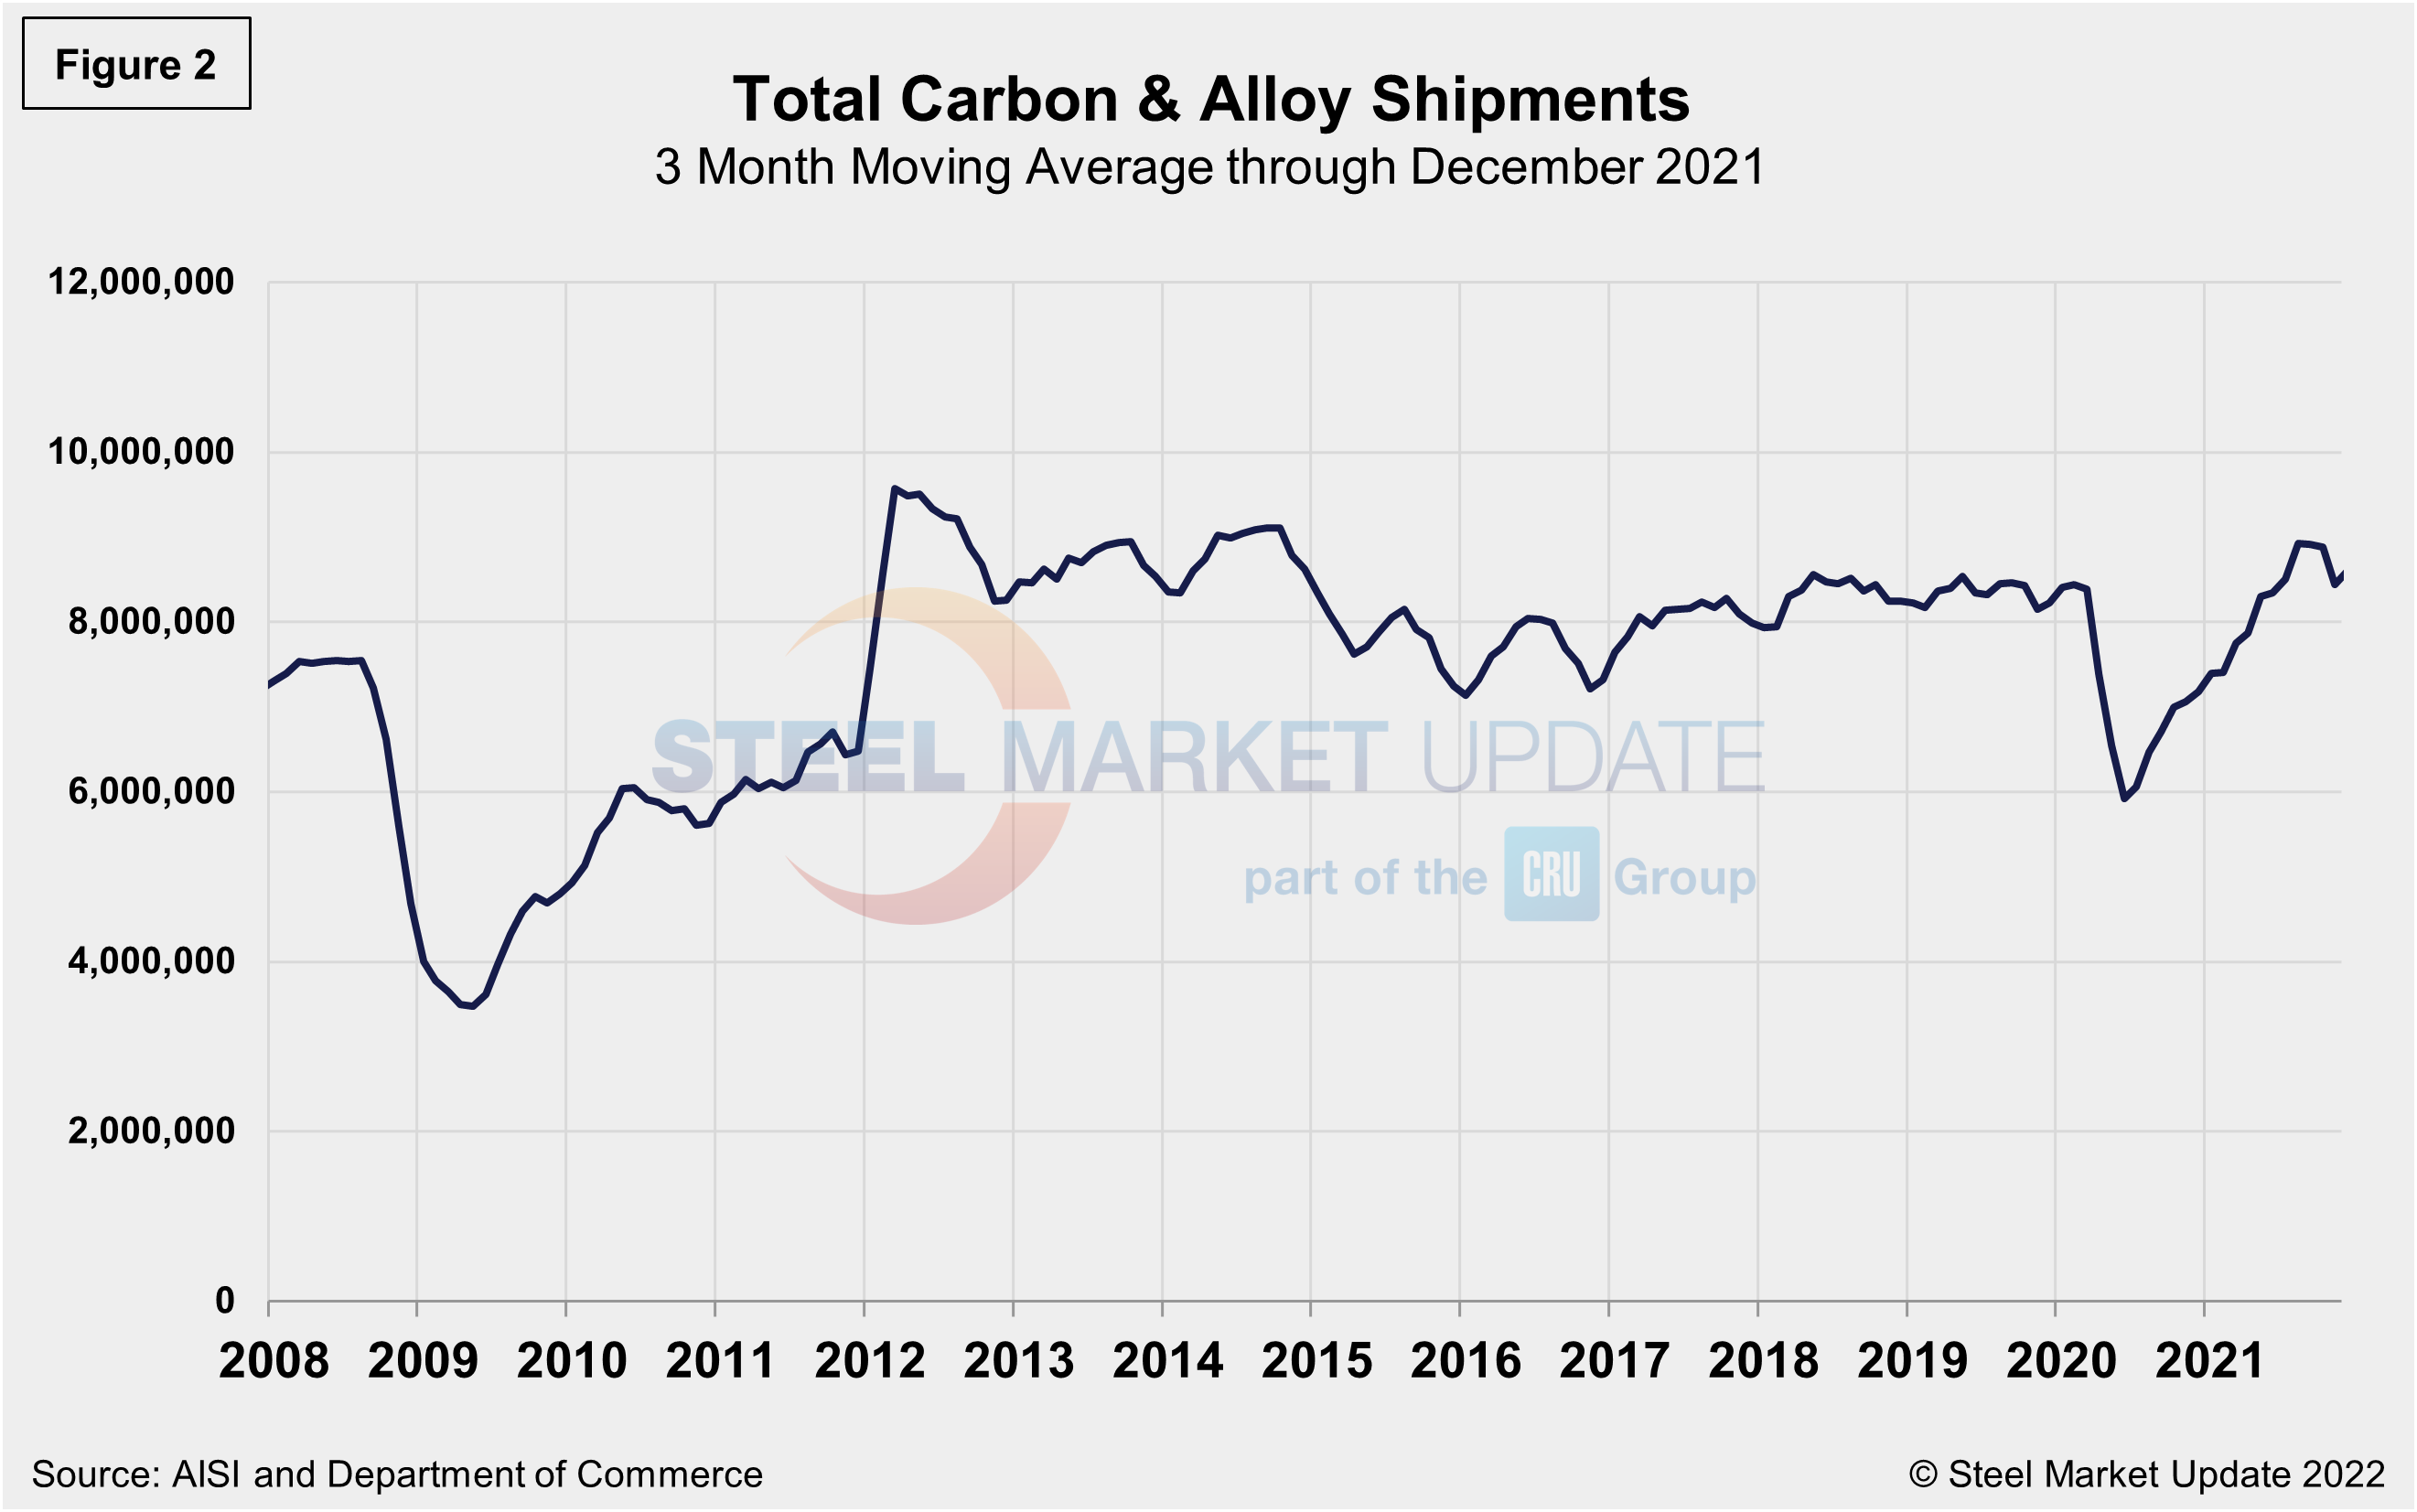
Monthly shipment data for all rolled steel products is noted in Figure 2. The trajectories of the rebounds since Q2 2020 are comparable in Figures 1 and 2. Measured as a three-month moving average (3MMA) of the monthly data, December’s total was 8.604 million tons, up 2.0% compared to 8.434 million tons in November, and the first gain following three straight months of decline. Shipments were up 19.9% in December versus to the year prior when shipments were 7.177 million tons. The recovery from the COVID-related shutdowns has been meaningful. Current shipments are up 4.7% from the same pre-pandemic period in 2019.
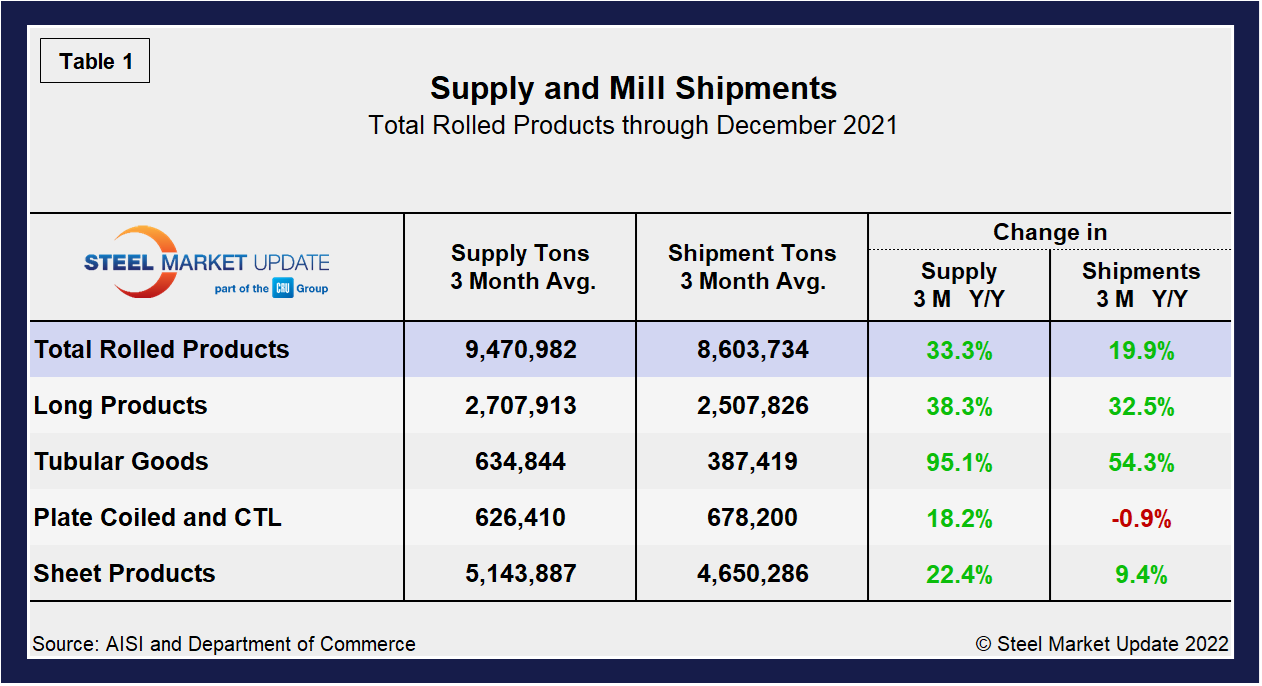
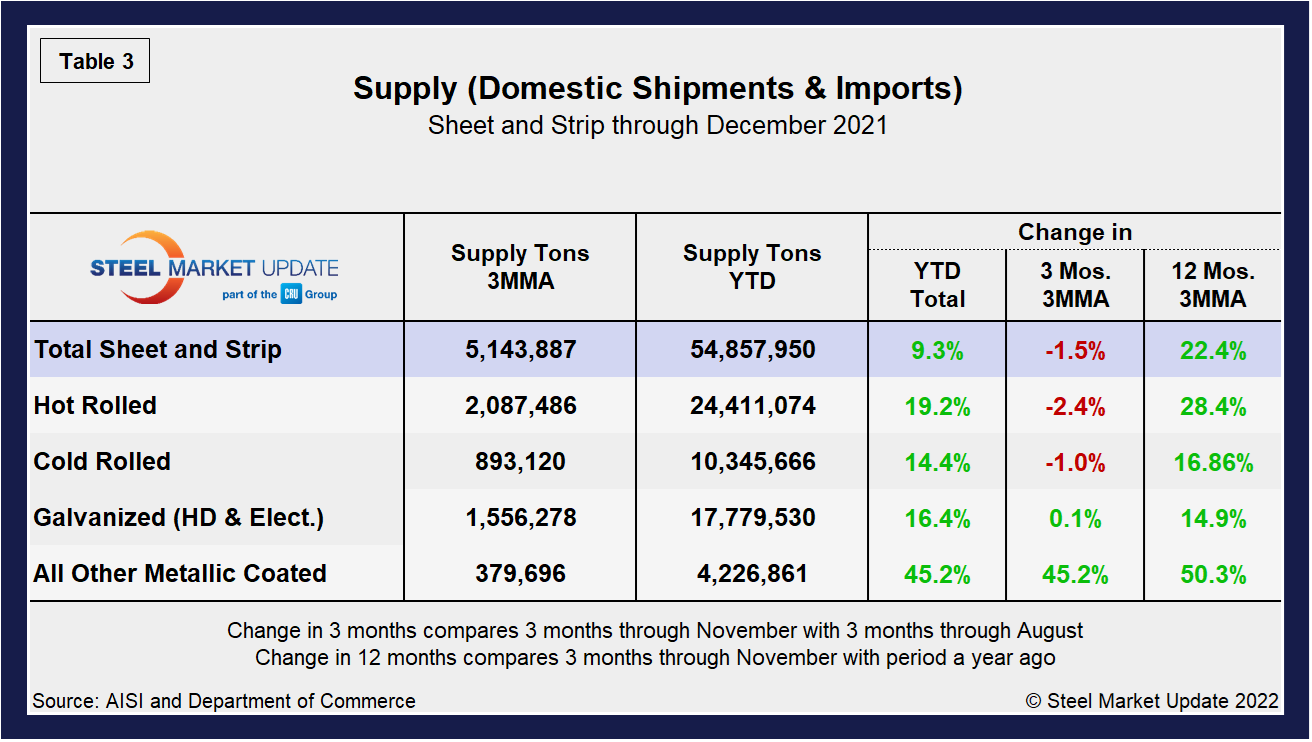
Shipment and supply details for all product groups are noted in Table 1, followed by individual sheet products in Table 2, and domestic supply (shipments and imports) in Table 3. Total supply (proxy for market demand) as a 3MMA was up 33.3% year over year in December, a big turnaround from the 15.4% decline the year prior as the market was working its way out of the early pandemic-driven doldrums. Apparent supply is defined as domestic mill shipments to domestic locations plus imports. Mill shipments were up 19.9% in December, also a complete reversal from a decrease of 12.7% seen during the year-ago period in the same 3MMA comparison. The recovery has varied significantly among various products, but should remain up due to steady domestic output, especially if foreign material continues to make its way onto U.S. shores at the current rate.
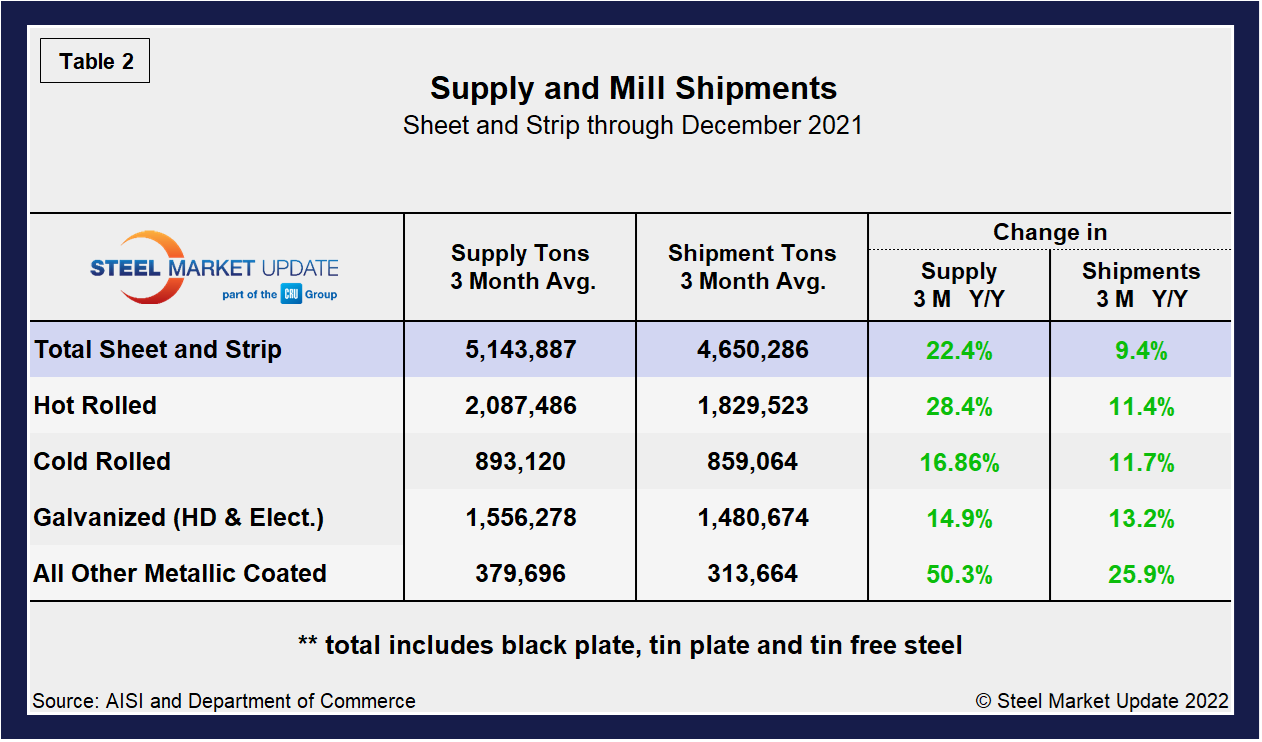
Overall sheet product shipments and supply (Table 2) have continued to increase, however, at a slower pace. Sheet supply rose by 22.4% and shipments by 9.4% in December, a strong recovery from declines of 6.4% and 5.3% seen one year ago. In the three months through December 2021, the average monthly supply of sheet and strip was 5.144 million tons, down from 5.201 million tons or 1.1% below the prior month. Total sheet and strip apparent supply is up 9.3% year to date (Table 3) compared to 2020. Note that year-over-year comparisons have seasonality removed.
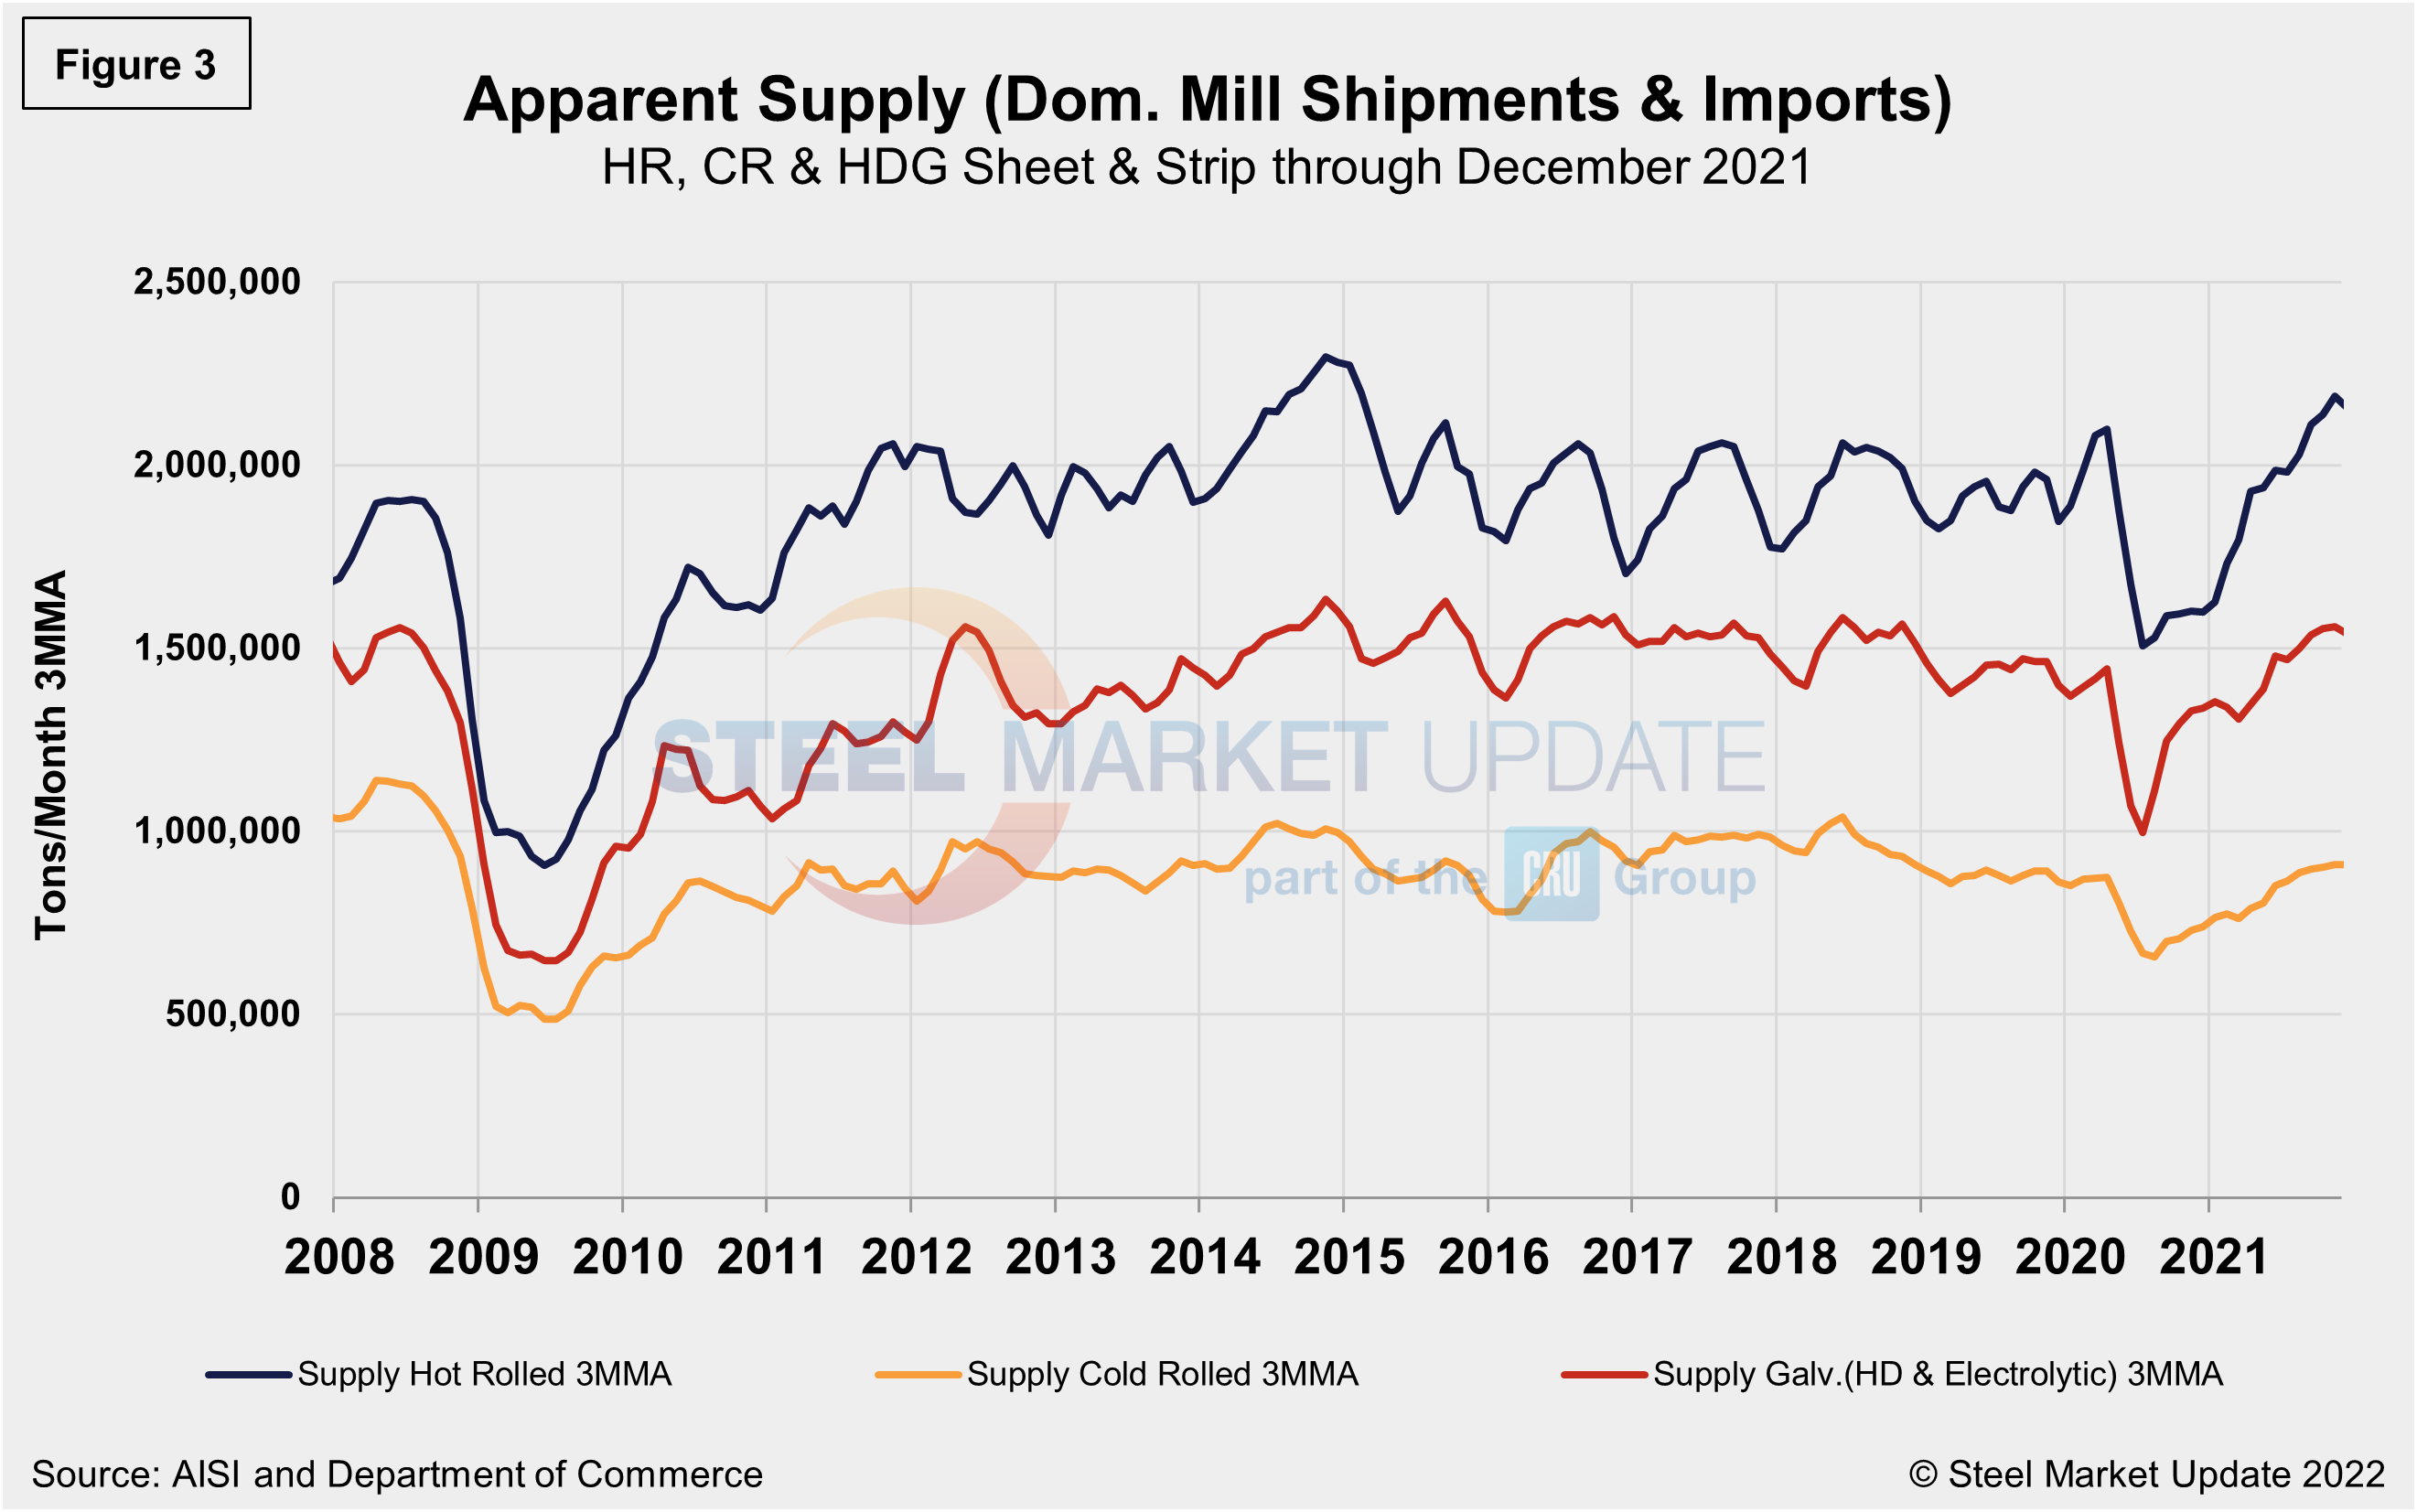
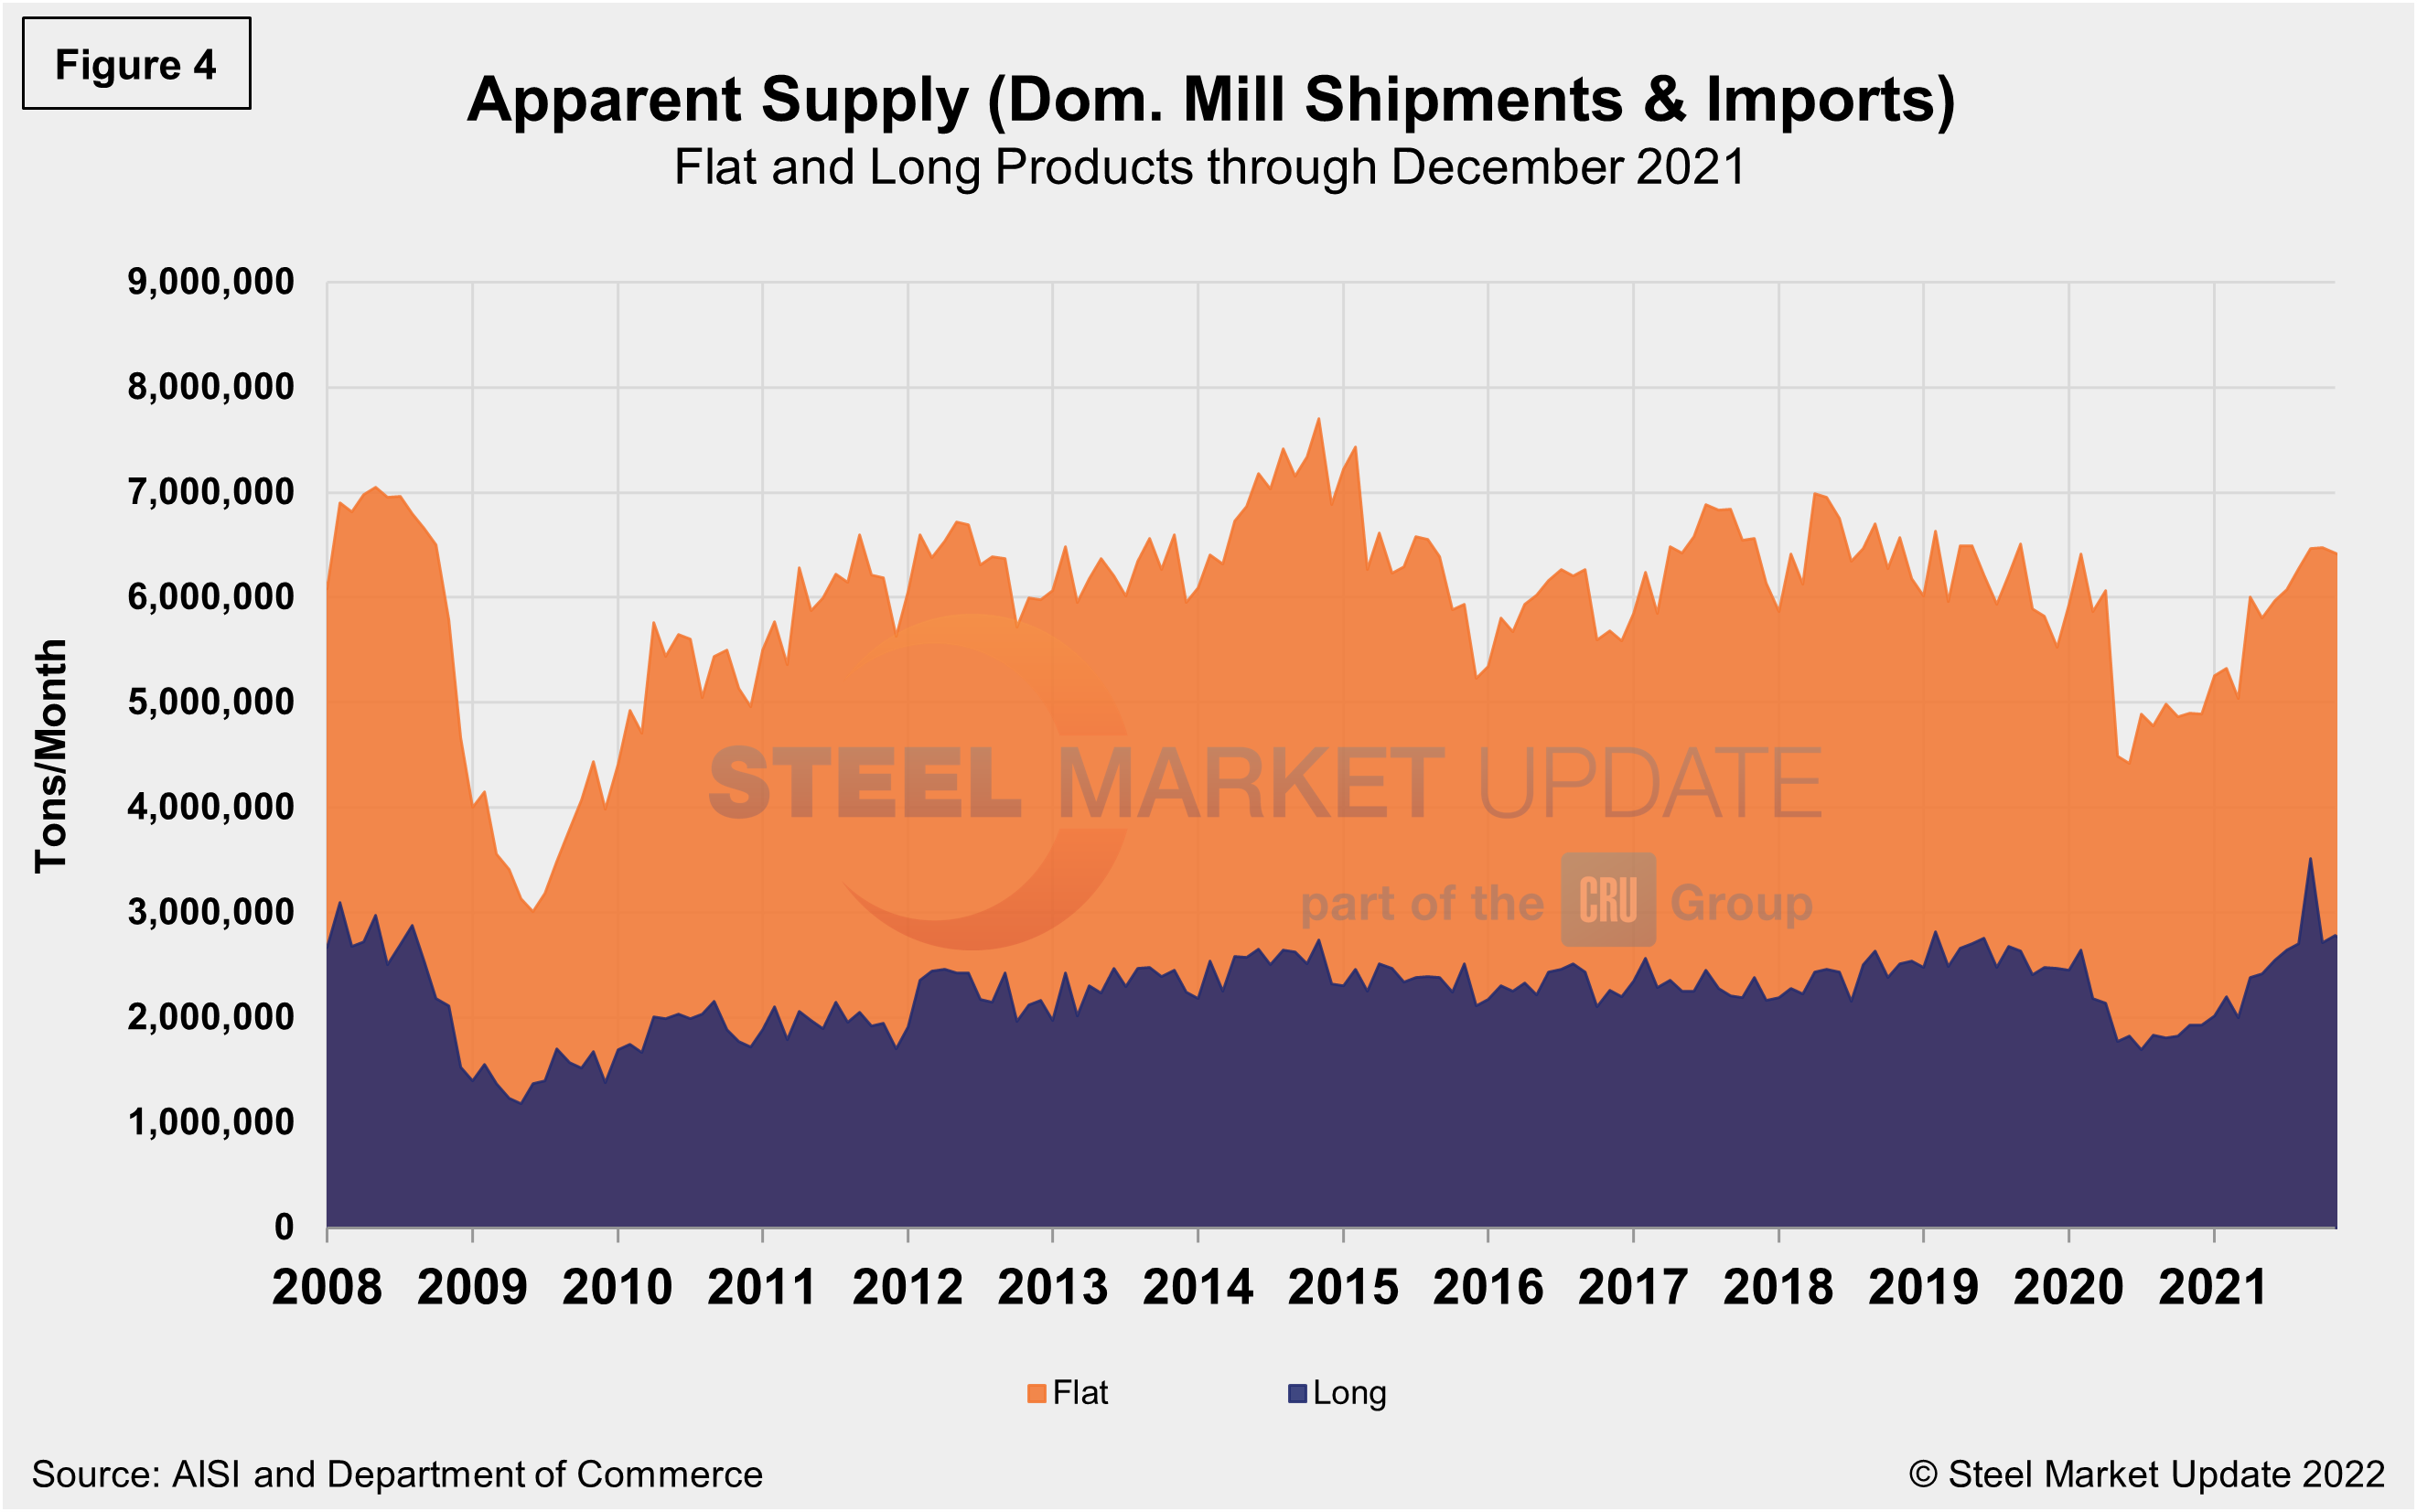
The supply picture for HRC, CRC and HDG since August 2008 as three-month moving averages in Figure 3 and Figure 4 shows the long-term comparison between flat and long products. All three sheet products have experienced some improvement since mid-2020, but galvanized (hot dipped and electrolytic) has seen the strongest rebound, a 56.1% jump since reaching bottom in June 2020, but up just 1.1% month on month in December. When compared to the same pre-pandemic period in 2019, the supplies of all three products are presently higher–galvanized (hot dipped and electrolytic) at a 13.8% increase is the highest, followed by hot rolled coil at 10.6% higher, while cold rolled is 4.8% above the same pre-pandemic period in 2019. In Figure 4, note that these are monthly numbers (not 3MMAs), which show the trend difference between longs and flat products including plate.
By David Schollaert, David@SteelMarketUpdate.com


