

Market Data

February 25, 2022
Global Steel Production Slips in January
Written by David Schollaert
World crude steel production fell in January, unable to maintain the growth seen the month prior. Global output was estimated at 155 million metric tons last month, as steelmakers around the world cut production by 6.7 million metric tons or 2.3% from December, according to World Steel Association (worldsteel) data.
After hitting an all-time high of 174.4 million metric tons last May, world crude steel production has declined in six of the last eight months. The repeated reduction has been driven largely by continued Chinese cutbacks, and January was no exception. Chinese steel output was down 5.2% or 4.5 million metric tons last month versus December, yet production in the rest of the world was up a marginal 1.1% or 800,000 metric tons during the same period.
January’s global total was down 4.8% or 7.9 million metric tons when compared to January 2021, and was off by 19.4 million metric tons from the all-time mark set in May 2021. Despite the notable decline, last month’s total was still 2.4% or 3.7 million metric tons better than the same pre-pandemic period in January 2020.
The U.S. remained the fourth-largest crude steel producer in the world in January, accounting for 7.3 million metric tons or 4.7% of the global total. U.S. production last month was up 1.4% or 100,000 metric tons versus December’s total.
Compared with the same month last year when the U.S. economy was still working its way out of the initial COVID-19 closures, January’s production was an improvement of 5.8%, but still down 4.7% compared to the pre-pandemic period in 2020.
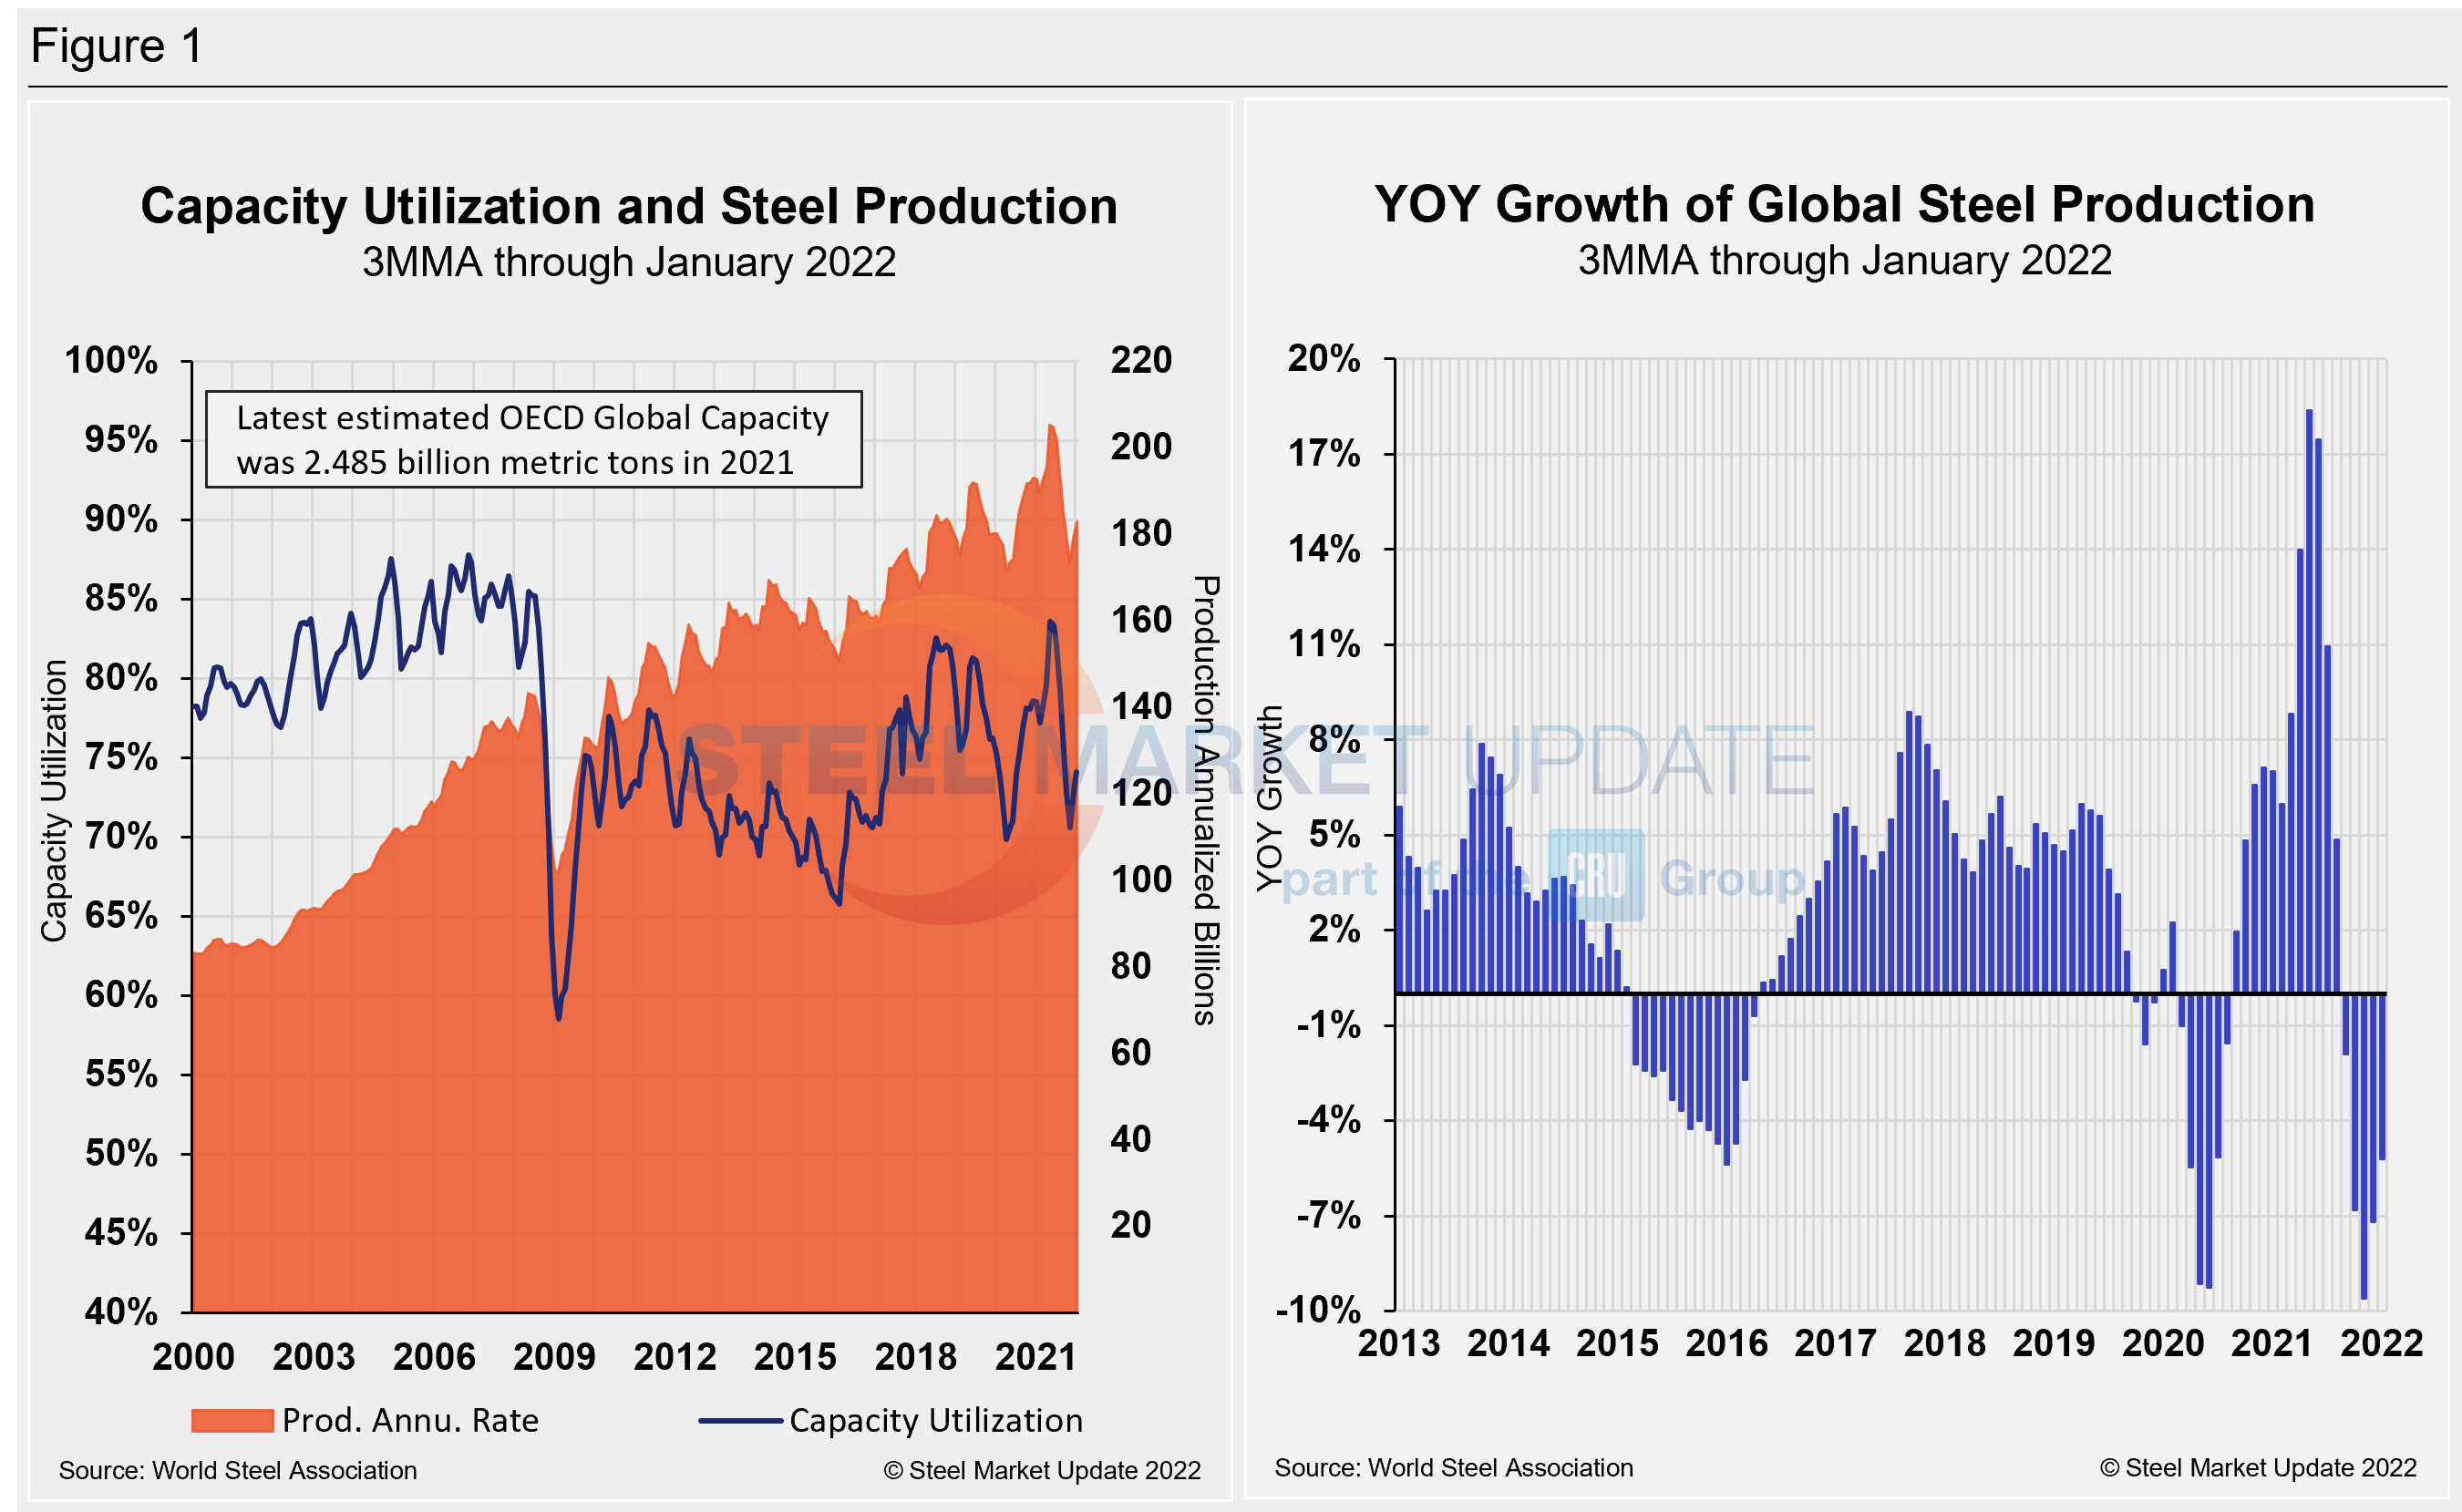
Shown below in Figure 1 is the annualized monthly global steel production on a three-month moving average (3MMA) basis and capacity utilization since January 2000, as well as the year-over-year growth rate of global production on the same 3MMA basis since January 2013, based on data from worldsteel. Mill capacity utilization in January on a 3MMA basis was 74.1%, up 1.2 percentage points from the month prior. On a tons-per-day basis, production in January was 5.0 million metric tons, a 2.3% decrease month on month, and 813,000 tons off May’s record rate of 5.813 million metric tons. Growth on a three-month moving average basis through January year-over-year was down by -5.2%, an improvement from -7.2% the month prior, but a collapse from the 18.4% expansion seen in May.
Displayed in the table below is global production broken down into regions, the production of the top 10 nations in the single month of January, and their share of the global total. It also shows the latest three months and 12 months of production through last month with year-over-year growth rates for each period. Regions are shown in black font and individual nations in gray.
World steel production overall fell 4.7% in three months, a significant deceleration from the 17.9% growth just seven months prior. Over 12 months through January, though, growth was 3.4%, down 1.0 percentage point from the same period in December. The market has not maintained positive momentum, as the three-month growth rate has been lower than the 12-month growth rate for six straight months now.
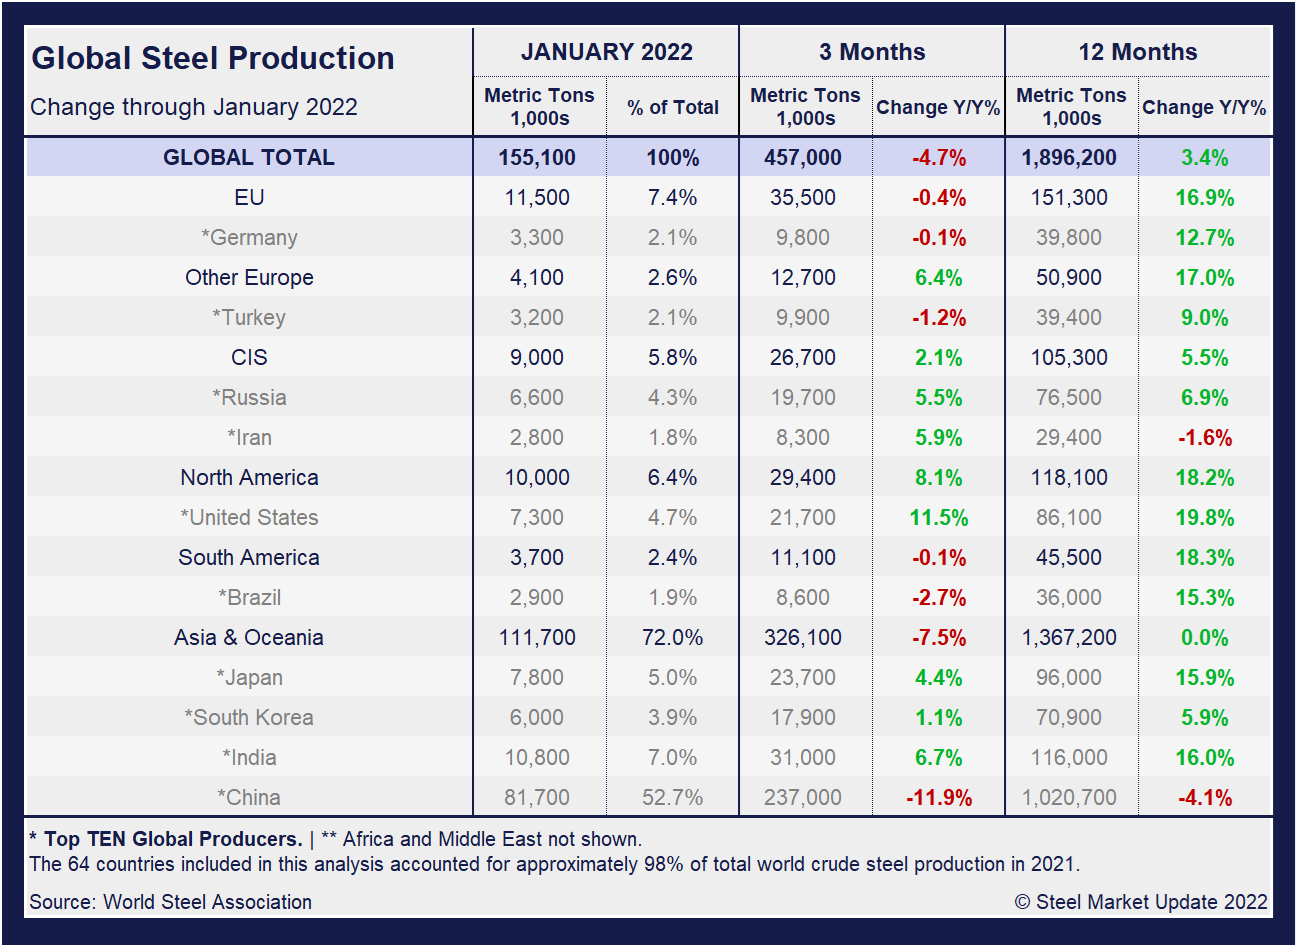
The table shows that North American production was up 8.1% in the three months through January and up 18.2% year on year. The positive momentum in the North American market remains a highlight, as the economy continues to battle through new waves of the pandemic. Yet, when compared to the same pre-pandemic period in 2020, present output is down 0.6% at the start of the year.
China’s Crude Steel Production
China’s monthly steel production was estimated at 81.7 million metric tons in January, down from 86.2 million metric tons the month prior. The 4.5-million-ton monthly decrease was a vast turn from the 16.9-million-ton surge seen in December. Chinese production has only seen a single month of steel production growth since crude steel output reached its all-time high of 99.5 million metric tons in May.
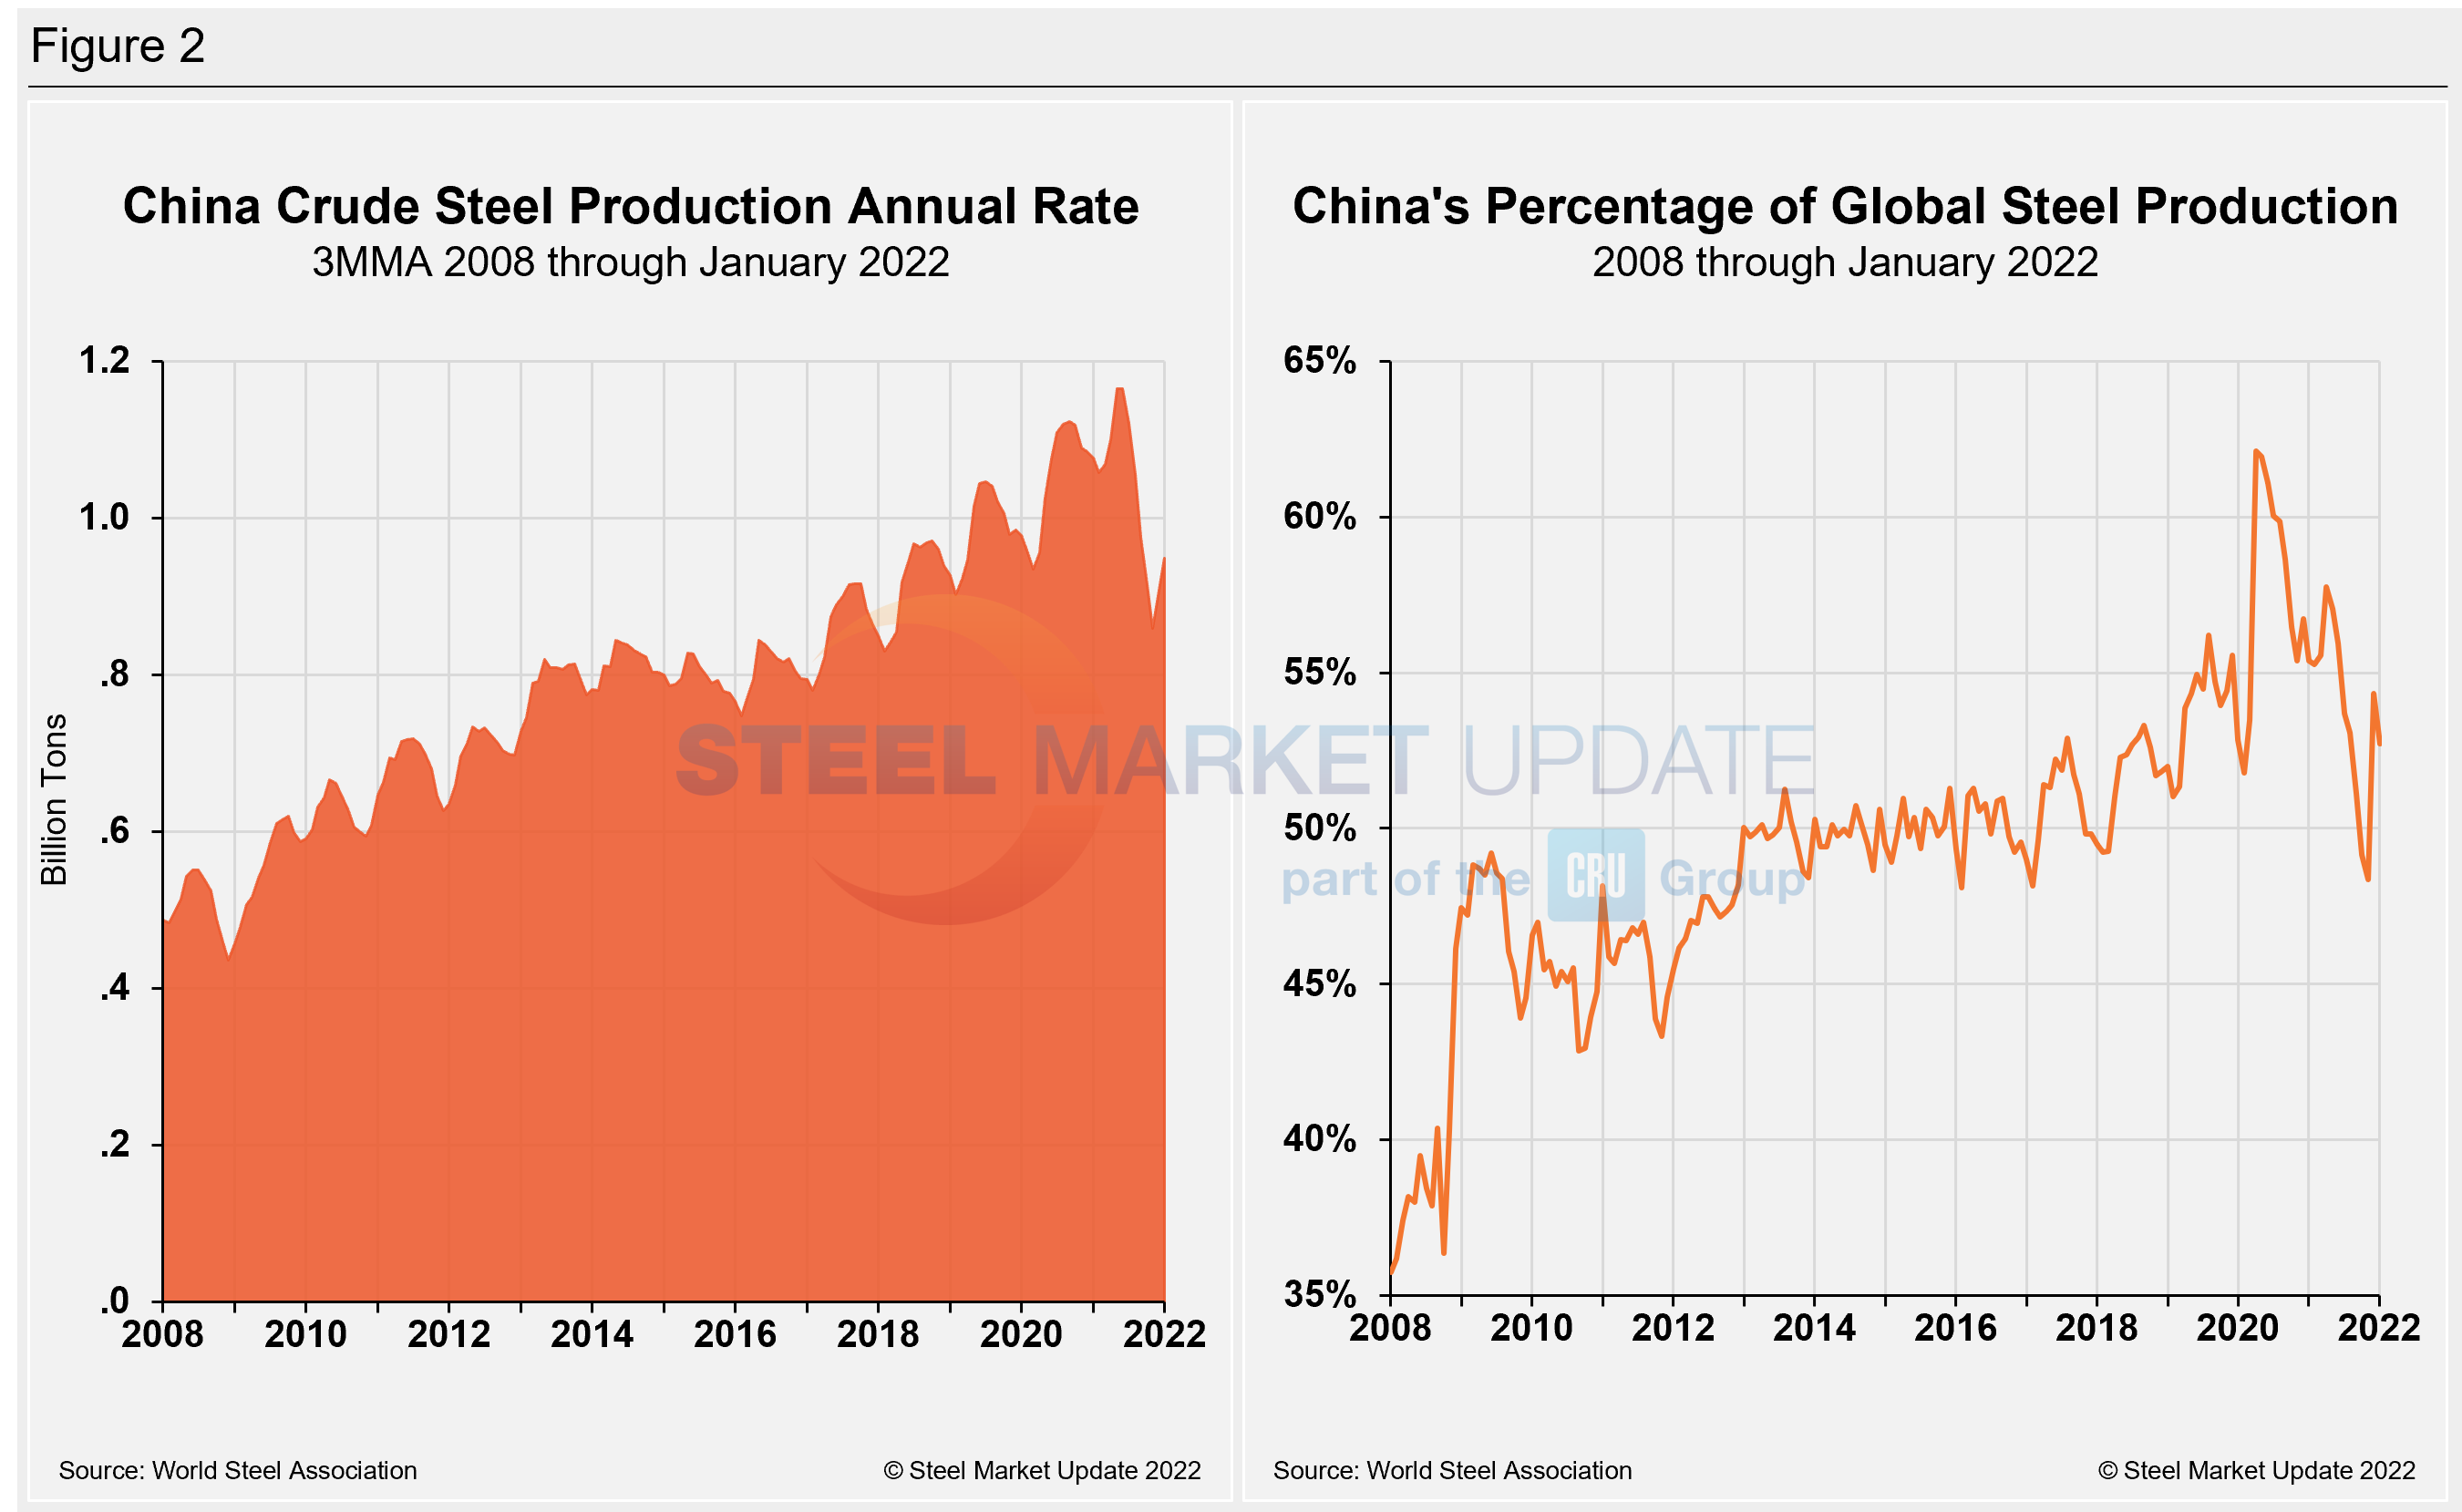
On a 3MMA basis, the annual rate of China’s crude steel production had maxed out at 1.123 billion metric tons in September 2020, before falling repeatedly by February of last year. The rebound in March marked the beginning of a run-up that pushed output to a new high of 1.166 billon metric tons in May. January’s total was 948.4 million metric tons, up from 908.4 million metric tons in December. China’s annual capacity is presently 1.128 billion metric tons, and its annual capacity utilization slipped to 90.5% last month, its lowest mark in 17 months and down from its all-time high of 98.4% in June.
At 52.7%, China produced more than half of the world’s steel, an estimated 81.7 million metric tons in January. The total last month was a 4.5-million-metric-ton or 5.2% cut from December, and a 9.4% or 8.5-million-metric-ton fall when compared with the same year-ago period. Chinese production last month was up 2.2% above pre-pandemic levels from 2020.
China’s crude steel production annual rate and percentage of global output is displayed side-by-side in Figure 2.
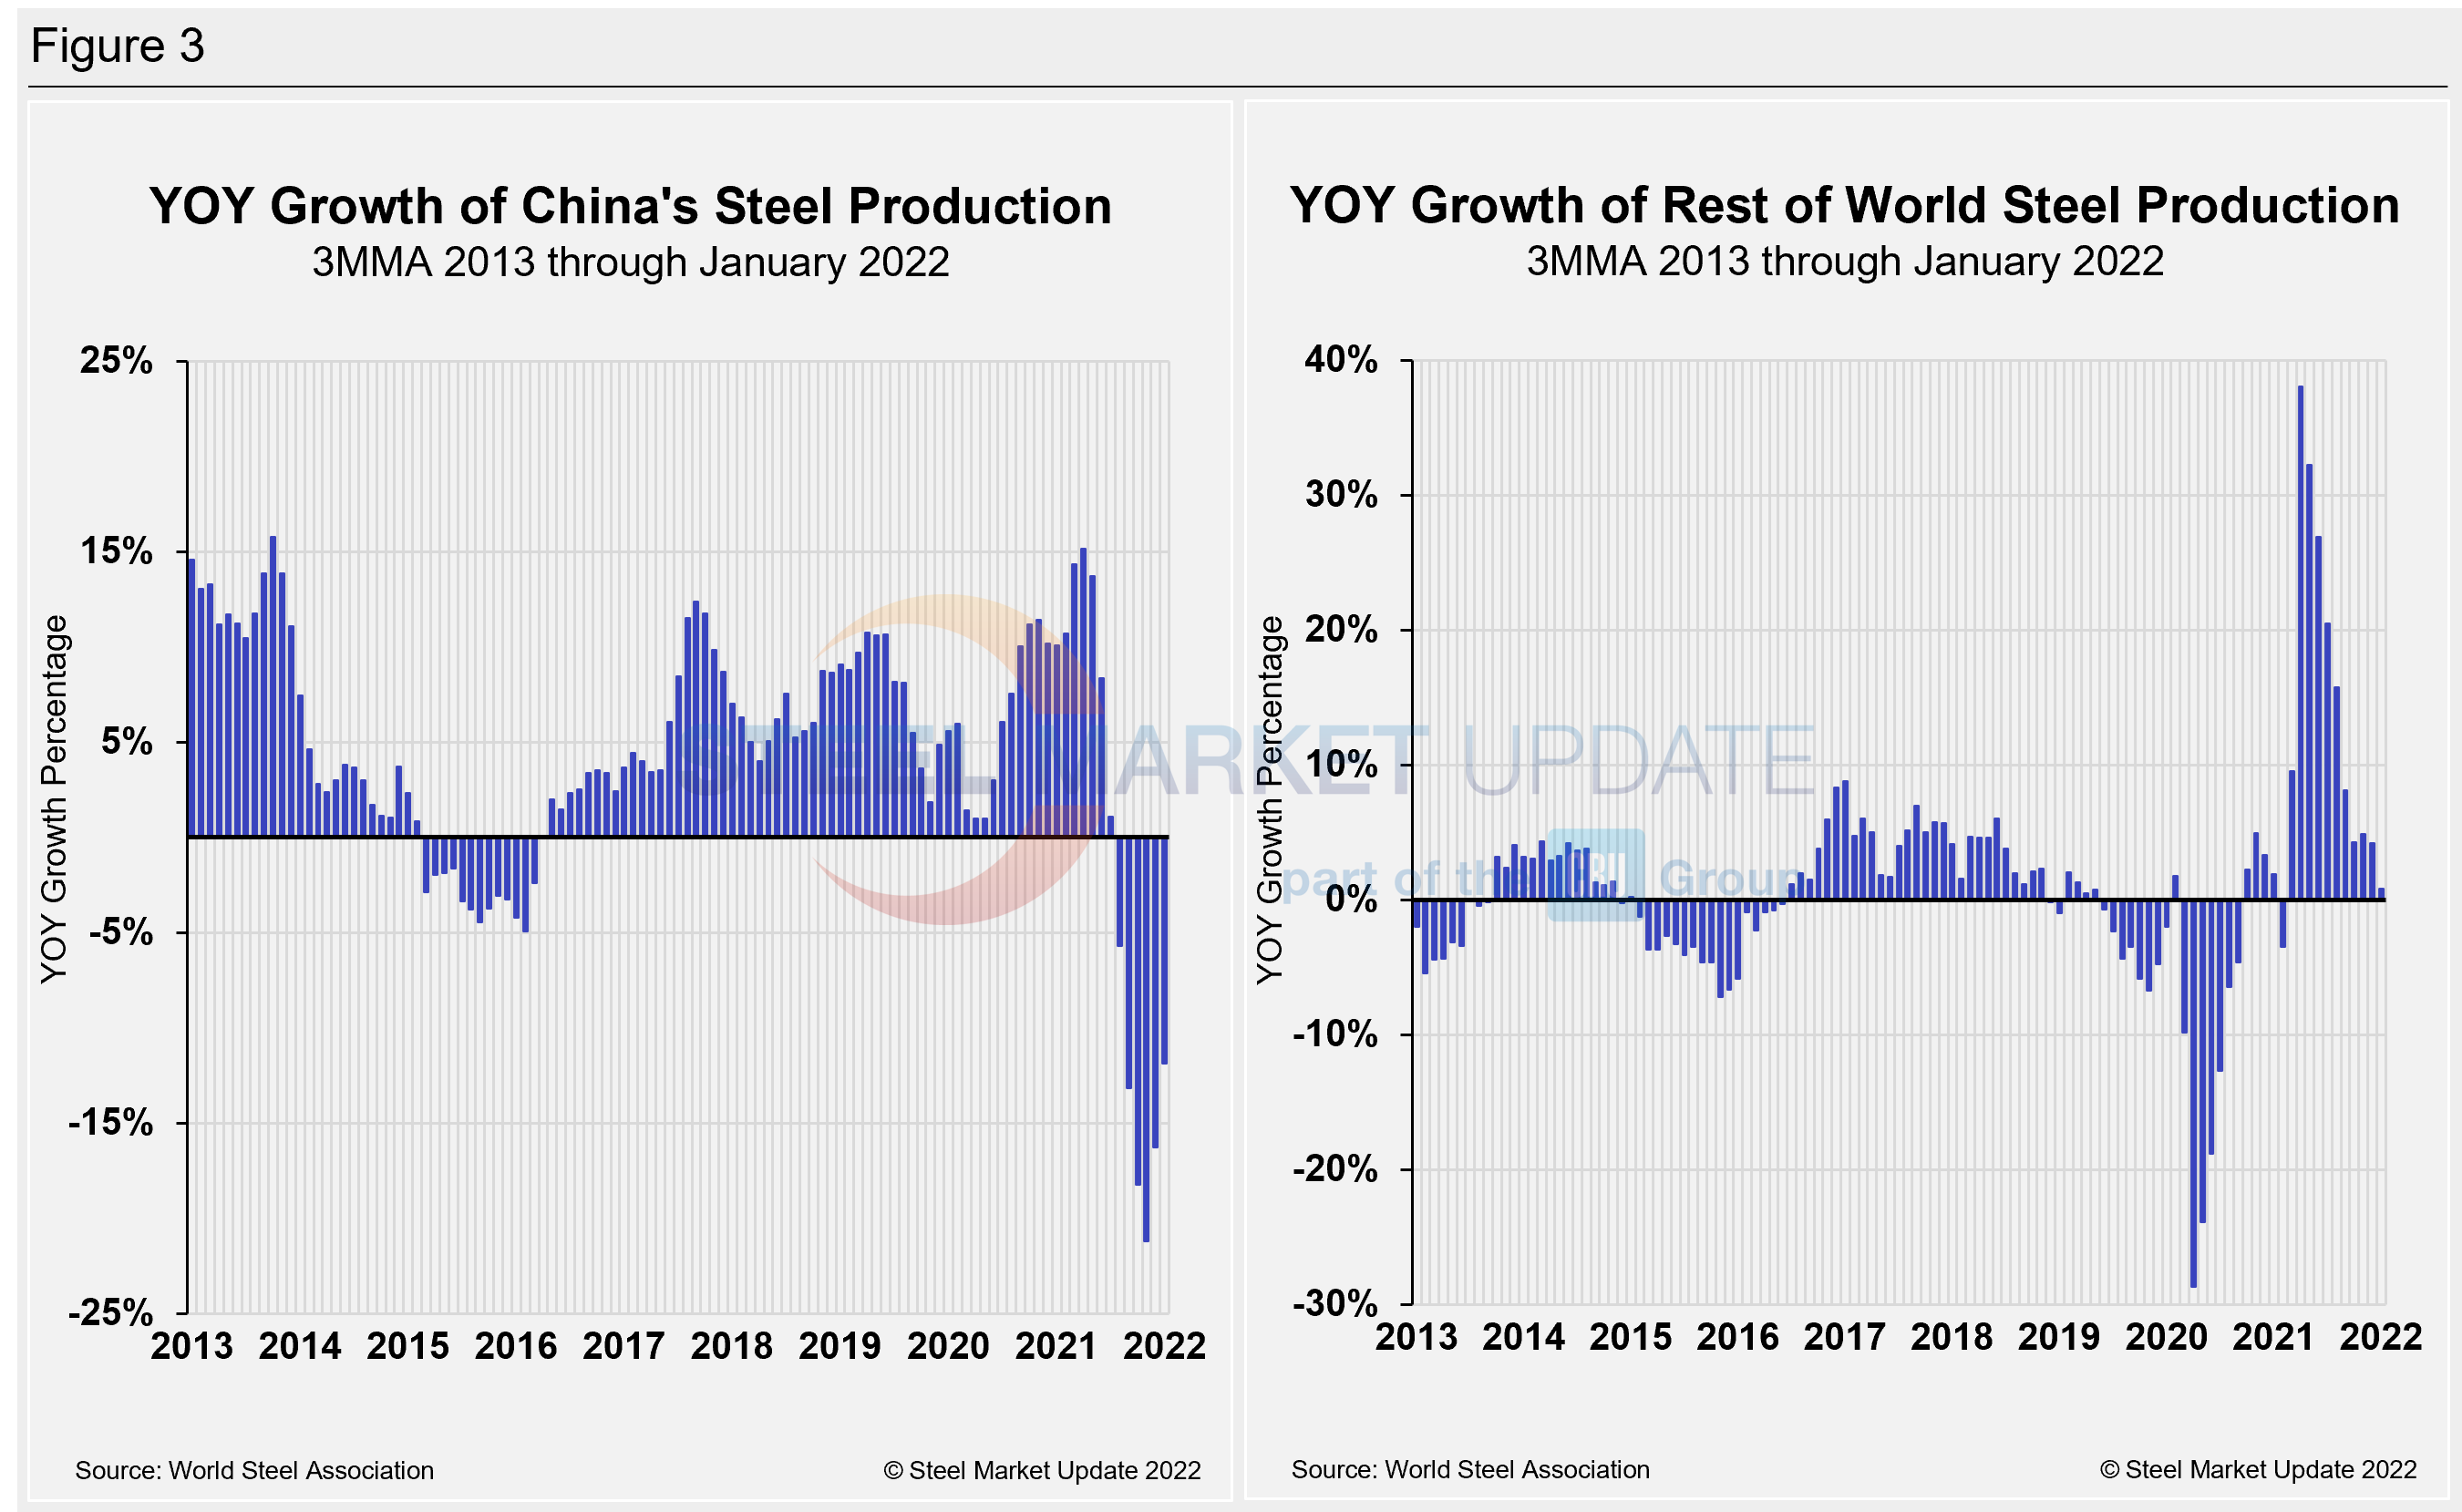
The fluctuations in China’s steel production since January 2013 versus the growth of global steel excluding China, both on a 3MMA basis, are shown side-by-side in Figure 3. From October 2020 through December 2021, the rest of the world’s production rose sharply, reaching a peak of 38.0% in April. Since then, the rate for the rest of the world’s annual production has decreased sequentially to just 0.8% in January, a 3.4 percentage point drop versus the month prior. China’s annual growth rate was -11.9% in January, an improvement from -16.2% in December. Though annual growth has recovered by 9.3 percentage points over the past two months, it remains well behind the +15.1% seen last April. The month-on-month production decline in Chinese steel production remains in line with expectations, as the Asian giant seeks to curb harmful air emissions and limit energy consumption. February’s production should result in additional cuts due to the Lunar New Year celebration and Winter Olympics.
By David Schollaert, David@SteelMarketUpdate.com


