

Market Data

March 25, 2022
Producer Prices Keep Rising in February
Written by David Schollaert
Producer prices rose moderately in February, maintaining a sustained 23-month growth run. Last month the headline index grew by just 0.8%, seasonally adjusted, but was a gain of 10% when compared to the same year-ago period, reports the U.S. Labor Department.
Wholesale prices accelerated as steady consumer demand and pandemic-related supply-chain snarls continued to fuel the highest inflation in decades. The move keeps the Federal Reserve on track to raise interest rates.
Core PPI inflation at the wholesale level, which excludes the more volatile measurements of food and energy, increased 0.2% for the month, following a 0.8% increase in January. Over the past 12 months, core prices were up 6.6%.
Gasoline prices, which soared 14.8% in the month, accounted for nearly 40% of the February increase. Overall, prices for goods jumped 2.4% last month, while prices for services remained the same.
The PPI data, which covers more than 10,000 goods and services, is helpful in comparing the direction of price changes in the short and medium-term. In specific, this analysis is intended to provide subscribers with a view of the relative competitive positions of sheet steel, aluminum, plastic and wood. It also includes some downstream products and a comparison of truck and rail transportation.
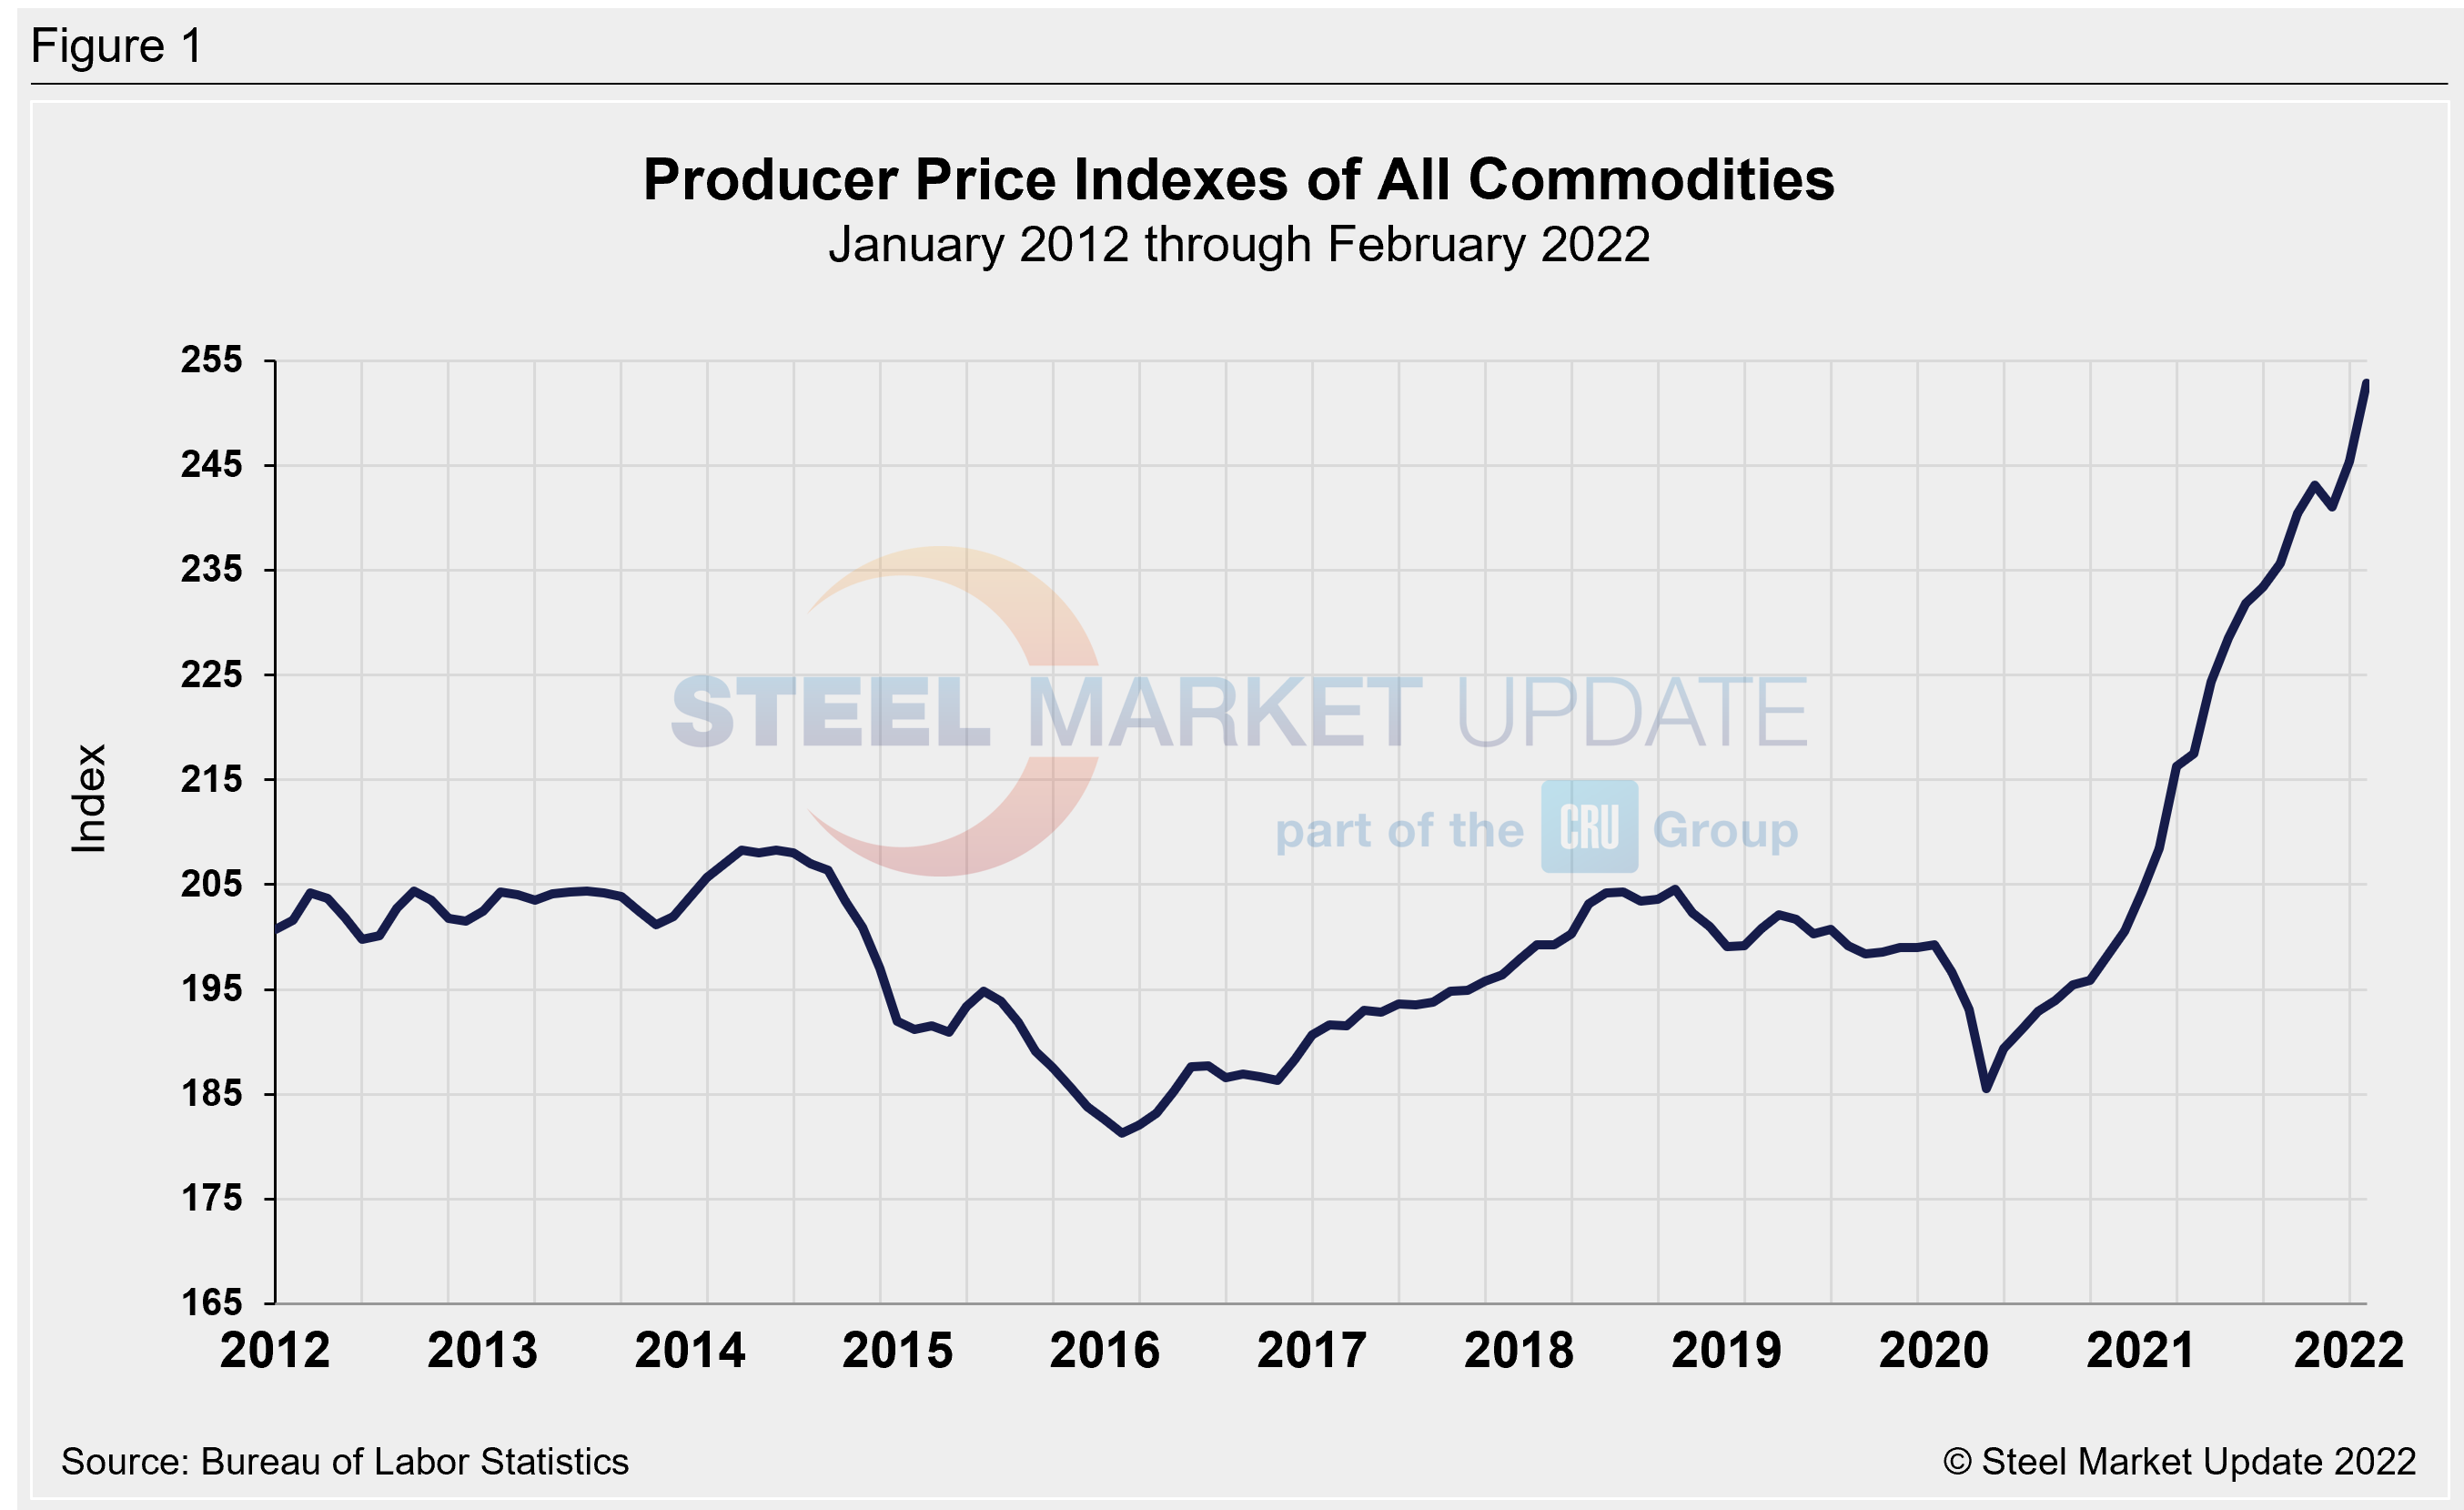
The composite PPI for all commodities (Figure 1) weakened at the onset of the pandemic nearly two years ago, tumbling by more than 4.0%. The recovery has been significant for the U.S. economy – currently just shy of a two-year run – and the steel industry.
As has been the case through much of the coronavirus era, goods prices outweighed those for services, rising 2.4% and 0.7%, respectively. Final demand energy prices surged 8.2% in February, while food climbed 1.9%. The PPI was at 252.8 in February, up from 244.3 in January, and up from 208.5 one year ago.
SMU’s benchmark hot-rolled coil price range stood at $1,350-$1,450 per net ton ($67.50-$72.50/cwt) with an average of $1,400 per ton ($70.00/cwt) FOB mill, east of the Rockies as of March 22. HRC prices have rebounded by more than $300 per net ton since SMU’s PPI report last month. PPI prices have seen a strong recovery, mirroring the rise in inflation for most goods.
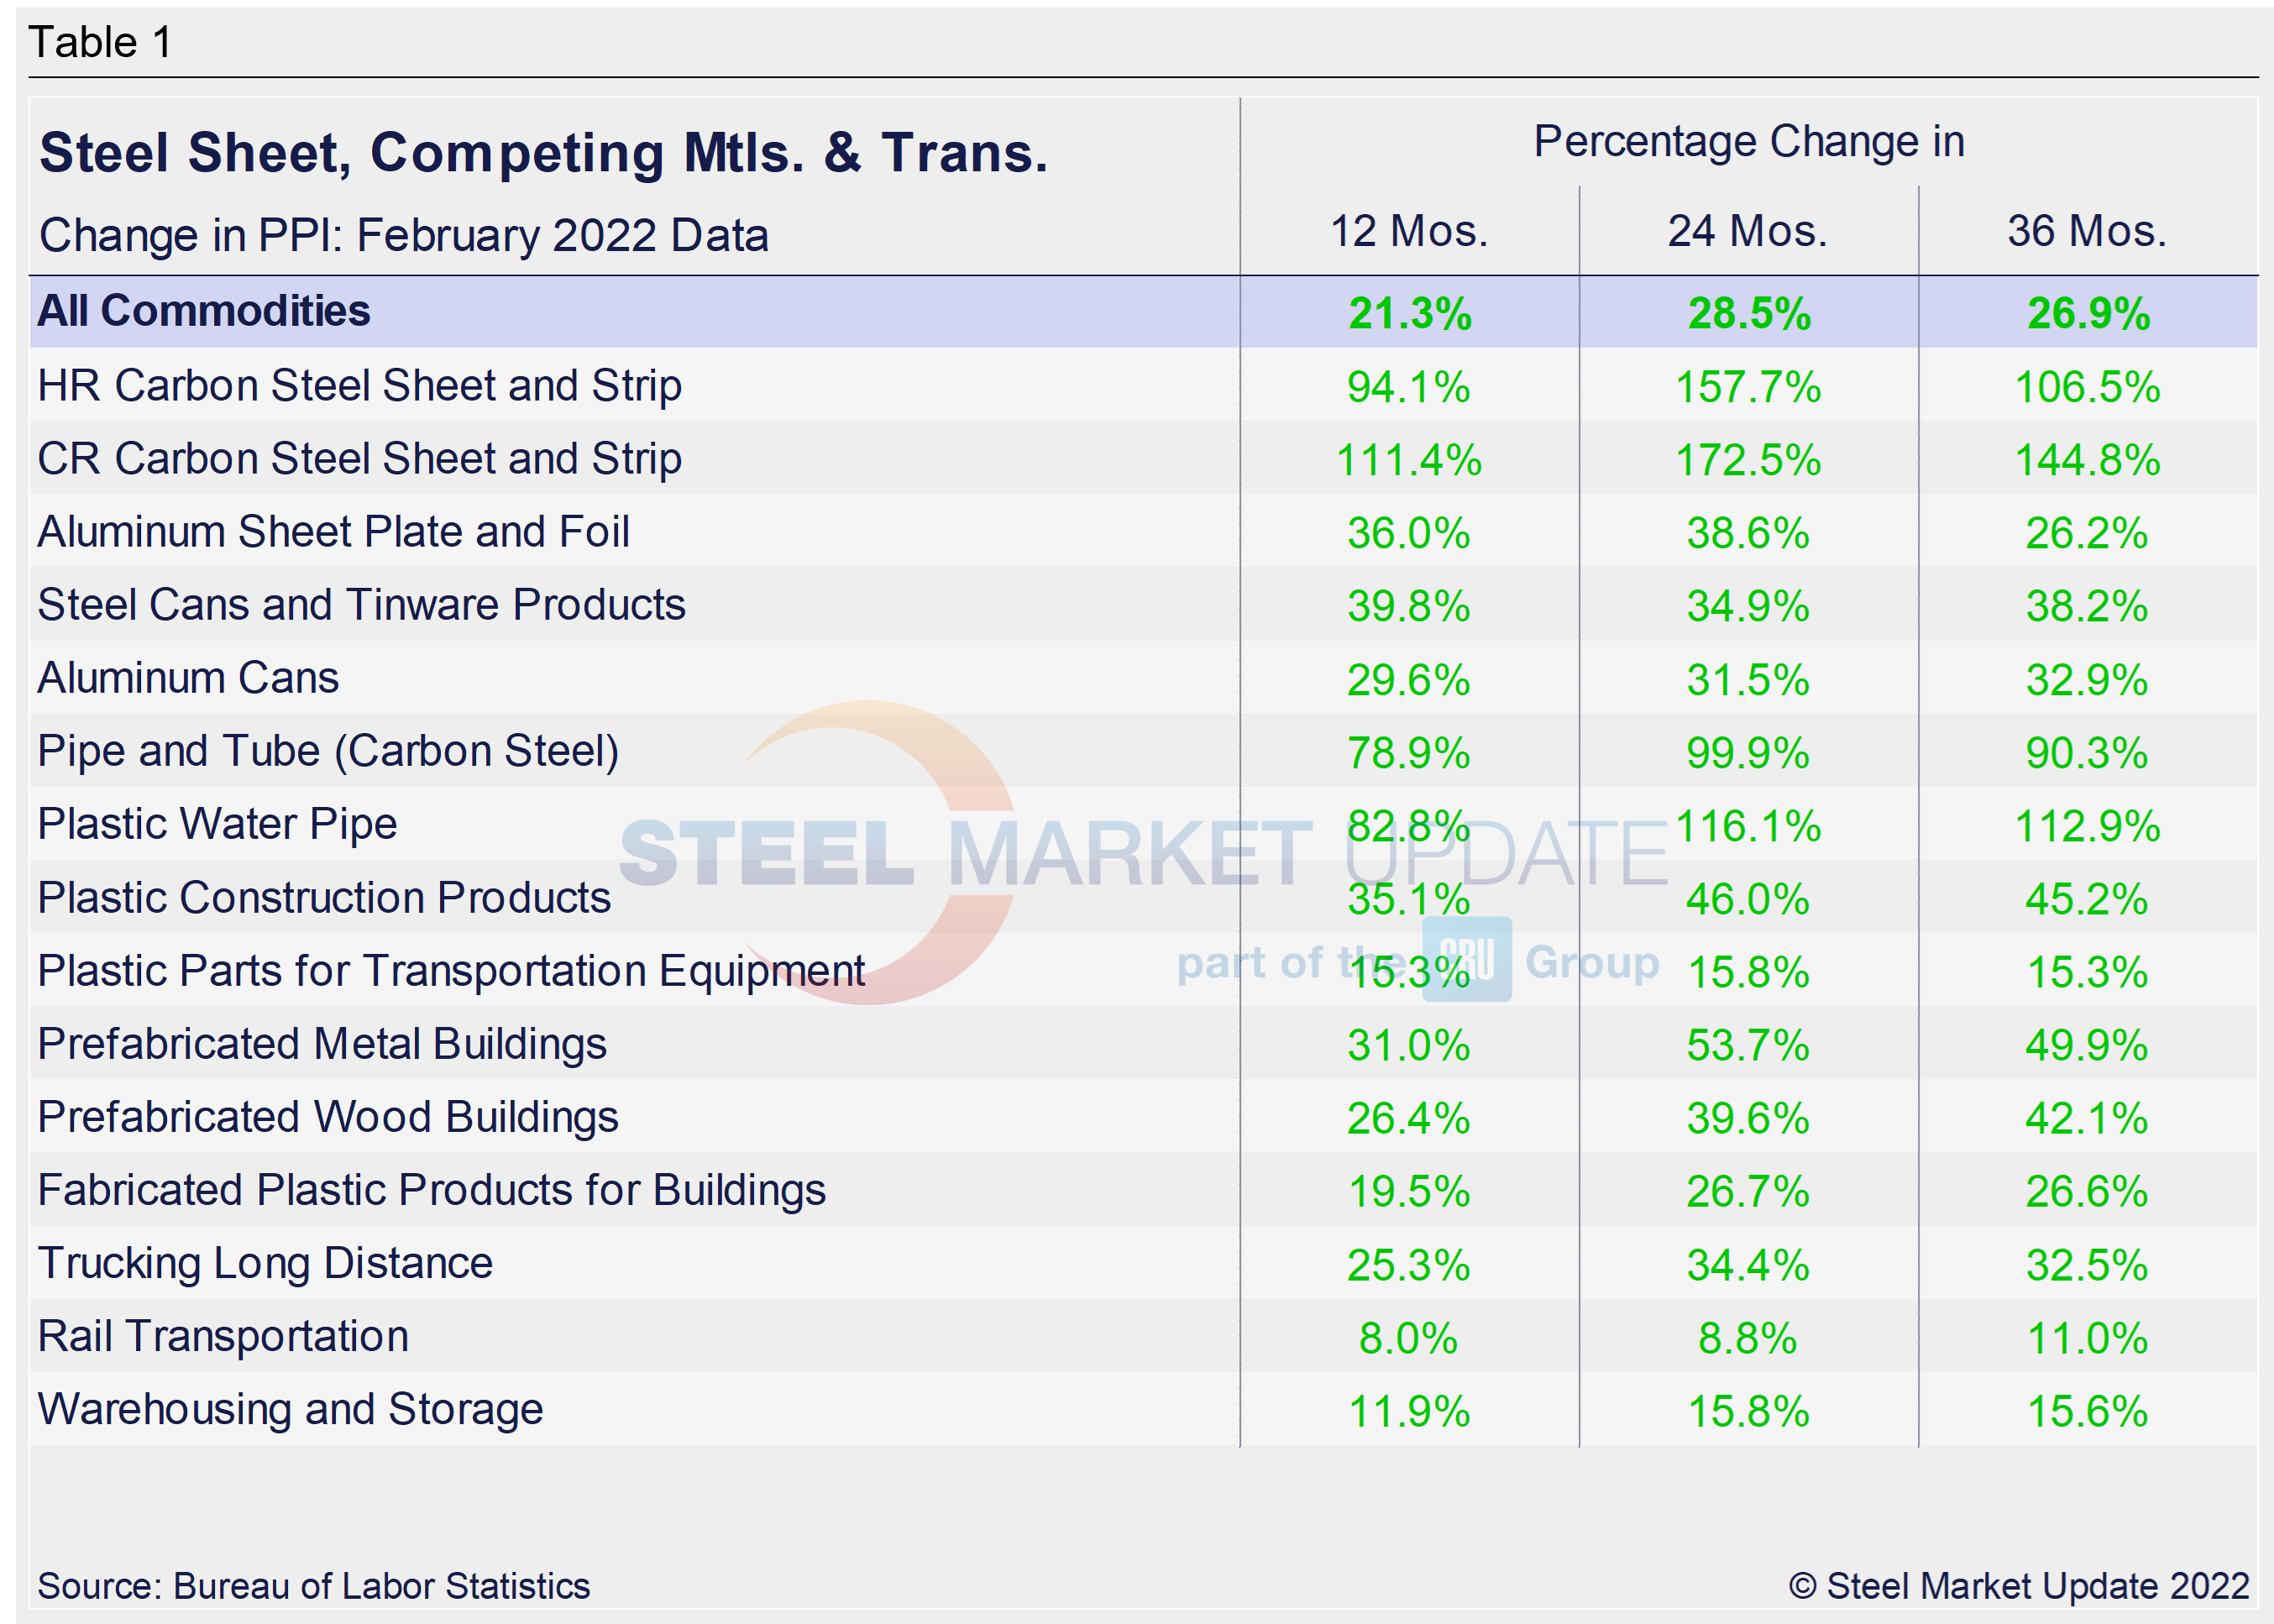
A summary of each segment on a year over one-, two- and three-year basis is shown in the table below. The gain/loss pattern is shown by the color codes; rising prices are considered positive. The positive swing on a 12- and 24-month basis is no wonder, given the marketplace has seen such a strong recovery from the initial COVID-driven collapse. The growth at 36 months, however, is significant. The clear surge not only reinforces this historic recovery but also the inflation rise that has taken hold. Through February, all 16 sectors were on the rise at the 12-month level, with HR and CR carbon steel sheet and strip showing huge increases of 94.1% and 111.4%.
Last month’s gains are well off from the percentage changes for HR and CR carbon steel sheet and strip that maxed out at 242.0% and 247.0%, respectively, last November. The shift supports the downtrend seen in steel prices in the six months prior to Russia’s invasion of Ukraine on Feb. 24. Despite that, the 36-month increases are of even greater significance, as they include pre-pandemic periods and highlight the extent of the historic price run seen last year.
The table includes direct comparisons where possible between steel and competing products, while also including plastic products, transportation, warehousing, and storage to further spotlight current market conditions. Construction-related products are up anywhere from 19.5% to 82.8% at the 12-month level, with similar increases for the 24- and 36-month periods as well. Despite growing concerns surrounding the impact of inflation on the marketplace, it has been resilient, surpassing every speculated high. The steady slowdown in the rate of rise has now shifted down for some products. Yet, supply-chain bottlenecks may keep PPI indices rising or firm for the time being.
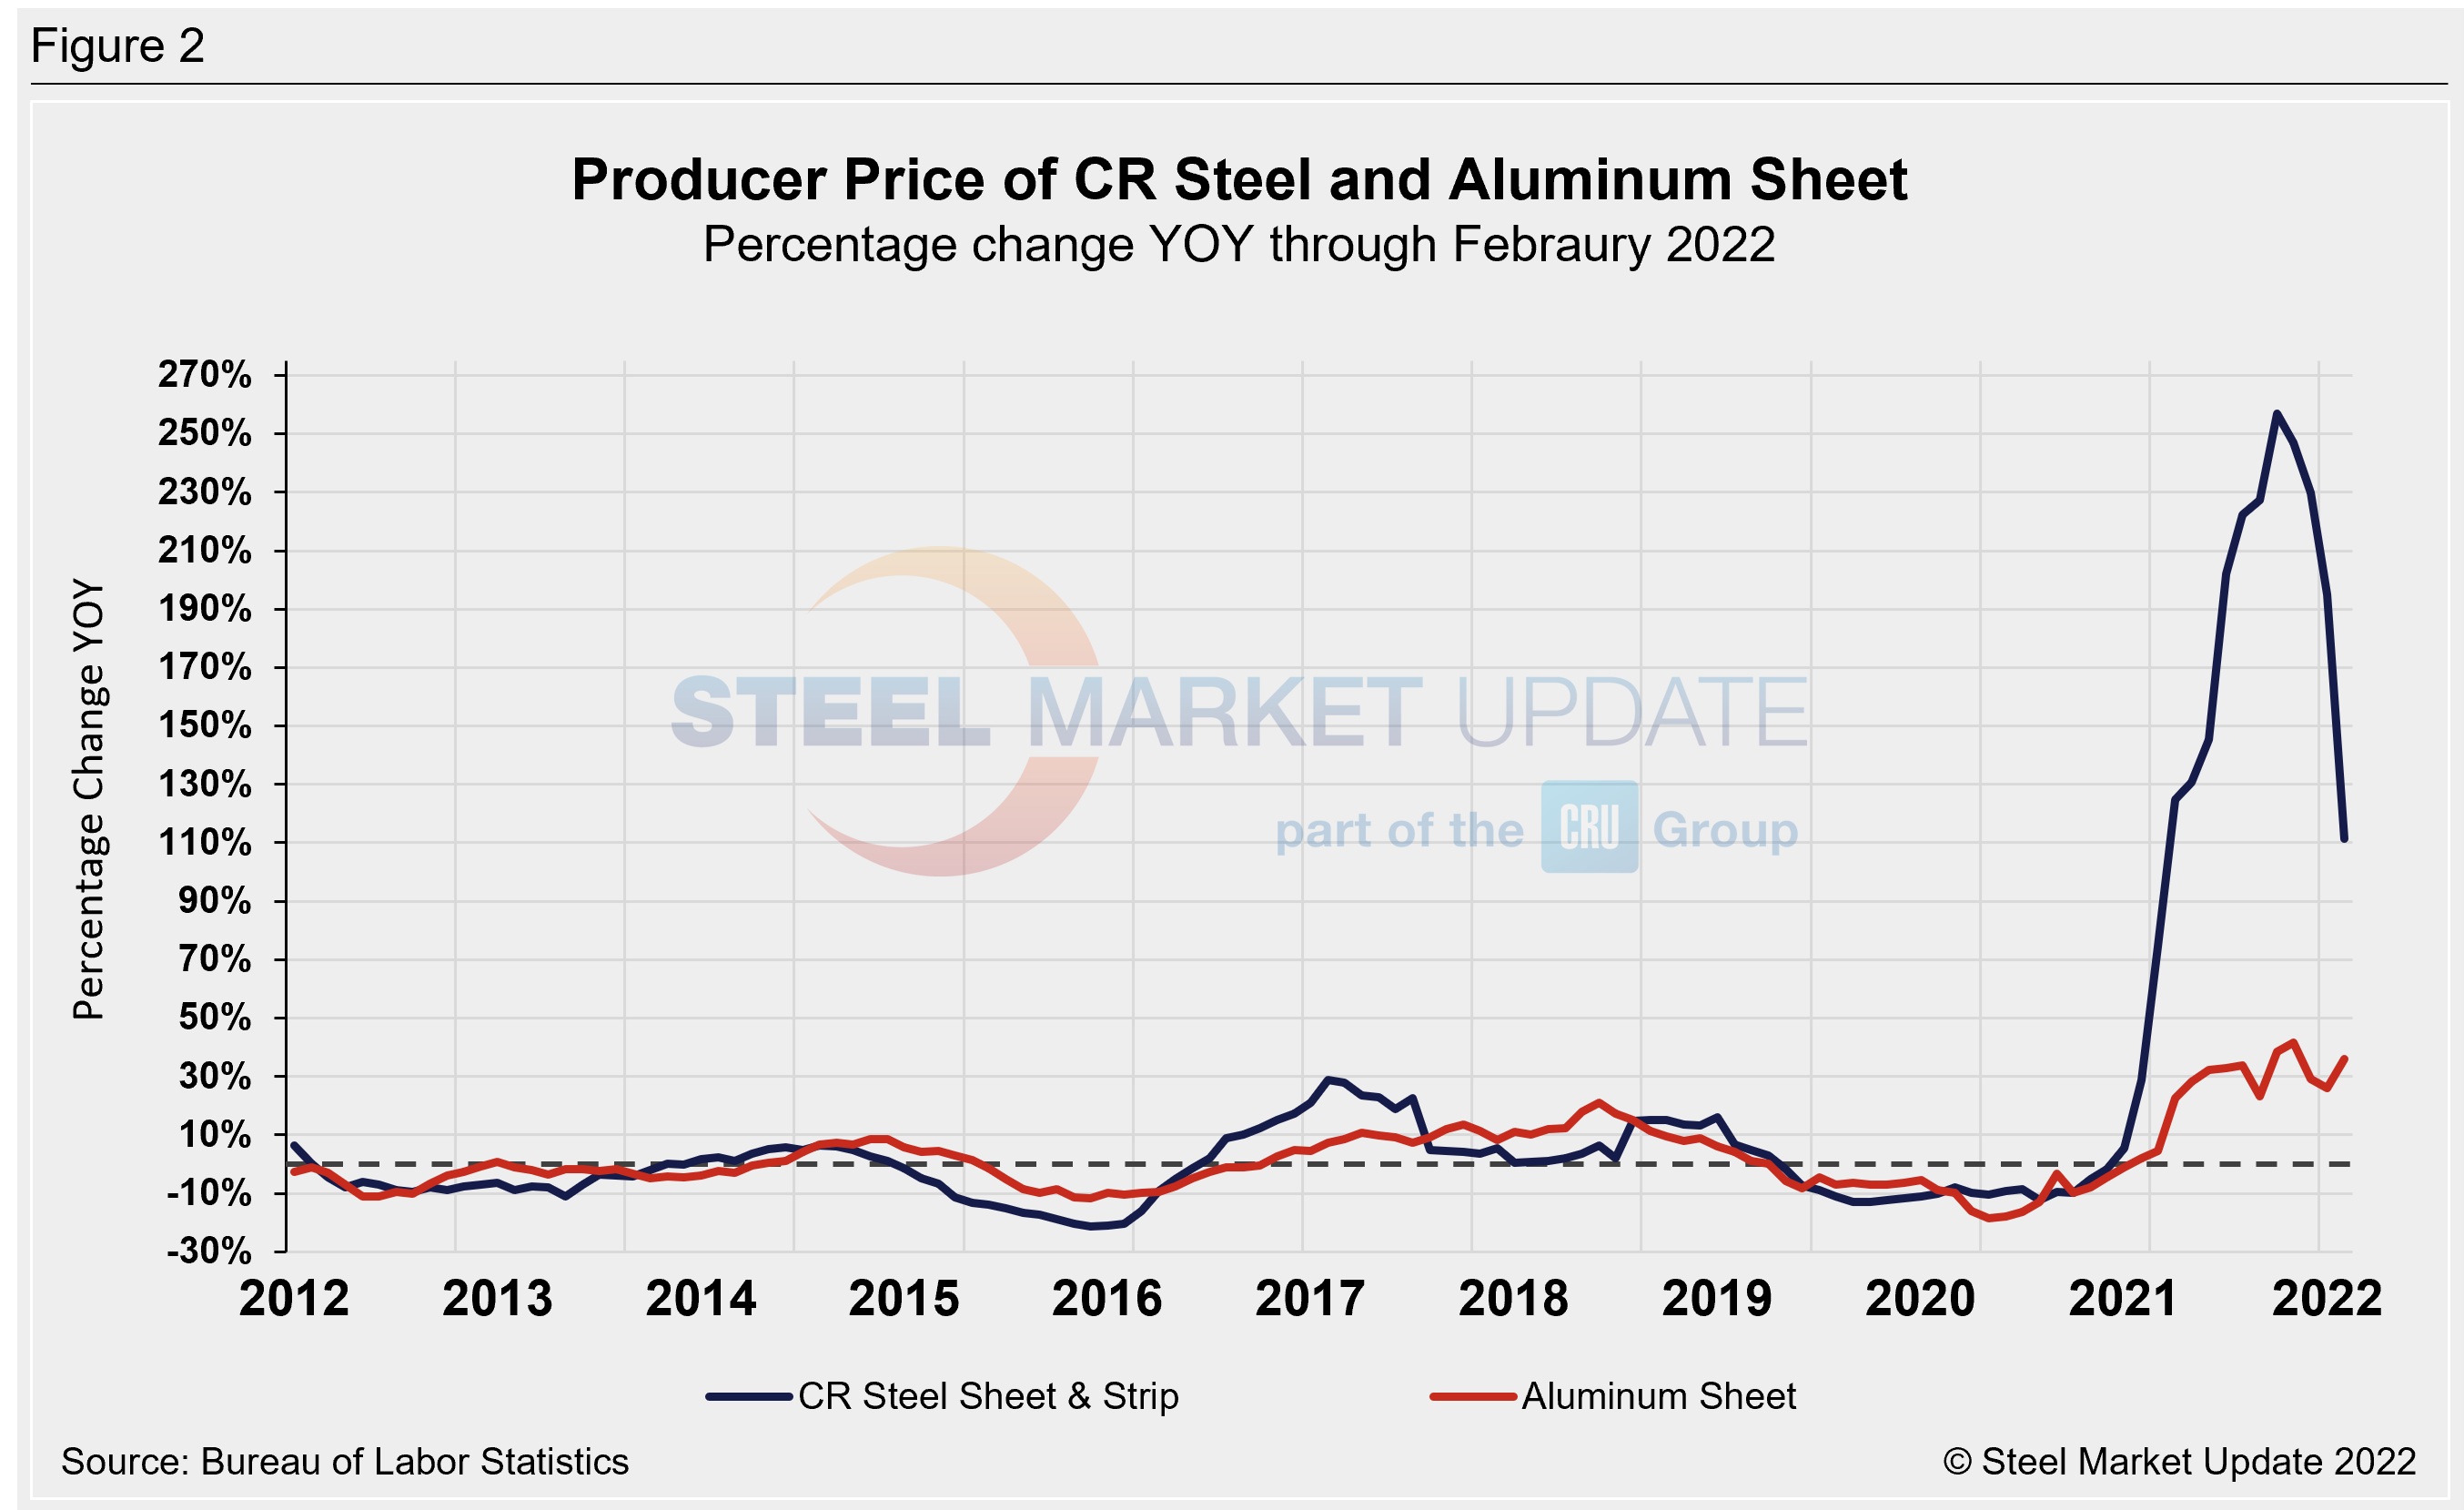
Both steel and aluminum products (Figure 2) have easily overtaken pre-pandemic PPI figures and reached recent highs, but began to lose ground on price declines in February. Comparing the price changes of cold-rolled steel sheet and flat-rolled aluminum, both recovered from 2020’s losses and reached historic highs. The trajectory in cold-rolled steel sheet prices overshadowed the impressive rebound in flat-rolled aluminum. Cold rolled has continued to erode while flat-rolled aluminum expanded in February. That trend has already shifted with a strong recovery in March expected for next month’s results.
Cold-rolled steel prices reached positive territory for the first time since last January after the initial fall in April 2020. They had jumped by 194.8% through January, but fell 15.1% monthly, down to 111.4% year-on-year in February, yet a big 145.2 percentage points from October’s high of 256.6%. Flat-rolled aluminum, by comparison, is presently at 36.0%, up 10.1 percentage points from January, but down from November’s high of 41.7%.
Cold-rolled steel price gains had shown significant growth since July. Its earlier growth rate lead on a percentage basis over hot rolled steel prices continues, as hot-rolled prices fell at a moderately faster rate through February, down 16.0% last month, compared to a 15.1% decrease during the same period.
Though aluminum prices are well behind steel in terms of growth, they had a strong run, improving month on month for nearly a year since October 2020. In contrast, steel tinware and aluminum cans have remained largely stable over the past 16 months, but jumped 10.2% month on month in February to a reading of 294.7 from 267.4 in January. Aluminum cans grew by 0.1% month on month and were up 31.5% year on year through February.
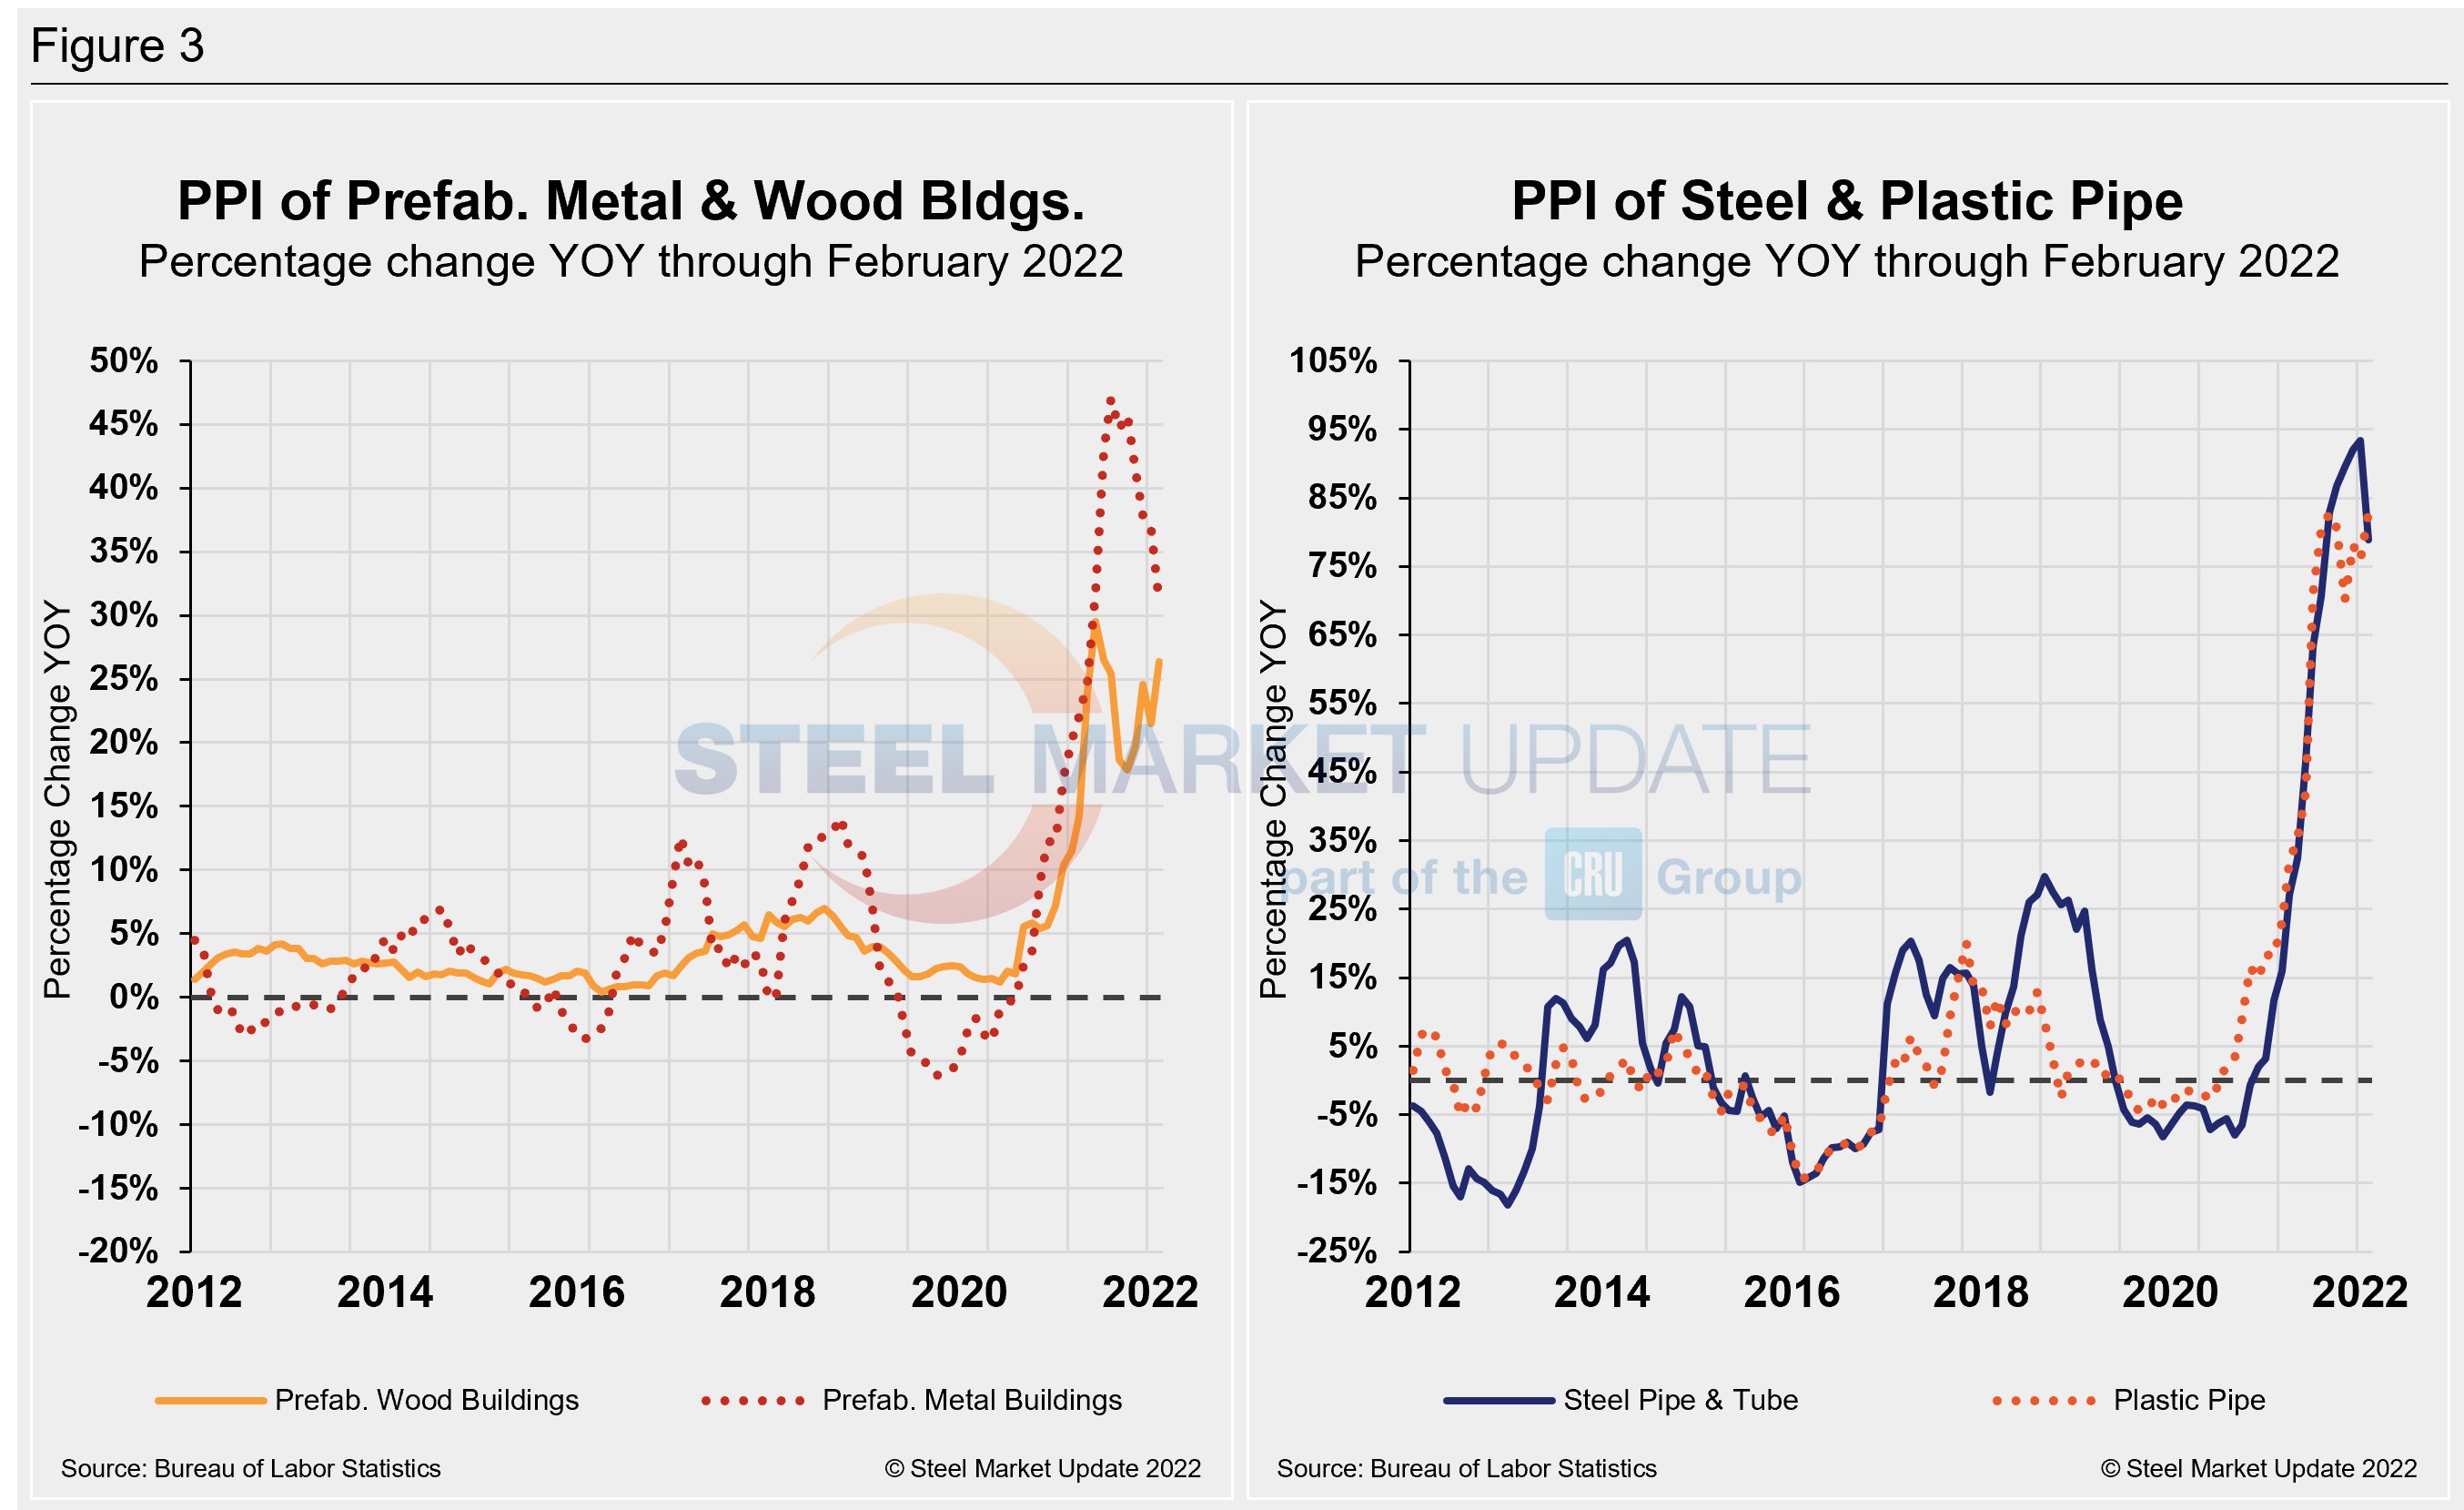
Prices of prefabricated metal buildings and prefabricated wood buildings have both seen significant increases since the beginning of 2021, but the rate of growth has diverged over the past few months, with prices for prefabricated wood buildings accelerated in February by 7.2%. Prefabricated steel building prices fell to a negative 3.5% in June 2020, but rallied to a positive by 37.9% over 17 months, but growing by just 0.3% month on month. A similar trend was seen for prefabricated wood buildings over the same period at 24.6% growth to close out 2021. Momentum shifted down in January but recovered in February as inflation takes hold of construction goods.
The prices of steel and plastic pipe have both experienced big swings due to COVID-19 as well. Steel pipe prices dropped to a negative 8.0% through September 2020, but rallied to a positive 78.9% 17 months on, with a 0.7% increase in February. By comparison, plastic pipe has rallied by more than 73.0 over the past 12 months, reaching a positive 82.8% growth in February on a year-on-year basis, and up 5.2% versus January. Figure 3 is a side-by-side comparison of prefabricated buildings and pipe price dynamics.
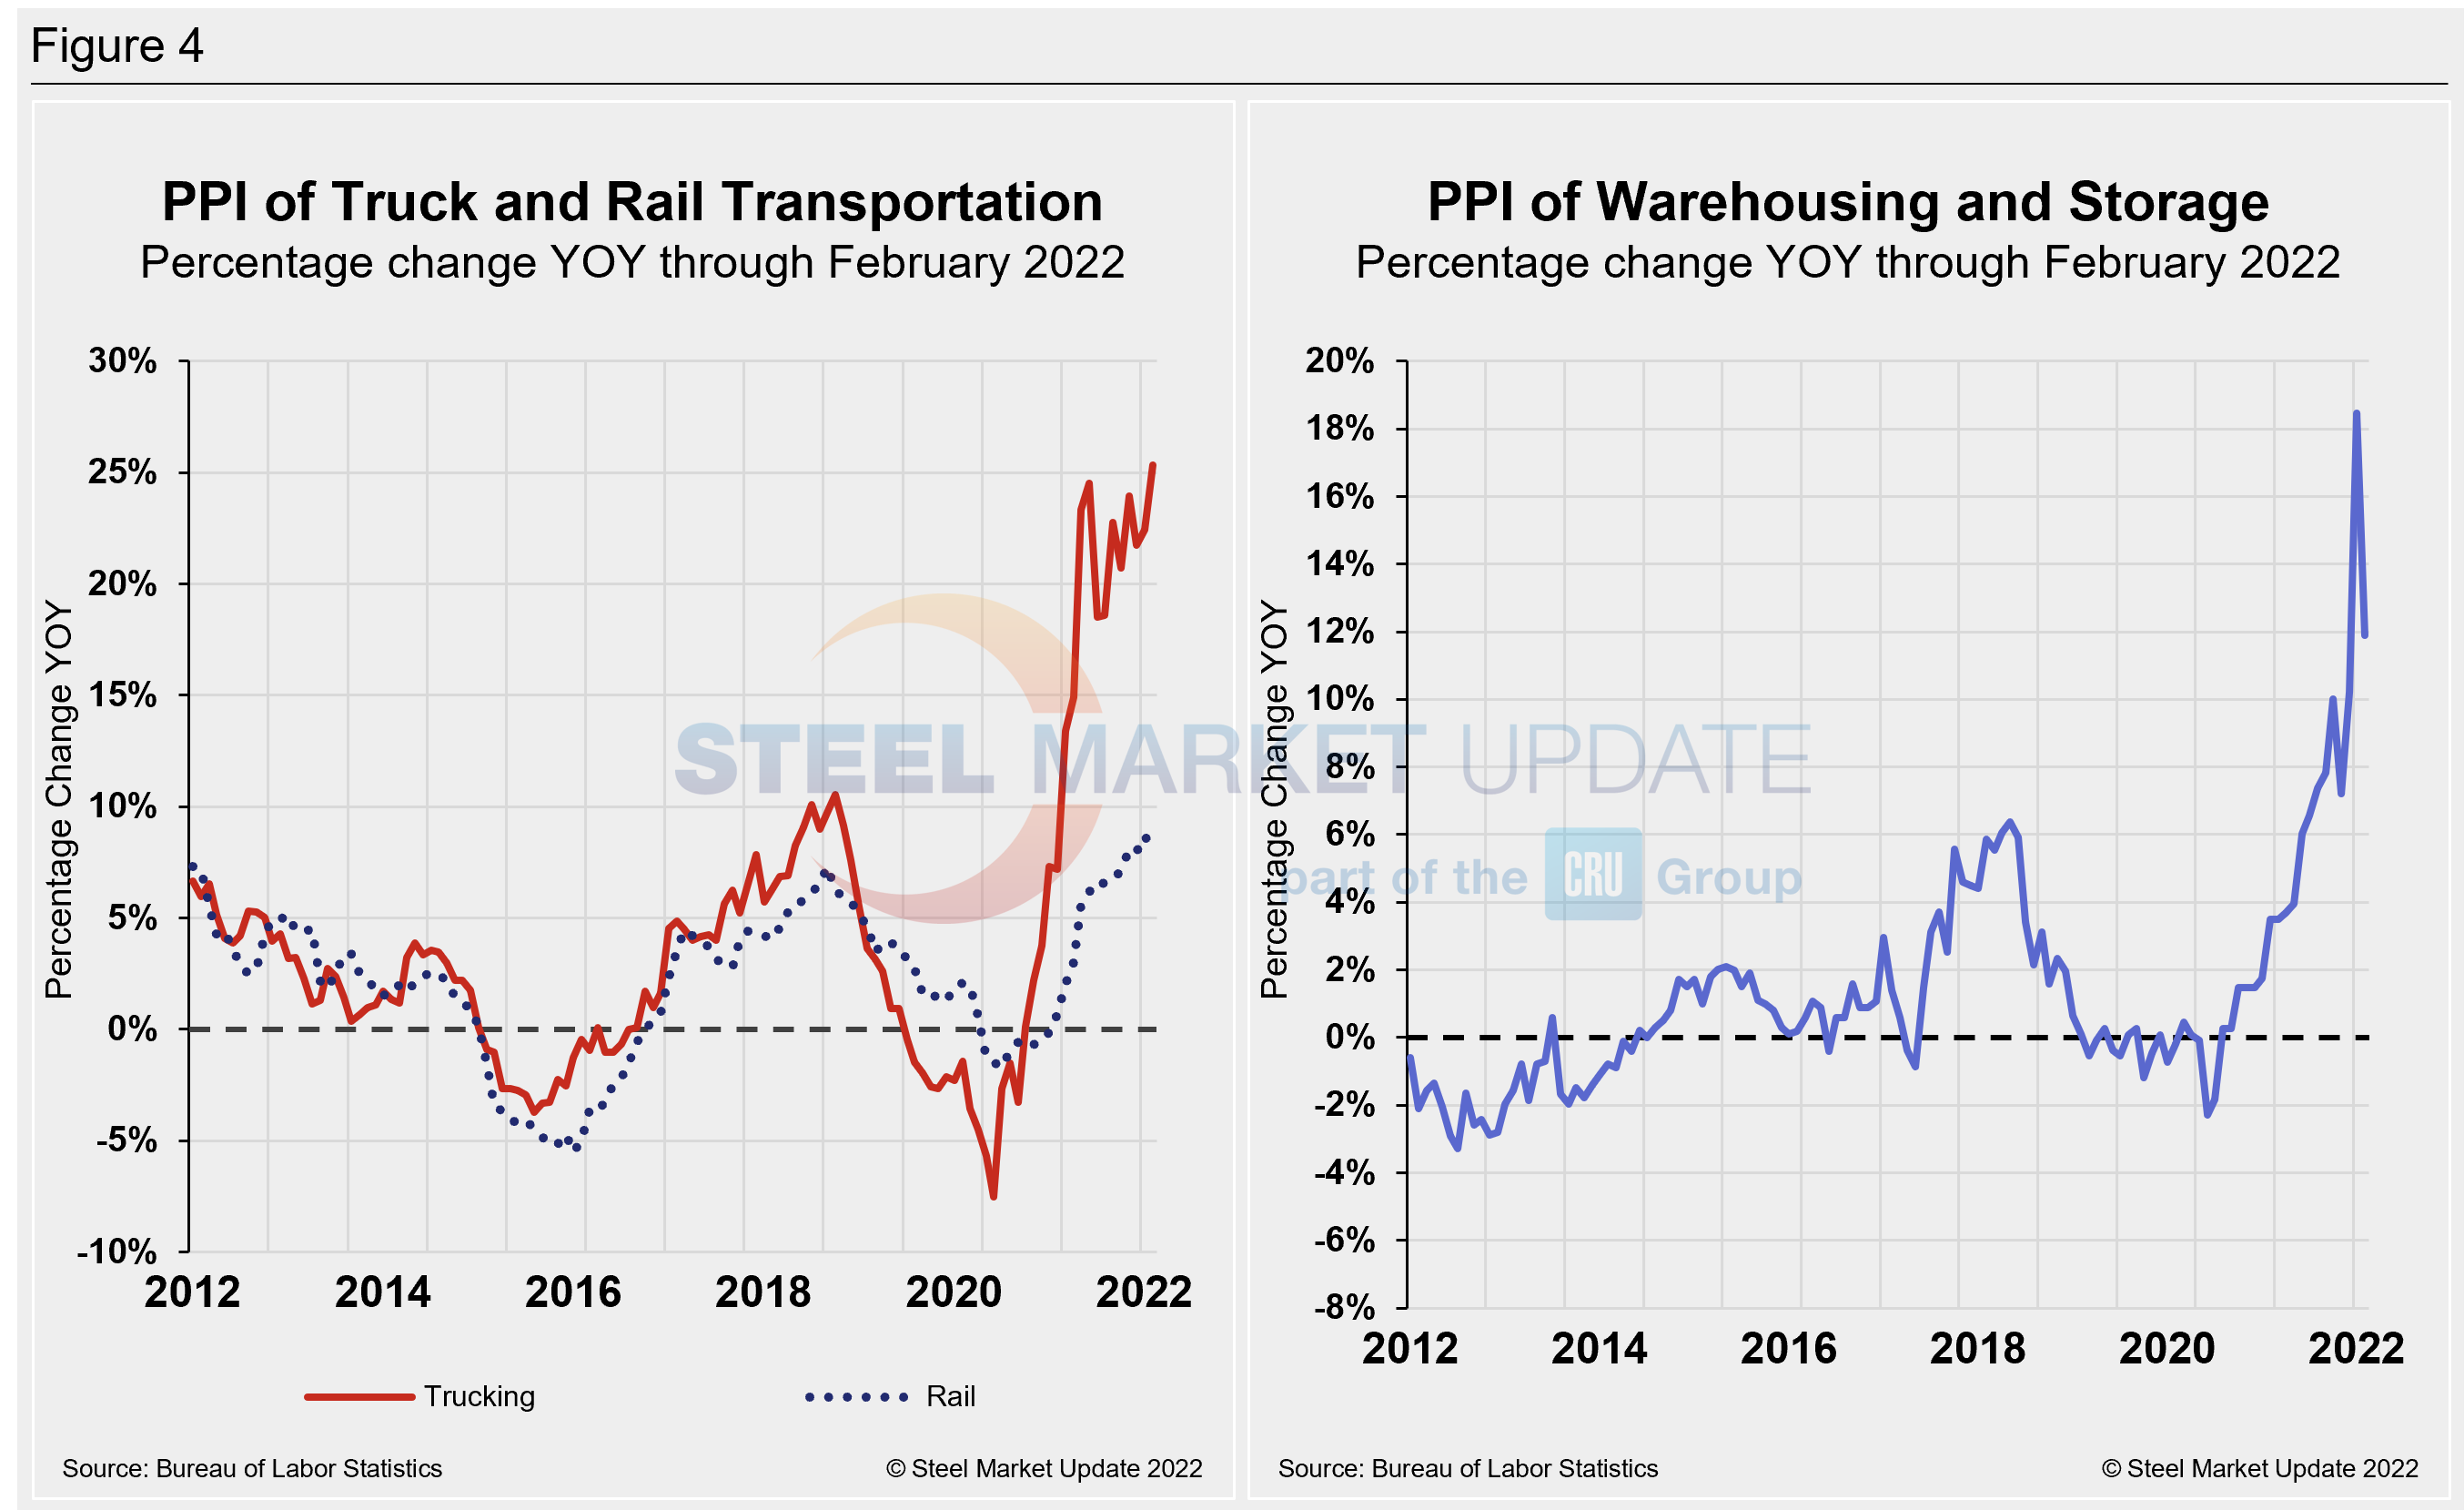
The growth of truck transportation prices has far exceeded those of rail since they both bottomed out in June 2020. Rail dipped to a negative 1.7% at that time but has since steadily corrected to a positive 8.0% through February. Long-distance trucking, on the other hand, recovered to 23.9% this past November after falling to -7.5% in July 2020. Trucking has been a bit erratic of late, however, the increased freight pricing over the past year has been a significant factor for steel buyers dealing with the ever-changing steel price. Even though long-distance grew by just 2.1% month on month, freight costs have experienced the most significant increase in more than a decade.
Warehousing and storage prices also have risen, hitting the highest measure in January. After initially falling to -2.3% at the onset of the global pandemic, they had rebounded to 18.5% through January. Prices for warehousing and storage slipped 4.1% month on month in February to a reading of 125.4, and 11.9% above the same year-ago level. Figure 4 is a side-by-side comparison of transportation and warehousing dynamics.
The official description of this program from the BLS reads as follows: “The Producer Price Index (PPI) is a family of indexes that measure the average change over time in the prices received by domestic producers of goods and services. PPIs measure price change from the perspective of the seller. This contrasts with other measures, such as the Consumer Price Index (CPI). CPIs measure price changes from the purchaser’s perspective. Sellers’ and purchasers’ prices can differ due to government subsidies, sales and excise taxes, and distribution costs. More than 10,000 PPIs for individual products and groups of products are released each month. PPIs are available for the products of virtually every industry in the mining and manufacturing sectors of the U.S. economy. New PPIs are gradually being introduced for the products of industries in the construction, trade, finance, and services sectors of the economy. More than 100,000 price quotations per month are organized into three sets of PPIs: (1) stage-of-processing indexes, (2) commodity indexes, and (3) indexes for the net output of industries and their products. The stage-of-processing structure organizes products by class of buyer and degree of fabrication. The commodity structure organizes products by similarity of end use or material composition. The entire output of various industries is sampled to derive price indexes for the net output of industries and their products.
By David Schollaert, David@SteelMarketUpdate.com


