

Prices

April 28, 2022
Ferrous Futures: The Price of War, Madness and Short Squeezes
Written by David Feldstein
Editor’s note: SMU Contributor David Feldstein is president of Rock Trading Advisors. Rock provides customers attached to the steel industry with commodity price risk management services and market intelligence. RTA is registered with the National Futures Association as a Commodity Trade Advisor. David has over 20 years of professional trading experience and has been active in the ferrous derivatives space since 2012.
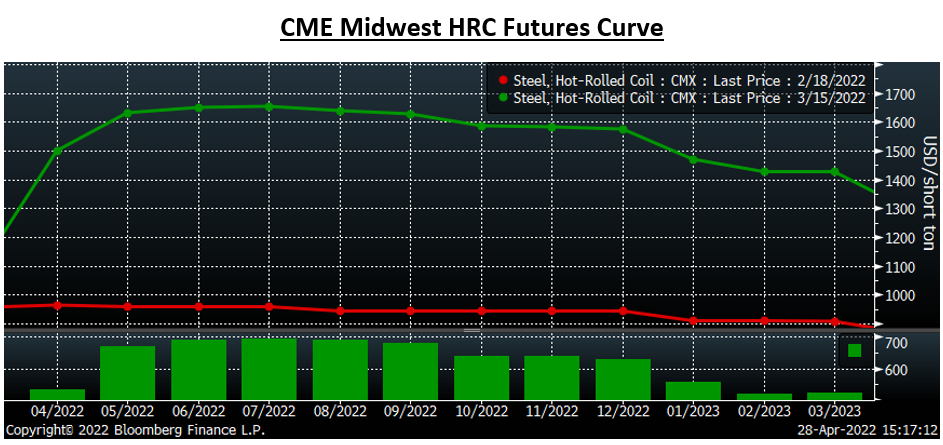
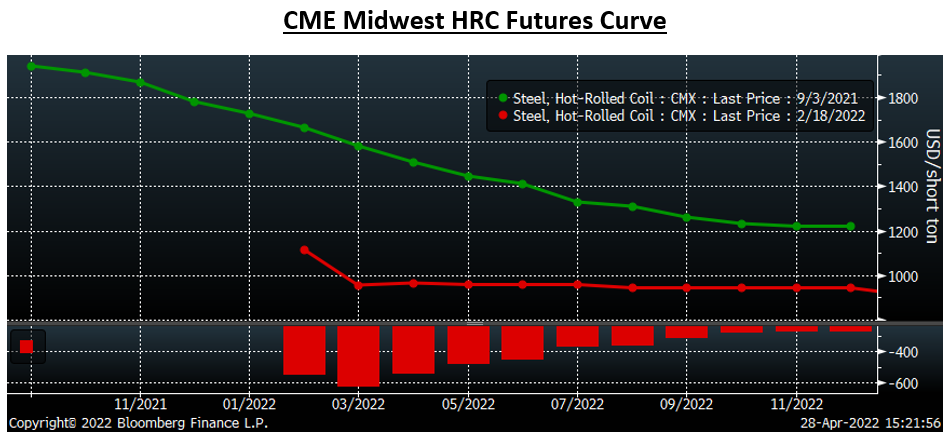
This chart shows the CME Midwest HRC futures curve through March 2023. The CME HR futures curve is made up of 36 monthly contracts that are financially delivered (that means there is no physical metal transacted), with each expiring month’s contract settlement calculated at the monthly average of the CRU Midwest Index prices.
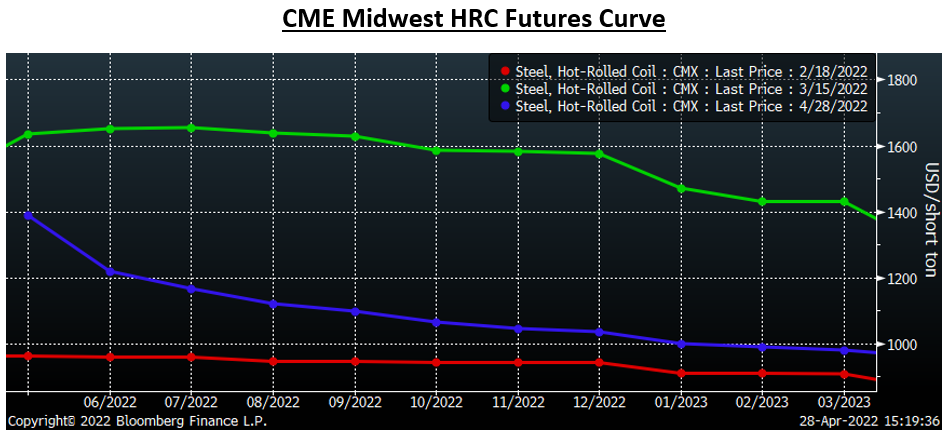
In the upper-right hand corner, you will see the red curve corresponds to Feb. 18. The green curve corresponds to March 15. Feb. 18 was the Friday before President’s Day, which was the day Cleveland-Cliffs made the first price increase announcement of 2022. It was also the day Vladimir Putin declared breakaway areas in eastern Ukraine to be independent. Russia launched a full-scale invasion just days later.
I chose March 15 because it was the top of the market. The panel at the bottom of the chart shows the price change for each month. The futures months of June, July, and August increased by almost $700 per ton ($35 per cwt) over less than a month while the rest of the curve also moved significantly higher. Notice how the curve maintained its flat shape through March 15.
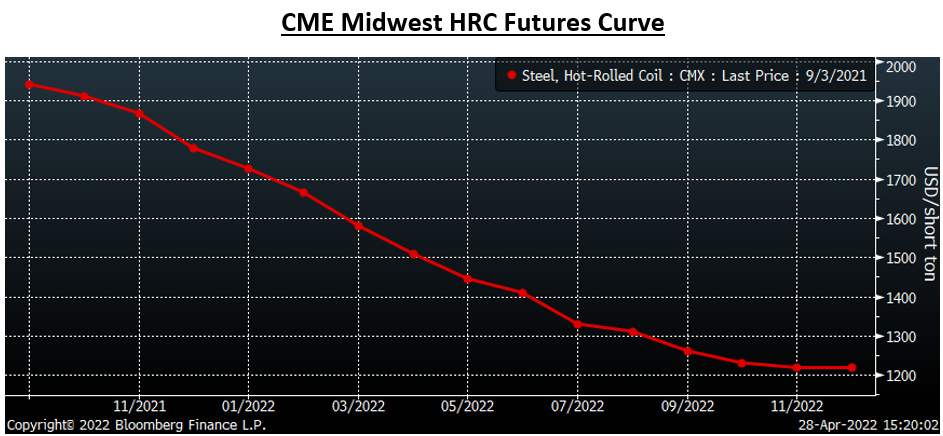
This chart shows the curve on Sept. 3 of last year. Notice how steeply backwardated, or down-sloping, the curve was back then. The November ’21 future ($1,867) was almost $300 higher than the March future ($1,580). Domestic steel fundamentals were unequivocally stronger for steel mills last September relative to two months ago, yet the curve remained flat during its epic run in March. If you hang around financial markets long enough, you’re bound to hear the saying “the market can stay irrational longer than you can stay solvent.” In retrospect, the Midwest HRC futures market was irrational during this period. What caused the curve to take this shape and not the backwardated shape shown below?
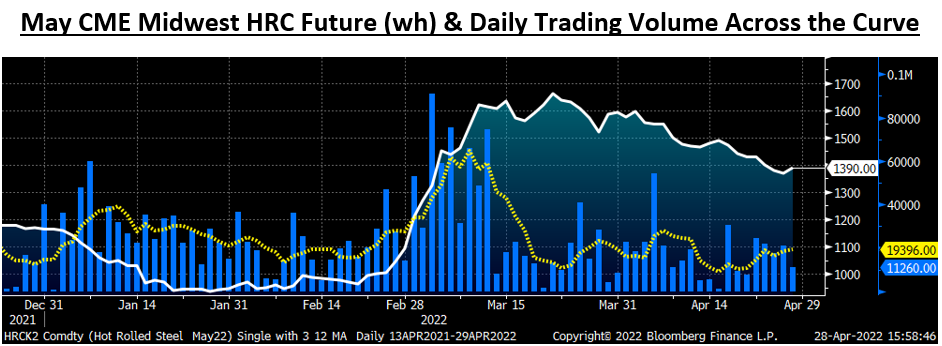
Here are some additional facts. This chart of the May future also includes the daily volume across the entire curve (blue) with a five-day moving average (yellow). Trading volume erupted after Feb. 18 moving from an average of around 20k tons per day to almost 65k tons per day, with 91k tons traded on March 3. Considering the massive move higher in the future, we can assume buyers were aggressively initiating trades, and there was a stark imbalance of more buyers than sellers.
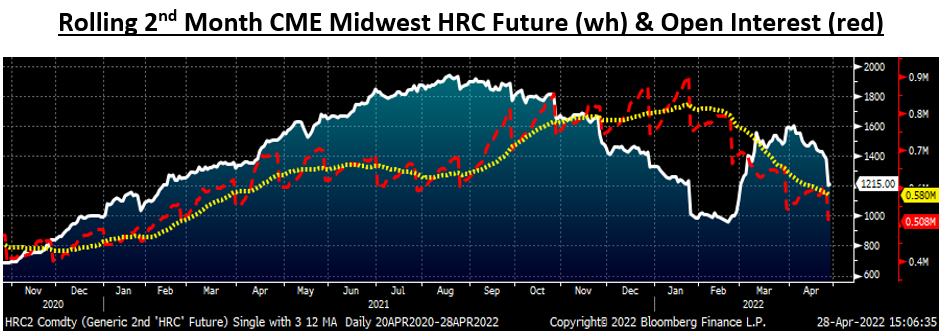
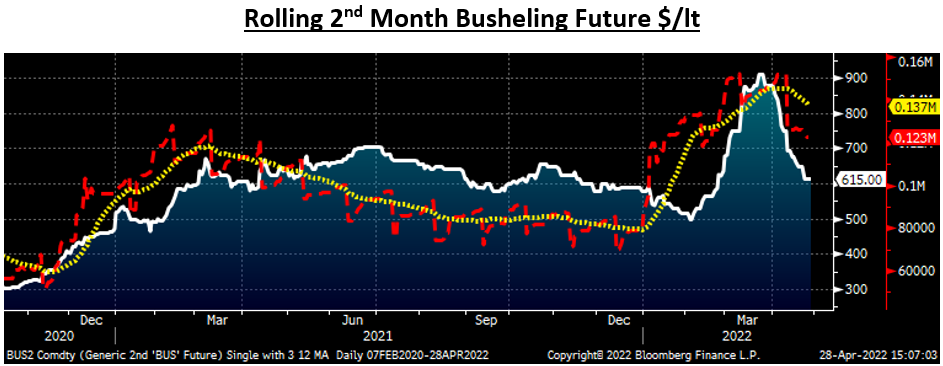
This chart of the rolling 2nd month HR future shows the aggregate open interest across the curve. Open interest is the number of open contracts in tons held by market participants. If new positions are initiated, open interest grows. If open positions are closed, open interest contracts. Open interest peaked in late January just above 900k and sits just above 500k as of last night. From these two charts, we can conclude that there were more buyers than sellers, that volume was abnormally high, and that open interest declined rapidly. This tells us a significant percentage of the volume was shorts closing their positions. But we already knew it was a short squeeze. What I really want to know is how much of that rally higher was due to commercial players closing out their short hedges and how much of the rally was predatory players/speculators pushing up the market to squeeze these players out of their positions?
Taking a step back, the steeply backwardated curve from Sept. 3 had completely flattened out around $950 by mid-February after declining by over $600 in the March future and incrementally less in each month after that. The basic rule of thumb regarding the shape of the curve is this: a physical market in tight supply, or a shortage, will present a steeply backwardated curve; an upward sloping curve, an oversupplied market; and a flat curve, a market in balance. What was strange in the flat curve shown above on March 15 is that it should have presented as a shortage situation considering fears of a supply shock caused by Russia’s invasion. Perhaps this can be explained by irrational behavior, or perhaps it was financial market participants blindly plowing funds into commodity markets regardless of the product or month or the contract’s specifications. For instance, the March future traded at $1,228 on March 7, which was near impossible to eclipse by settlement considering March’s first CRU print of $935 had already posted. However, if the real goal in buying that future was to force commercial players holding a portfolio of short futures positions to choose between posting more margin or being forced to liquidate their position, then their aim might have been accomplished.
The squeeze over that period was like a fever, and that fever suddenly broke. In the chart above, you can see the volume dry up once the fever broke and trading in the futures ground to a halt. With a sharp drop-off in volume and open interest, there was little buying left to support the $700 rally. Since mid-March, the HRC futures market has lost all its exuberance and given back most, but not all, of the gains seen since Feb. 18 while also moving back into backwardation.
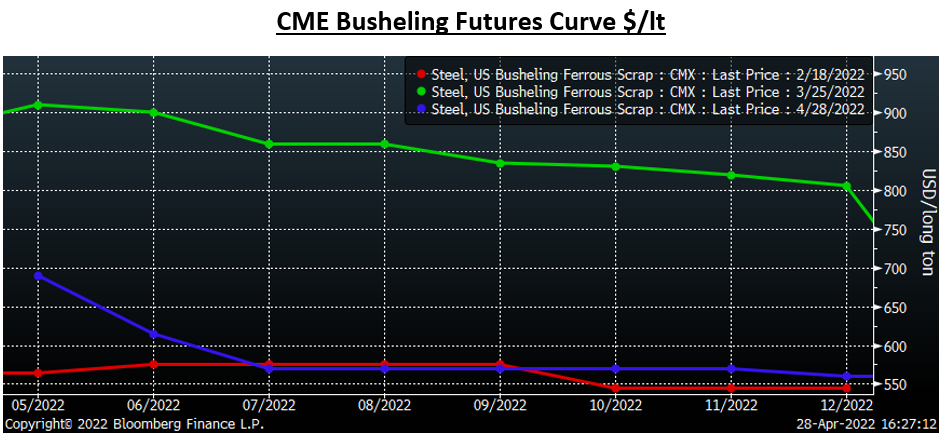
The surge in buying occurred all over the place in commodity derivatives. Metals, energy, ags, etc., saw irrational behavior and short squeezes. The busheling market was one that was likely on the verge of a “liquidation event” as a buyer or buyers steadily bid up futures day after day. The busheling market got very close to pushing the futures above $1,000 or higher due to the illiquidity in the busheling market, but it never did. As you can see below, the rolling 2nd month busheling future trading $910 on March 25.
Fears over a shortage in the busheling futures made relatively more sense considering 60%+ of US pig iron imports originate in Russia and Ukraine. However, the busheling curve did shift into backwardation. Over the past month, all the buying that had pushed prices above $900 went poof. Except for in May and June, the curve has floated back down to where it was on Feb. 18, despite the war in Ukraine raging on. This seems almost irrational that it has fallen so low considering pig iron prices remain above $900. However, since the market is so illiquid, it is susceptible to huge swings, so maybe we see another big rally in busheling.
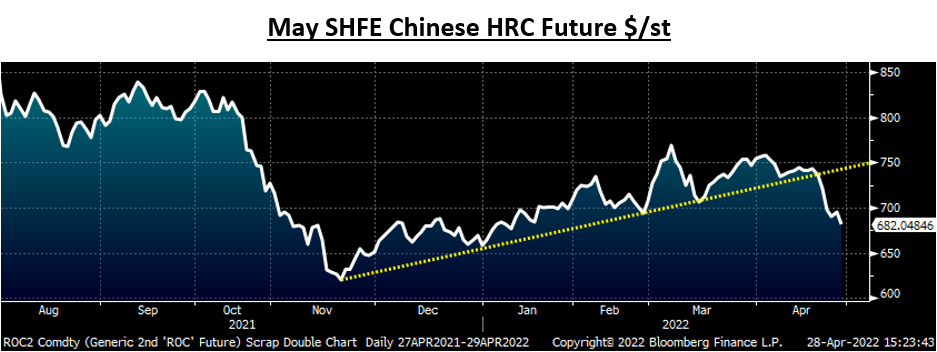
So where does HRC futures go from here? Global hot rolled prices are a key indicator due to the import market’s influence on Midwest prices. Hot rolled prices across Asia saw some gains following the invasion, but nowhere near the 50%+ rally seen in Europe and the US. The May Chinese HR future rallied from $700 to $775/st in early March, but quickly turned around. Over the past few trading days, the May future broke below its bull trendline closing today at $682/st, its lowest level since January. The May CME HR future settled today at $1390, or $708 above the Chinese future.
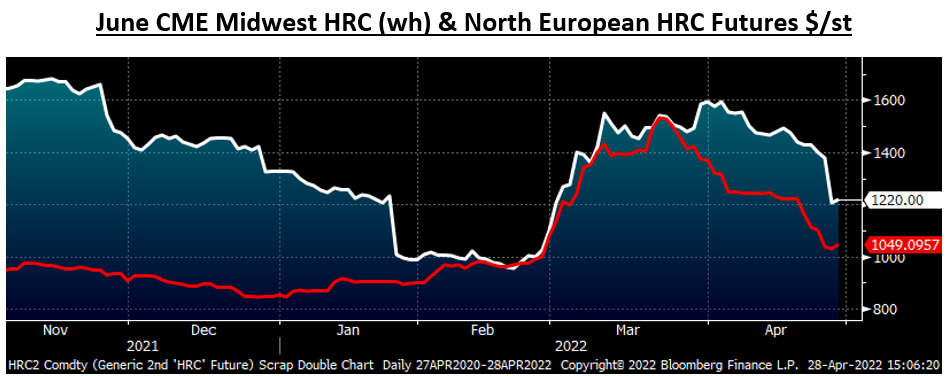
The June CME North European future, which had spiked from $1,000 to $1,525/st has since given back most of its gains, settling today at $1,049/st. Apparently a significant number of US tons are not going to be exported to Europe for now as was the rumor in March.
Another key factor in the path forward for HR and HR futures is how much domestic demand was brought forward during the frenzied physical buying seen in March. What does the follow through look like in the weeks ahead? Will physical indices continue to fall in the weeks ahead, ushering back in expectations for lower prices tomorrow or next week – and causing buyers to hold off their orders as they did from last December through mid-February?
Today’s HR futures settlement were green for the first time in weeks. Have they fallen far enough yet to the point where some forward buyers step in to lock up prices $300-$400 below this week’s CRU?
On March 31 I wrote “If the futures were to plummet, would the physical market follow it back down?” The futures have certainly plummeted since then, so now we will watch to see if the tail wags the dog once again.
Disclaimer: The content of this article is for informational purposes only. The views in this article do not represent financial services or advice. Any opinion expressed by Feldstein should not be treated as a specific inducement to make a particular investment or follow a particular strategy, but only as an expression of his opinion. Views and forecasts expressed are as of date indicated, are subject to change without notice, may not come to be and do not represent a recommendation or offer of any particular security, strategy or investment. Strategies mentioned may not be suitable for you. You must make an independent decision regarding investments or strategies mentioned in this article. It is recommended you consider your own particular circumstances and seek the advice from a financial professional before taking action in financial markets.


