

Market Data

July 7, 2022
Steel Mill Lead Times Retract Further in July
Written by Brett Linton
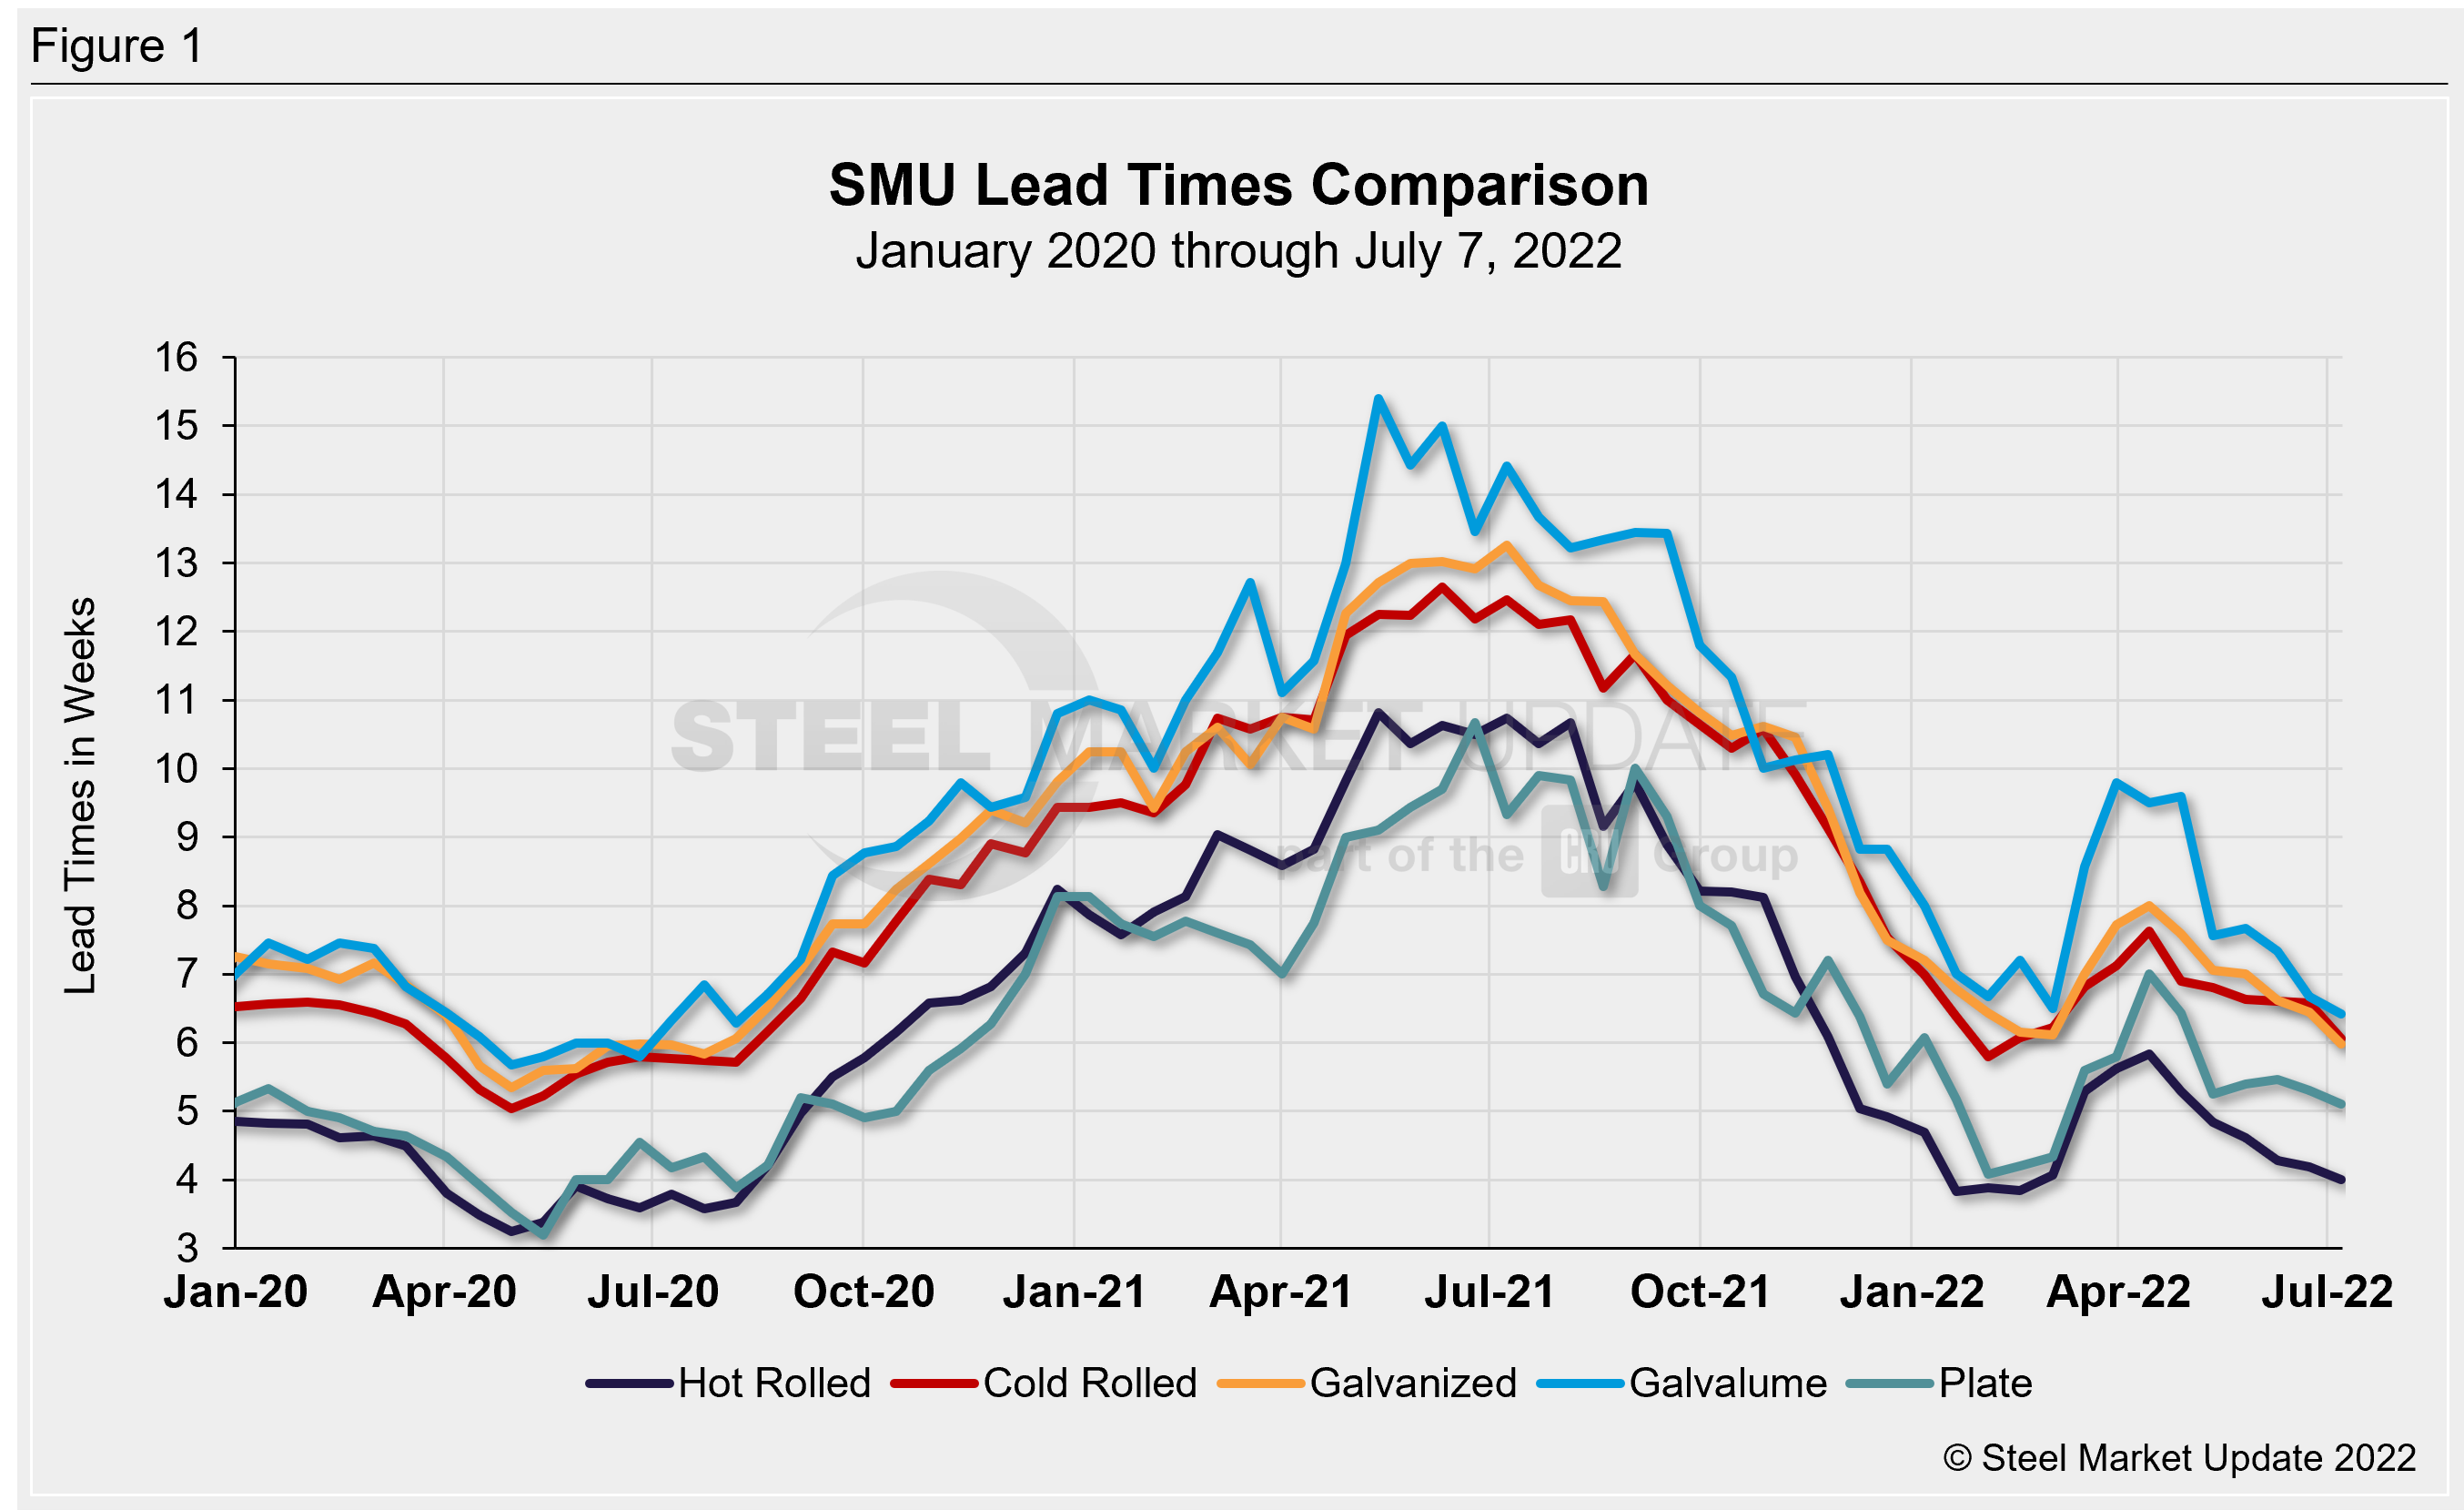
Steel mill lead times continued to shorten into July for both sheet and plate products, according to our latest market check this week. On average this week, lead times declined by 0.3 weeks compared to late June and are down an average of half a week compared to one month prior. Having gradually declined from the April peak, lead times are now back in line with early 2022 lows.
Buyers surveyed this week reported mill lead times ranging from 3-6 weeks for hot rolled, 4-8 weeks for cold rolled and galvanized, 5-8 weeks for Galvalume, and 4-6 weeks for plate.
SMU’s hot rolled lead times now average 4.0 weeks, the shortest they have been since mid-February. HR lead times declined 0.2 weeks compared to two weeks ago and are down from a peak of 5.8 weeks in April. The lowest hot rolled level this year was 3.8 weeks seen in January and in February. The record low in our ~11-year data history was 2.8 weeks in October 2016.
Cold rolled lead times declined 0.6 weeks to 6.1 weeks, down to levels last seen in mid-February. Galvanized lead times eased half a week to 6.0 weeks. They were as low as 6.1 weeks in early March 2022. Our record low was 4.8 weeks in February 2015. The average Galvalume lead time fell from 6.7 weeks to 6.4 weeks, down from 7.3 weeks one month prior.
Mill lead times for plate are now at 5.1 weeks, down 0.2 weeks from our last survey and down 0.4 weeks from one month ago. The lowest plate lead time this year was 4.1 weeks in early February. In our four-year history on plate lead times, the lowest we figure we have recorded was 3.2 weeks in May 2020.
Approximately 56% of the executives responding to this week’s questionnaire told SMU they were seeing slipping lead times, in line with responses from the last month. Roughly 39% said lead times were stable, down from 48% in our previous survey. Approximately 5% of respondents said lead times were extending, up from 0% in late June but in line with the single-digit rate seen in prior months. Here’s what a few of our respondents had to say:
“HRC lead times will remain short until mills start ‘maintenance’ or other measures to shore them up.”
“Mills are offering spot deals. They need the tons.”
“Every mill is calling for business – even ones we have done nothing with.”
“Buyers with inventory (are) still playing the pricing game.”
“Lead times appear to be stable, although they’re stable at very low levels.”
“Companies dropping out and others jumping into the market.”
“I believe mills will start taking action to curb the slide. We’ll see maintenance, idled lines, etc.”
“Lead times are up against physical constraints.”
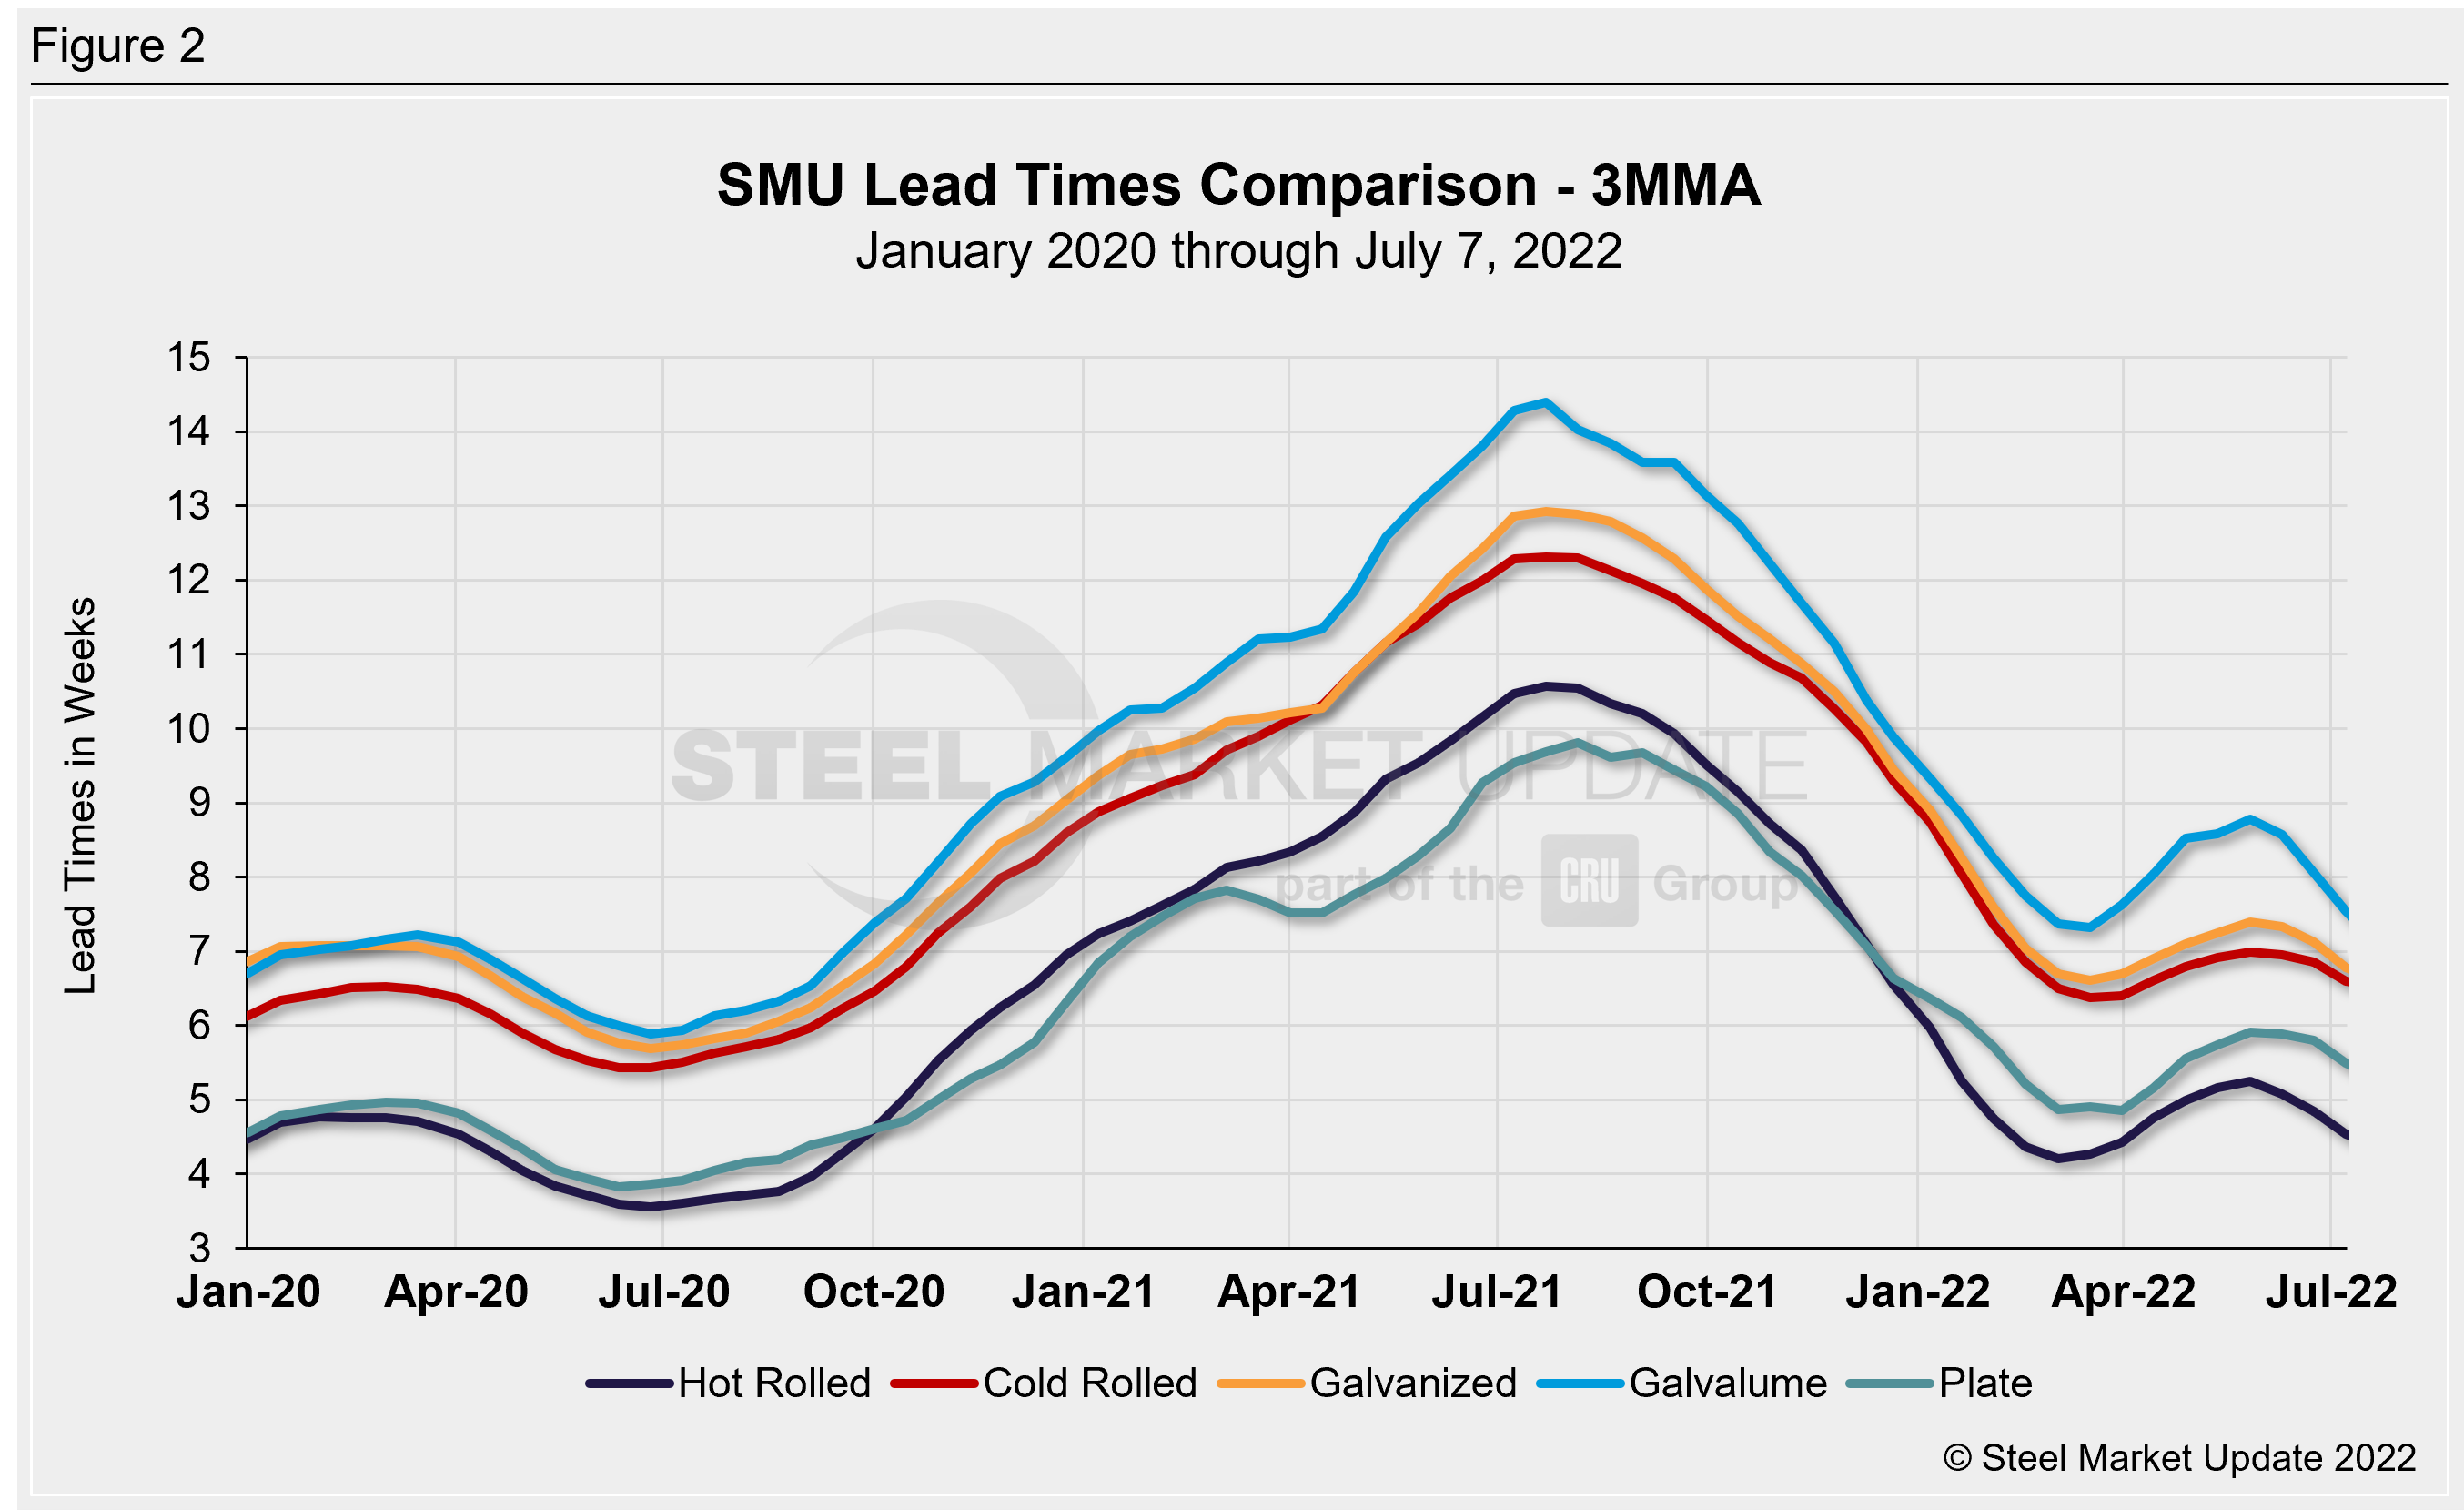
Looking at lead times on a three-month moving average can smooth out the variability in the biweekly readings. As a 3MMA, all products were down between 0.3-0.6 weeks compared to two weeks prior and down as much as one full week compared to early June. The current 3MMA for hot rolled is down 0.3 weeks to 4.5 weeks, cold rolled eased 0.3 weeks to 6.6 weeks, galvanized is down 0.3 weeks to 6.8 weeks, Galvalume declined 0.6 weeks to 7.5 weeks, and plate slipped by 0.3 weeks to 5.5 weeks.
Note: These lead times are based on the average from manufacturers and steel service centers who participated in this week’s SMU market trends analysis. SMU measures lead times as the time it takes from when an order is placed with the mill to when the order is processed and ready for shipping, not including delivery time to the buyer. Our lead times do not predict what any individual may get from any specific mill supplier. Look to your mill rep for actual lead times. To see an interactive history of our Steel Mill Lead Times data, visit our website here.
By Brett Linton, Brett@SteelMarketUpdate.com


