

Market Data

July 13, 2022
May Shipments and Supply of Steel Products
Written by David Schollaert
Total mill shipments of steel products grew in May, after shrinking the month prior. May’s mill shipments totaled 8.38 million tons, a 3.1% increase from April’s 8.12 million tons. Apparent supply also recovered in May, up 3.9% versus the prior month.
This analysis is based on steel mill shipment data from the American Iron and Steel Institute (AISI) and import-export data from the US Department of Commerce (DOC). The analysis summarizes total steel supply by product from 2009 through May 2022 and year-on-year changes.
The supply/demand differential remains in place with supply still topping demand even though both rebounded in May. Apparent supply (domestic shipments plus imports) in May rose by nearly 4% on the heels of a 3.9% uptick in domestic shipments month-on-month (MoM), even though exports slipped by 3.5% over the same period. Imports were also MoM, but at a marginal rate in May versus April’s total.
Domestic mill utilization averaged 81.9% through May, up roughly 1.6% from April’s 80.6% and up 3.3% versus the same year-ago period. Prices began sliding in May due to strong and steady domestic production, while concerns over raw material availability due to the war in Ukraine began to fade.
SMU’s benchmark hot-rolled coil price declined by roughly $195 per net ton ($9.75 per cwt) in May. They had peaked at $1,480 per ton during the week of April 19. HRC prices closed out May at an average of $1,255 per ton FOB mill, east of the Rockies on May 31. Prices lost momentum throughout the month, a trend that accelerated and has carried well into July.
The earlier price bounce reflected uncertainty stemming from the war in Ukraine and the subsequent sanctions against Russian enterprises. The market has reset since, bringing prices down. According to SMU’s latest check of the market on July 12, the price for HRC averages $910 per ton. Raw steel production, shown below in Figure 1, is based on weekly data from the AISI. It is displayed here as four-week moving averages through June 3, 2022.
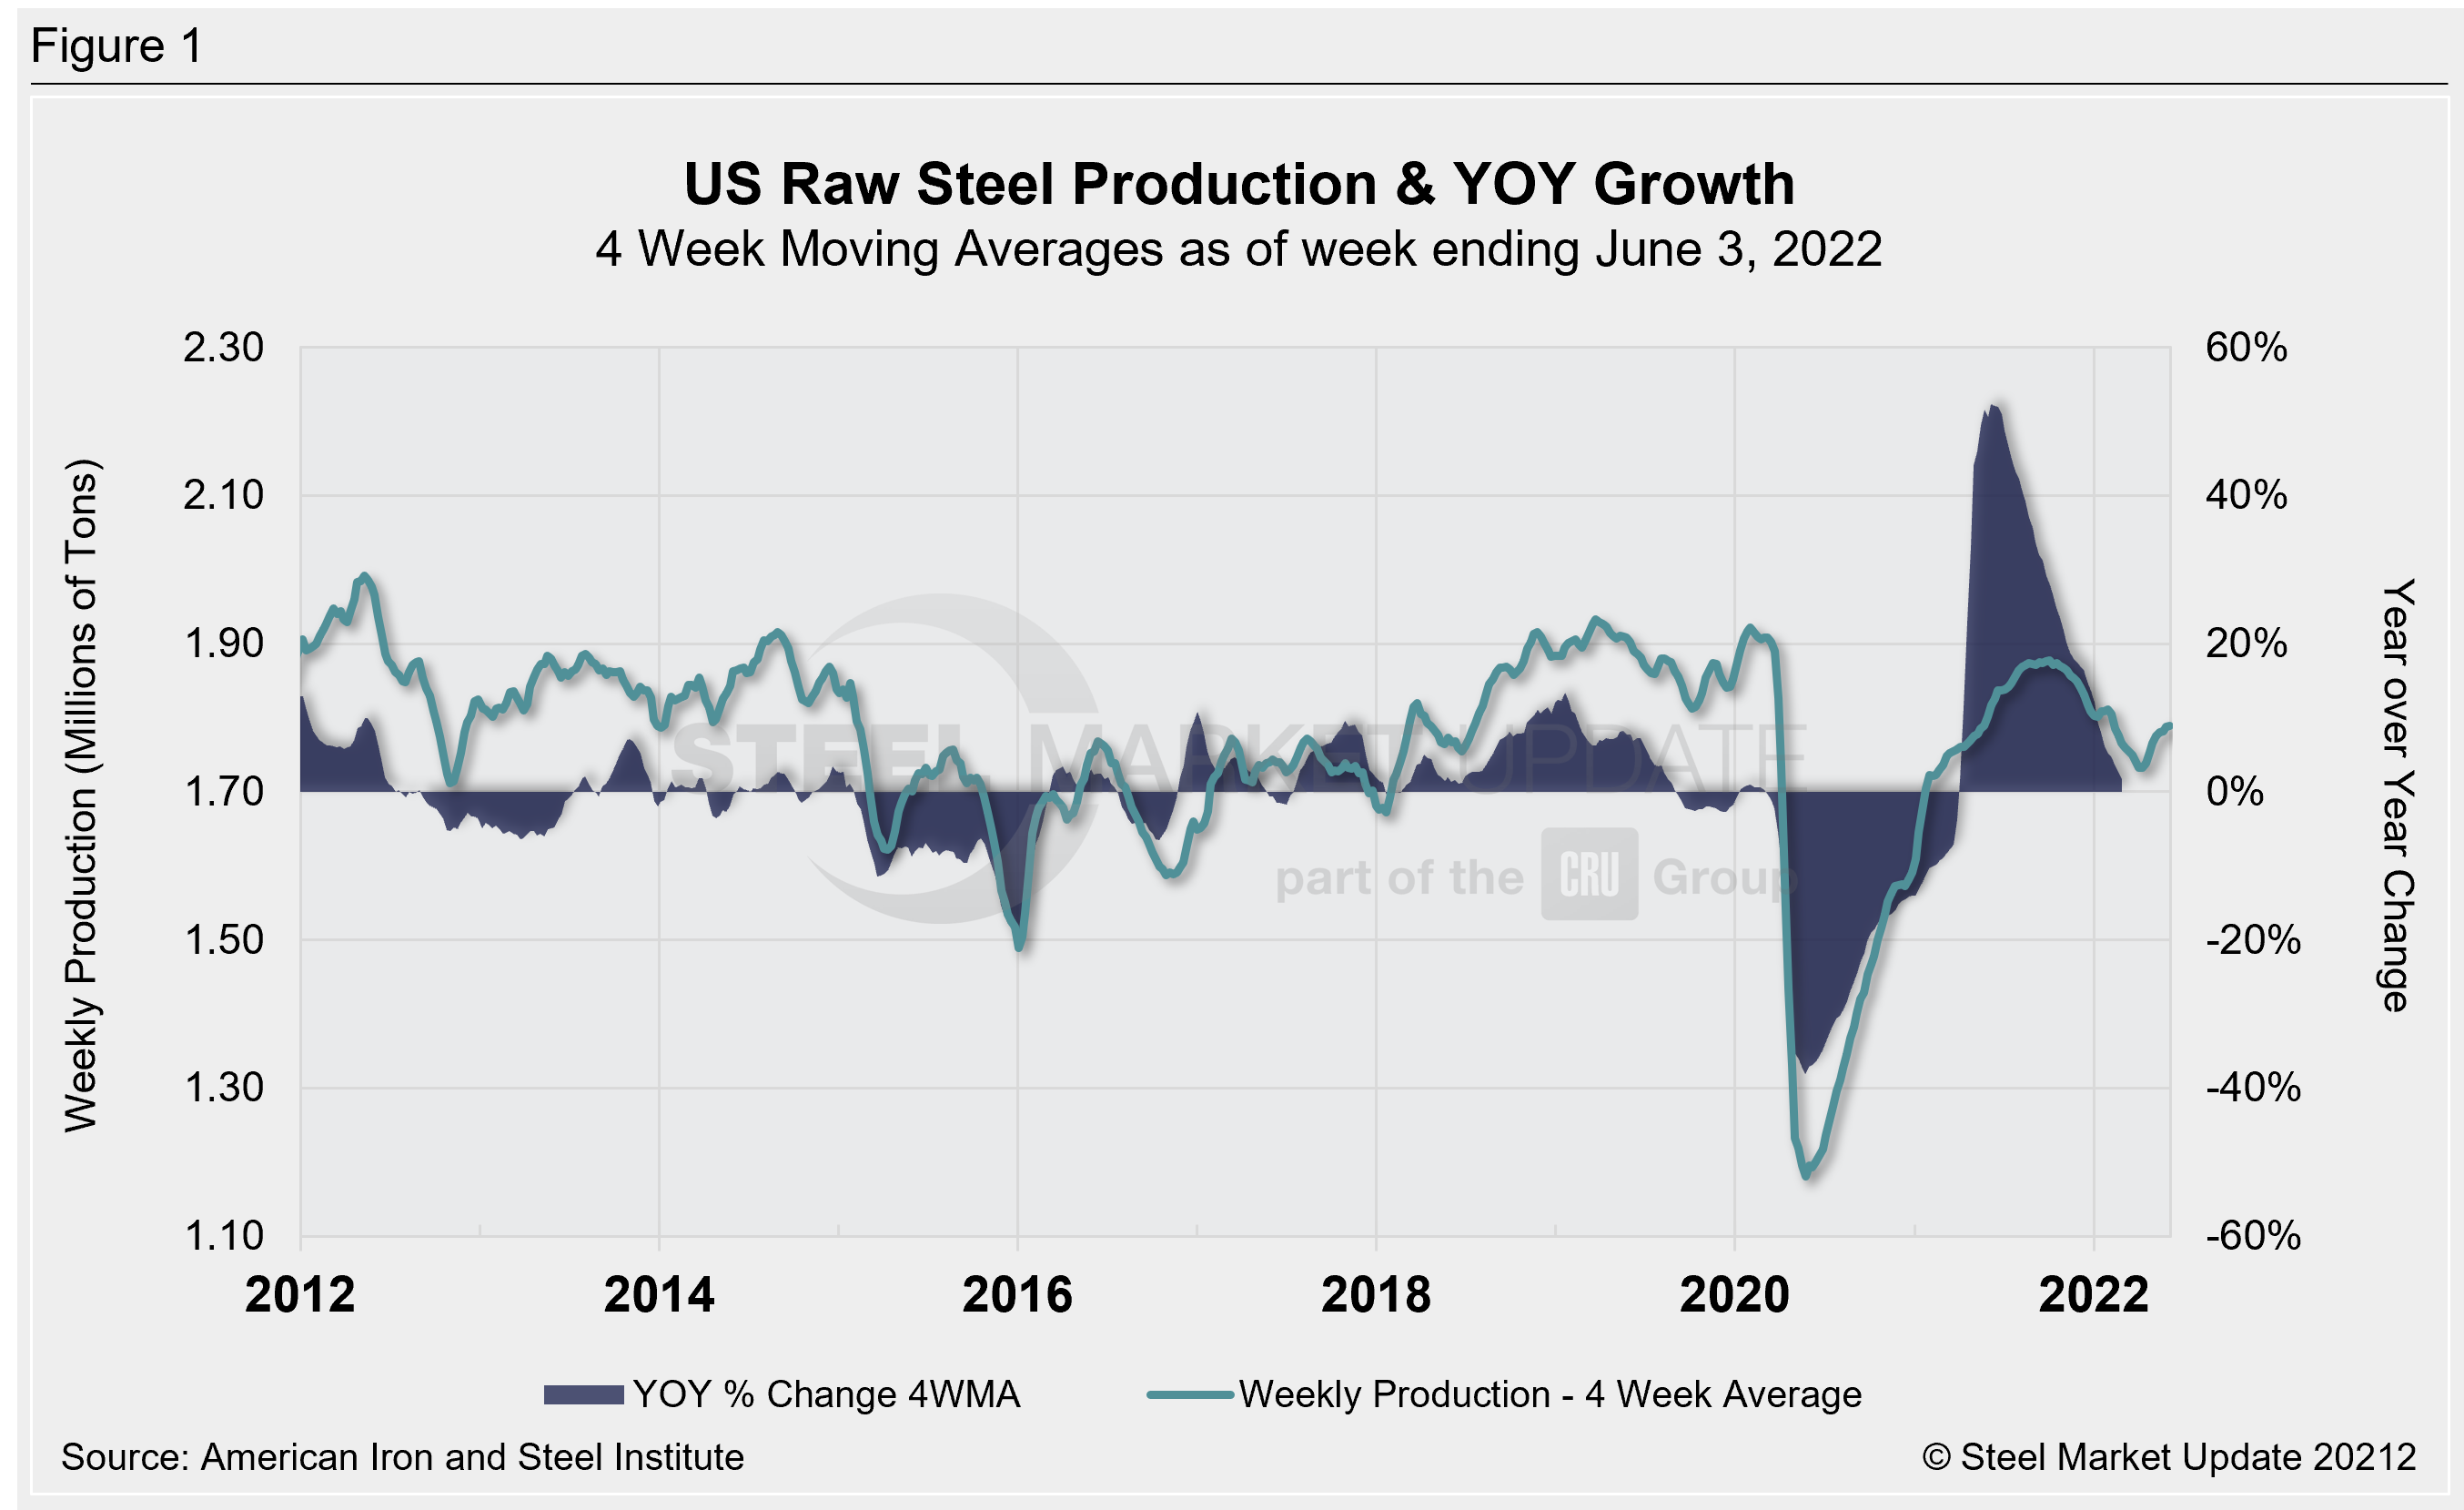
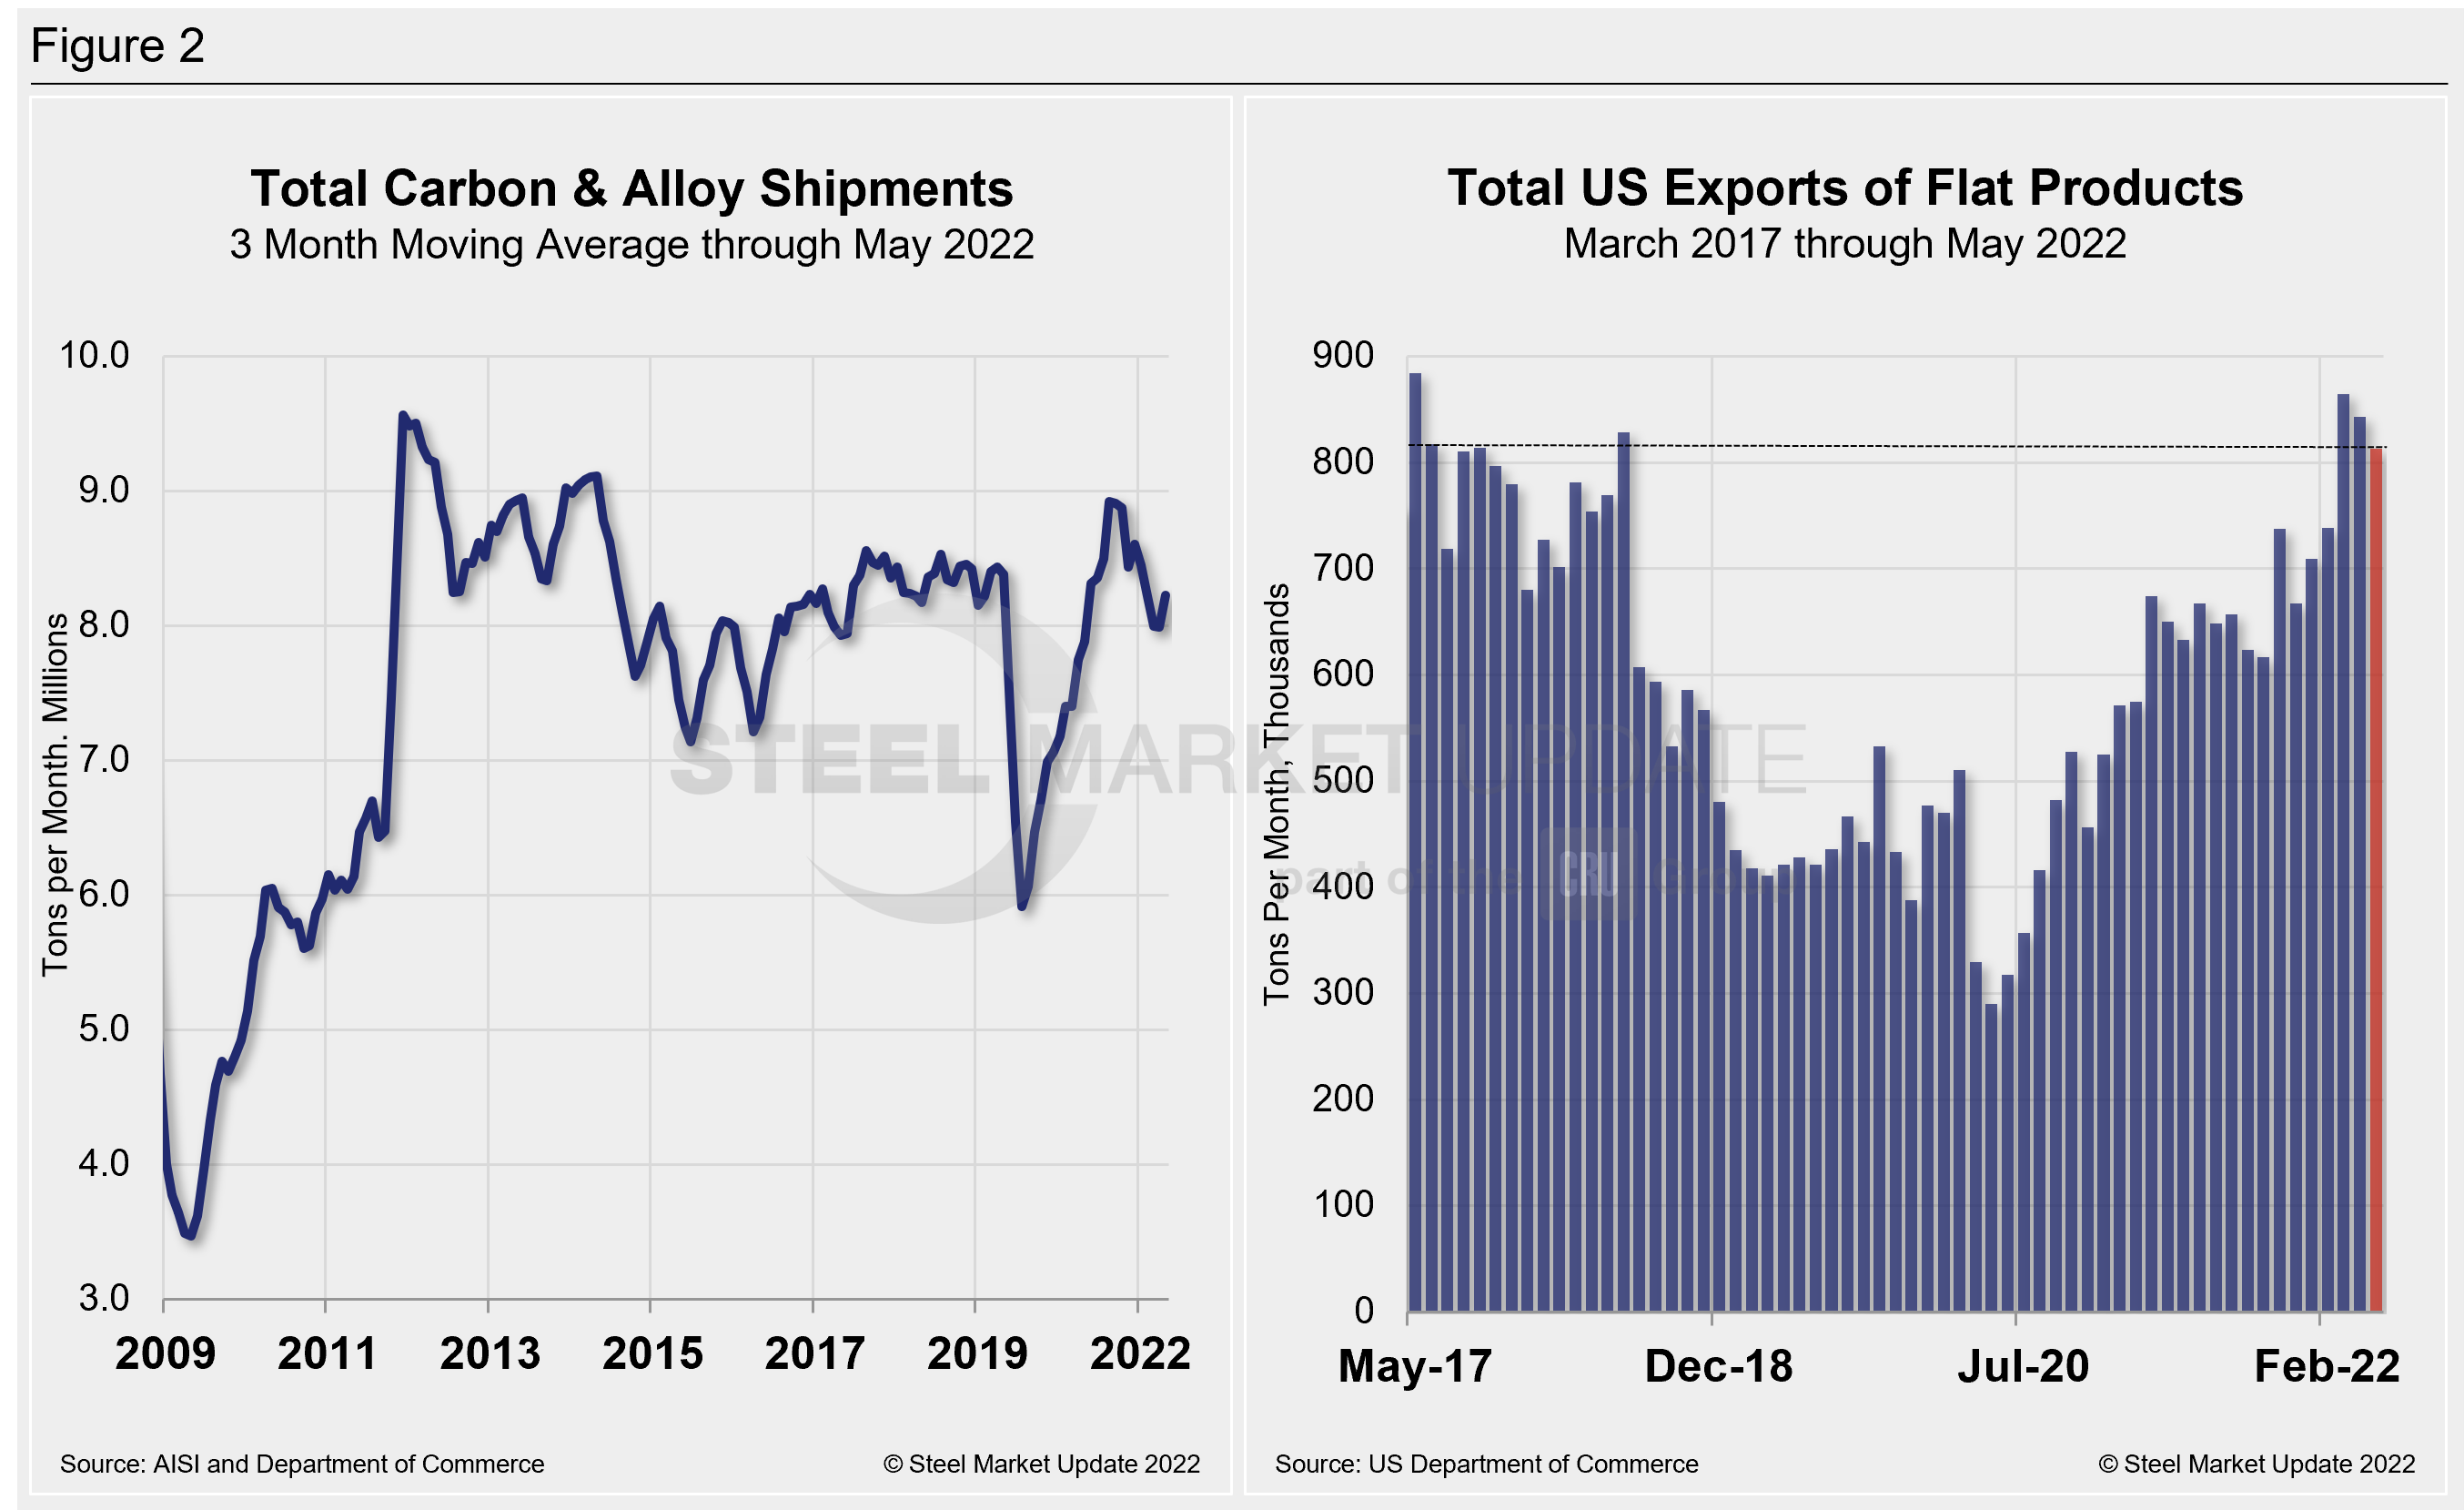
Monthly shipment data for all rolled steel products and exports are noted in Figure 2. Measured as a three-month moving average (3MMA) of the monthly data, May’s total was 8.225 million tons, up 2.9% versus 7.992 million tons in April. May marked the first increase over the past seven months for the 3MMA analysis. Shipments were down 1% in May versus the year prior when shipments were 8.311 million tons. The recovery from Covid-related shutdowns just over two years ago was meaningful. But May’s shipments fell below the same pre-pandemic period in 2019 by 3.6%.
All rolled product exports totaled 812,833 tons in May, down 3.5% MoM but 28.4% higher versus the same year-ago period. Despite the MoM decline, May’s total is the third-highest export mark since May 2017, when the US exported a total of 884,314 tons.
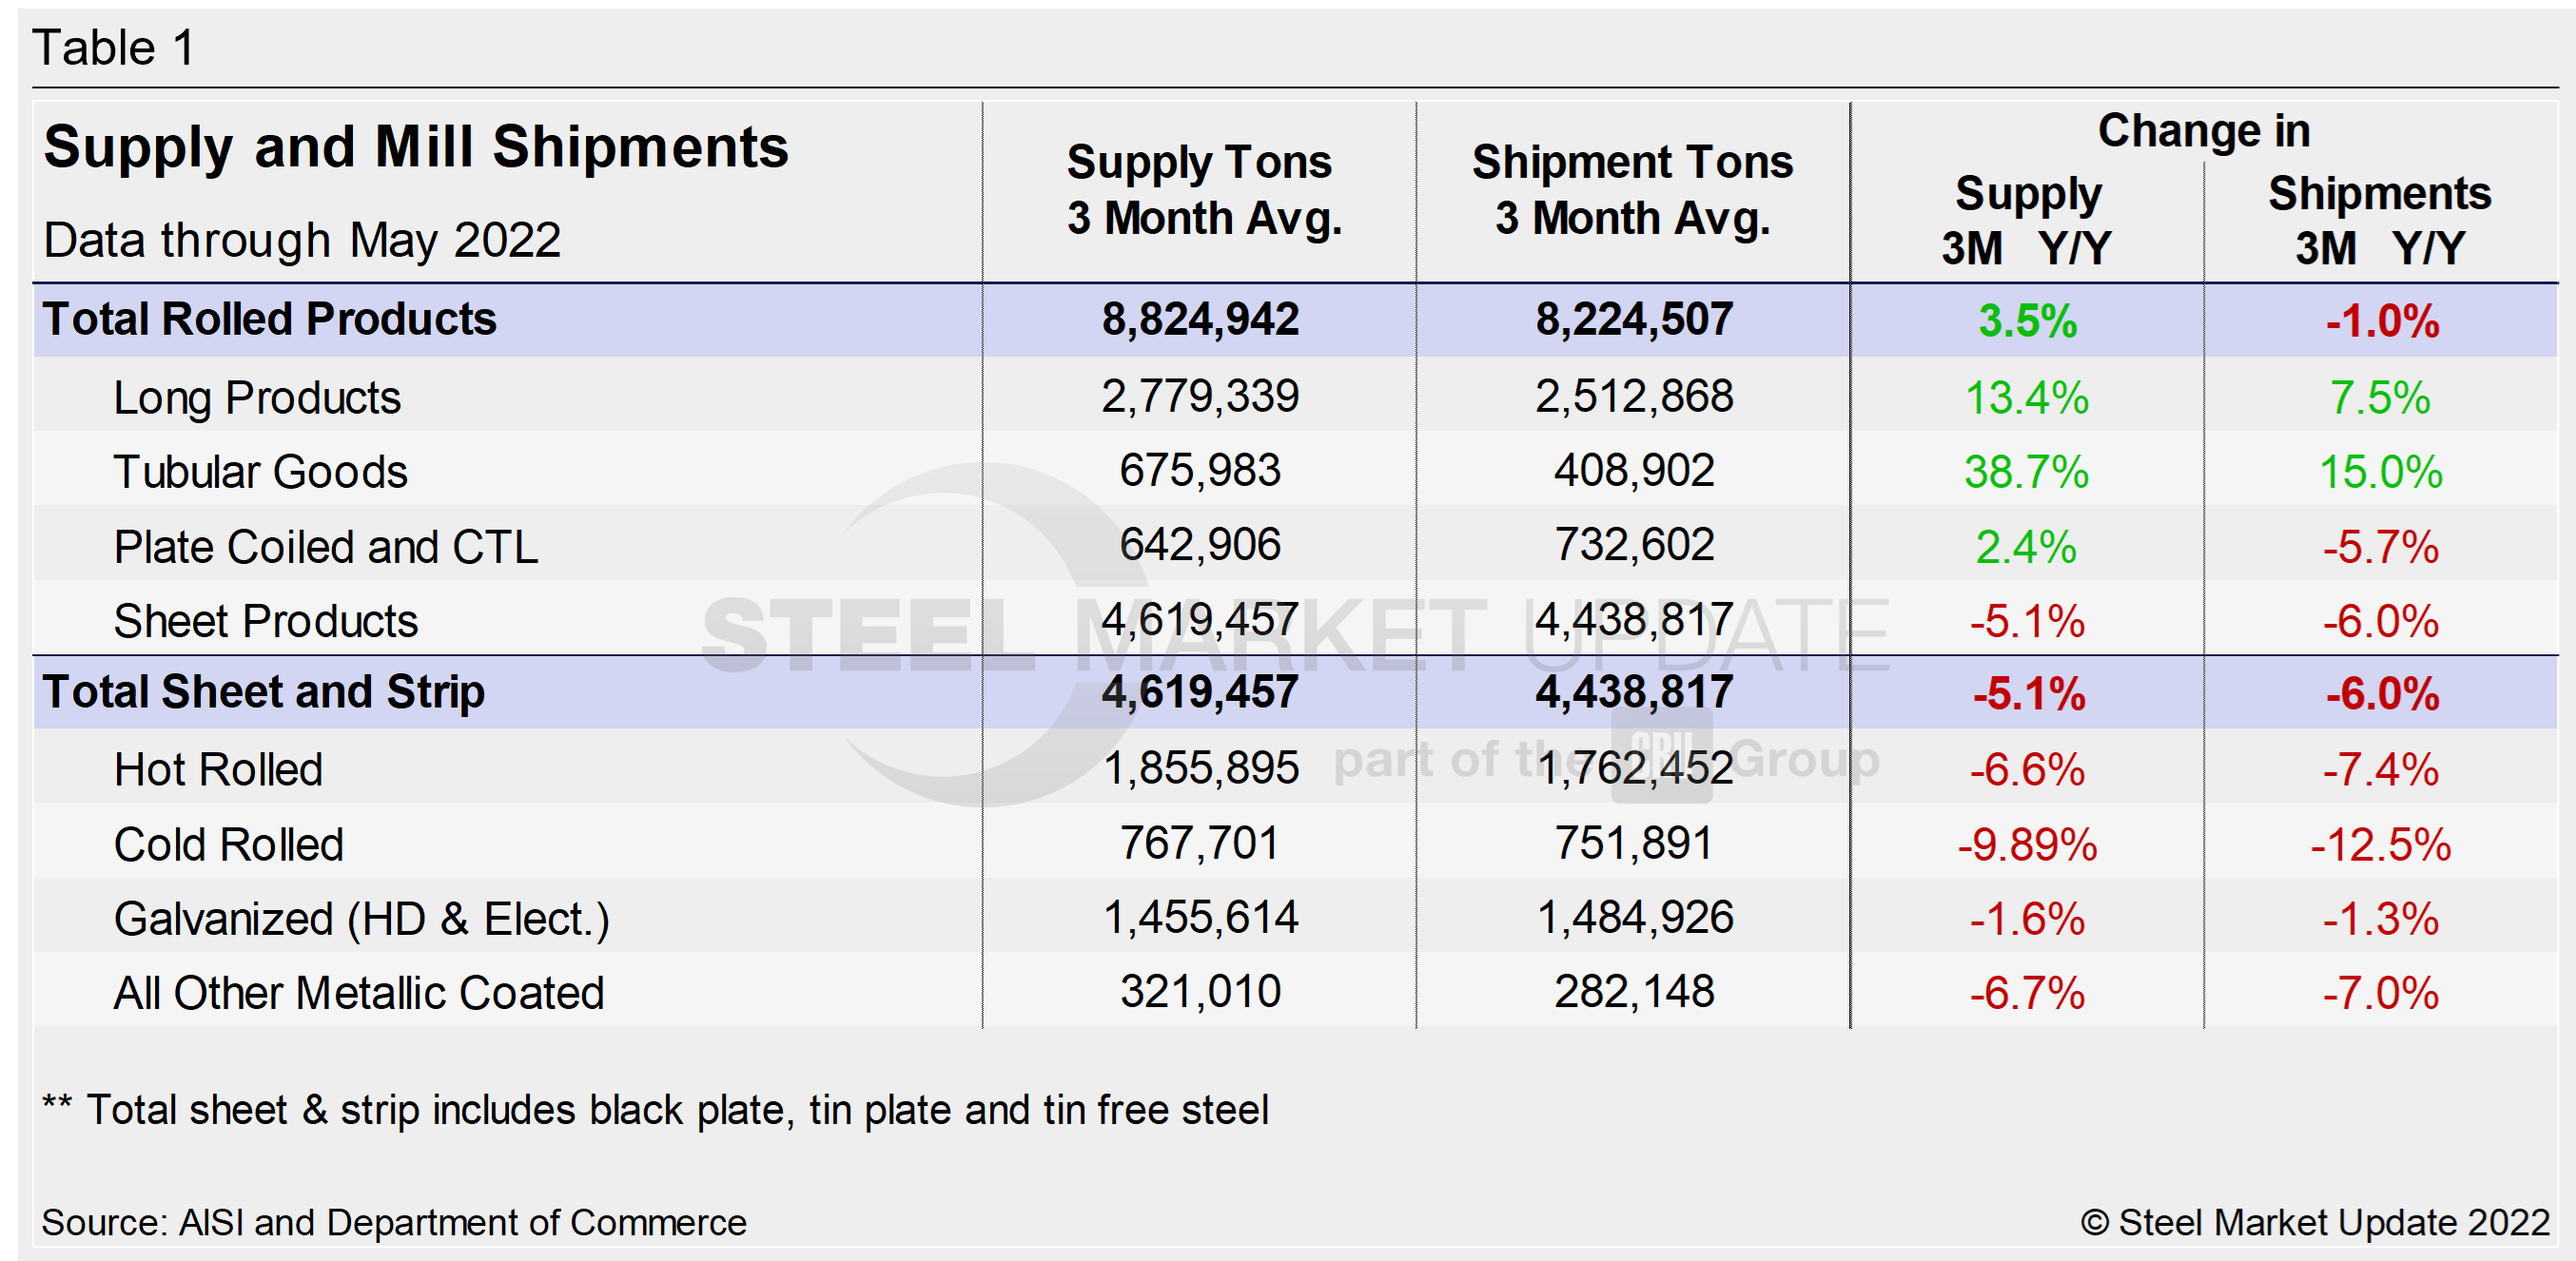
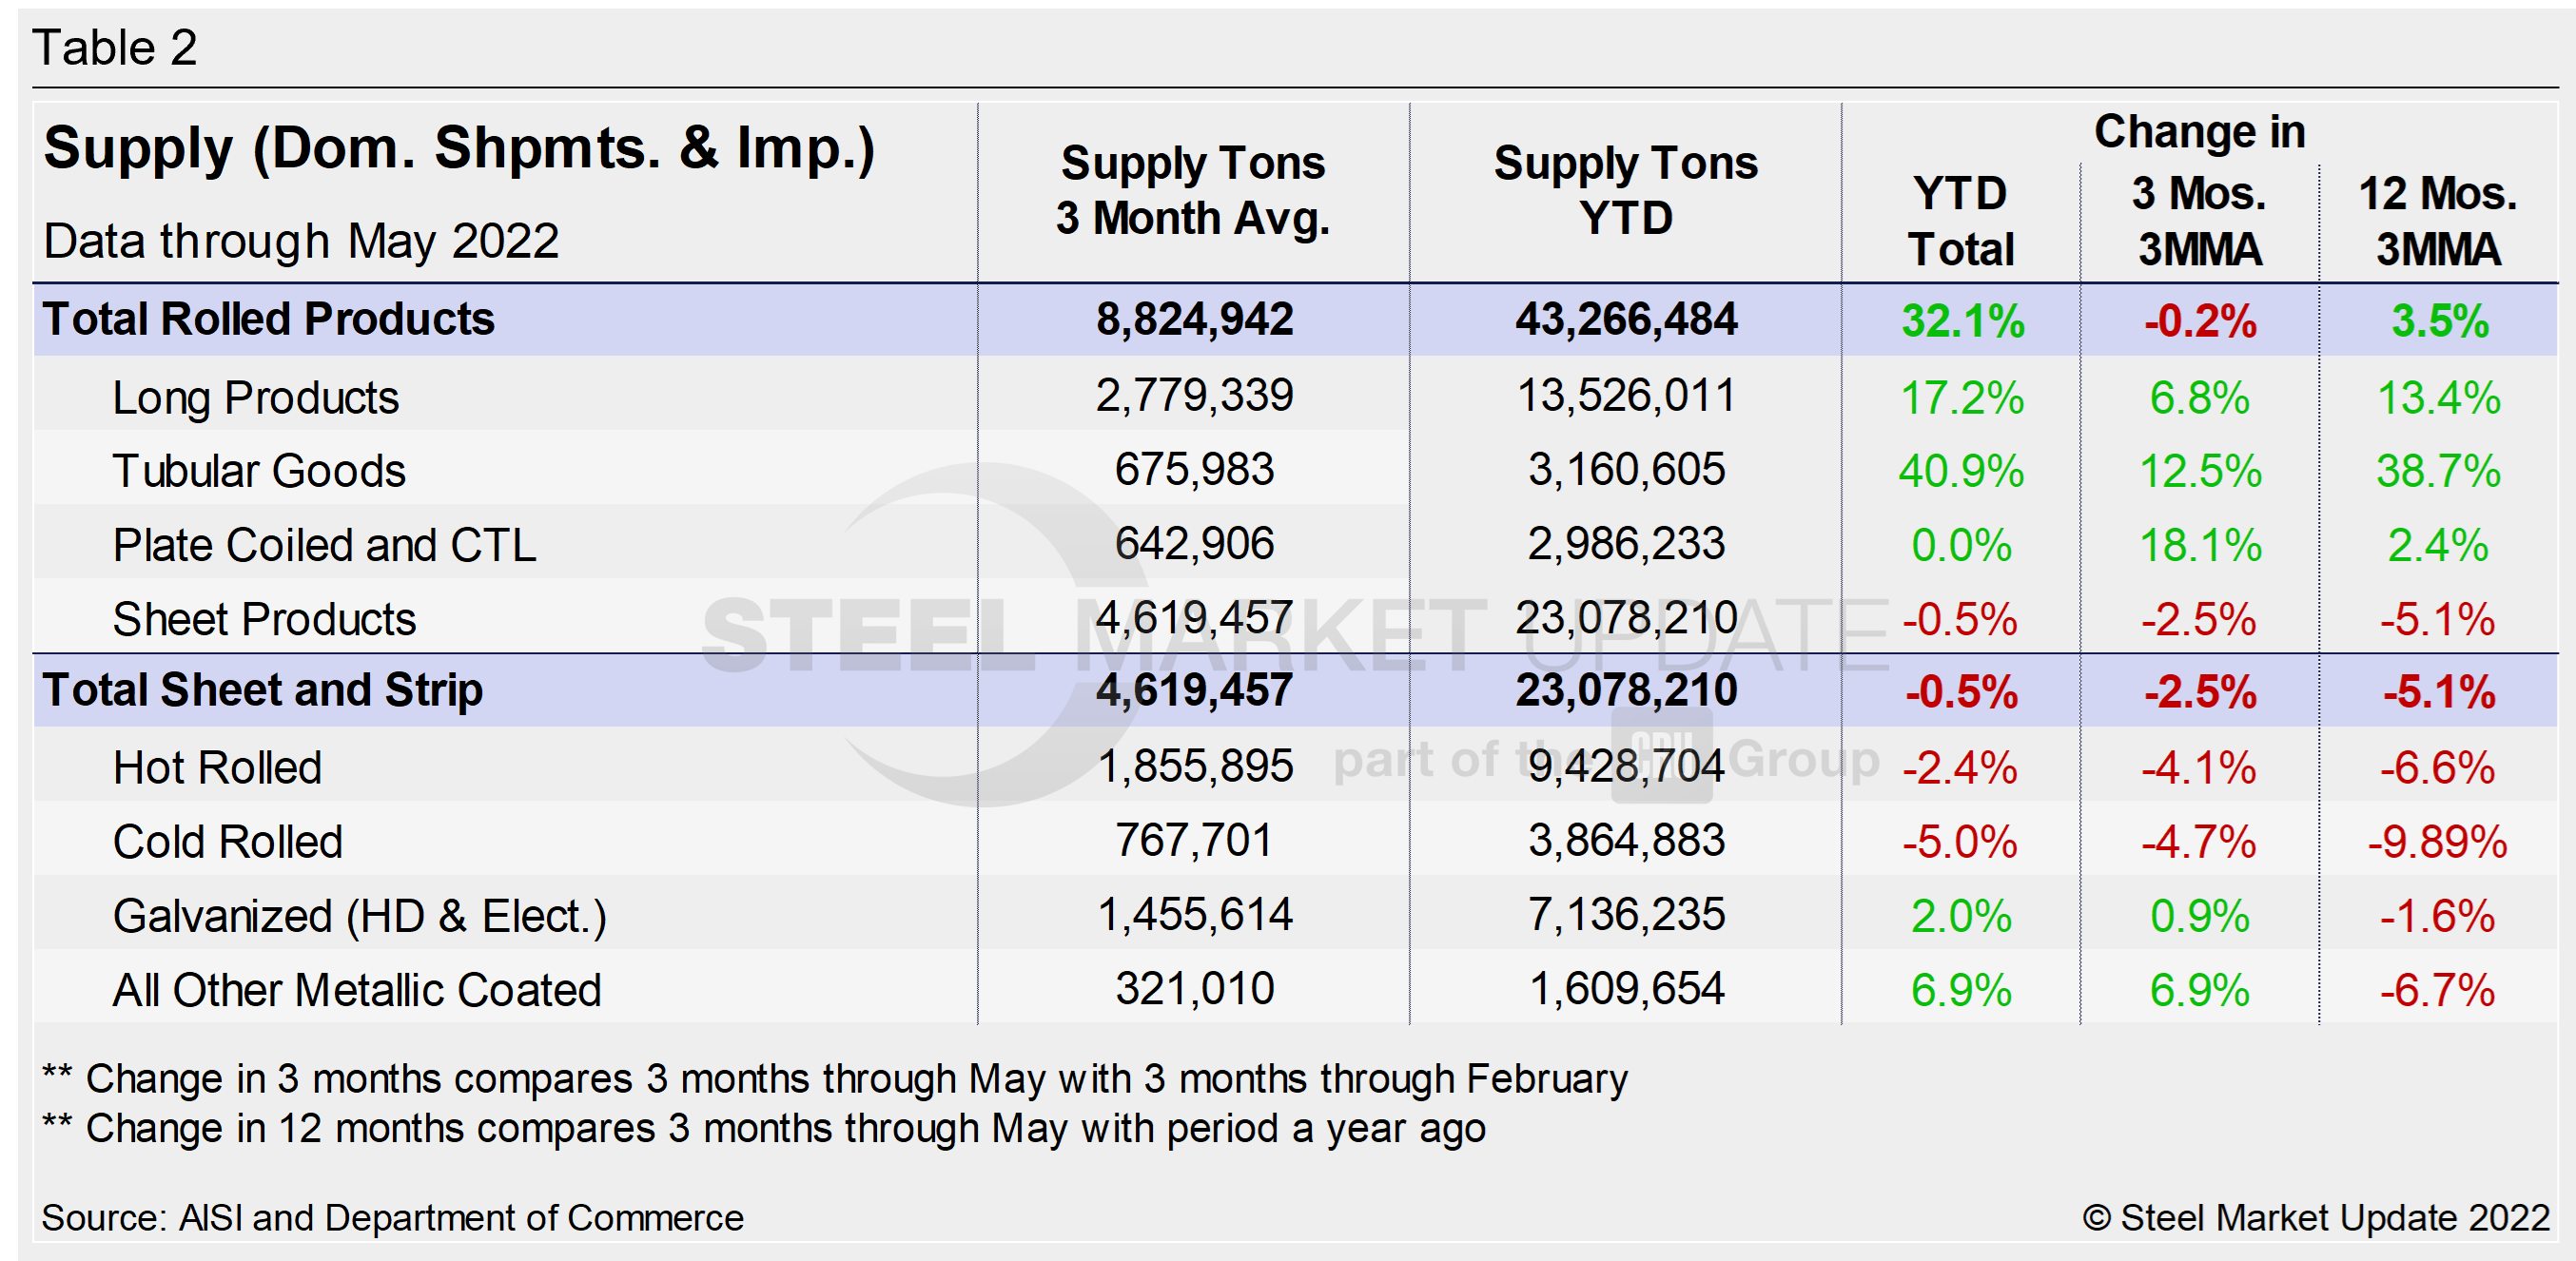
Shipment and supply details for all product groups and individual sheet products are noted in Table 1. Domestic supply (shipments and imports) is shown in Table 2. Total supply (a proxy for market demand) as a 3MMA was up year-on-year (YoY) in May, but well behind of the 21% growth seen the year prior – when the market was recovering ground lost during the early pandemic-related disruptions.
Apparent supply is defined as domestic mill shipments to domestic locations plus imports. Mill shipments were down 1% and a far cry from the 27.1% growth seen during the year-ago period in the same 3MMA comparison. The recovery has varied significantly among various products. But it should remain relatively unchanged due to steady domestic output, even as foreign material continues to trickle into US ports at current or similar rates.
Total sheet and strip apparent supply is down year to date (Table 2) compared to 2021. It is down 2.5% over the past three months, and approximately one percentage point lower MoM. Total rolled product apparent supply is up over the same year-ago period but is trending down on a three-month moving average basis. Note that year-over-year comparisons have seasonality removed.
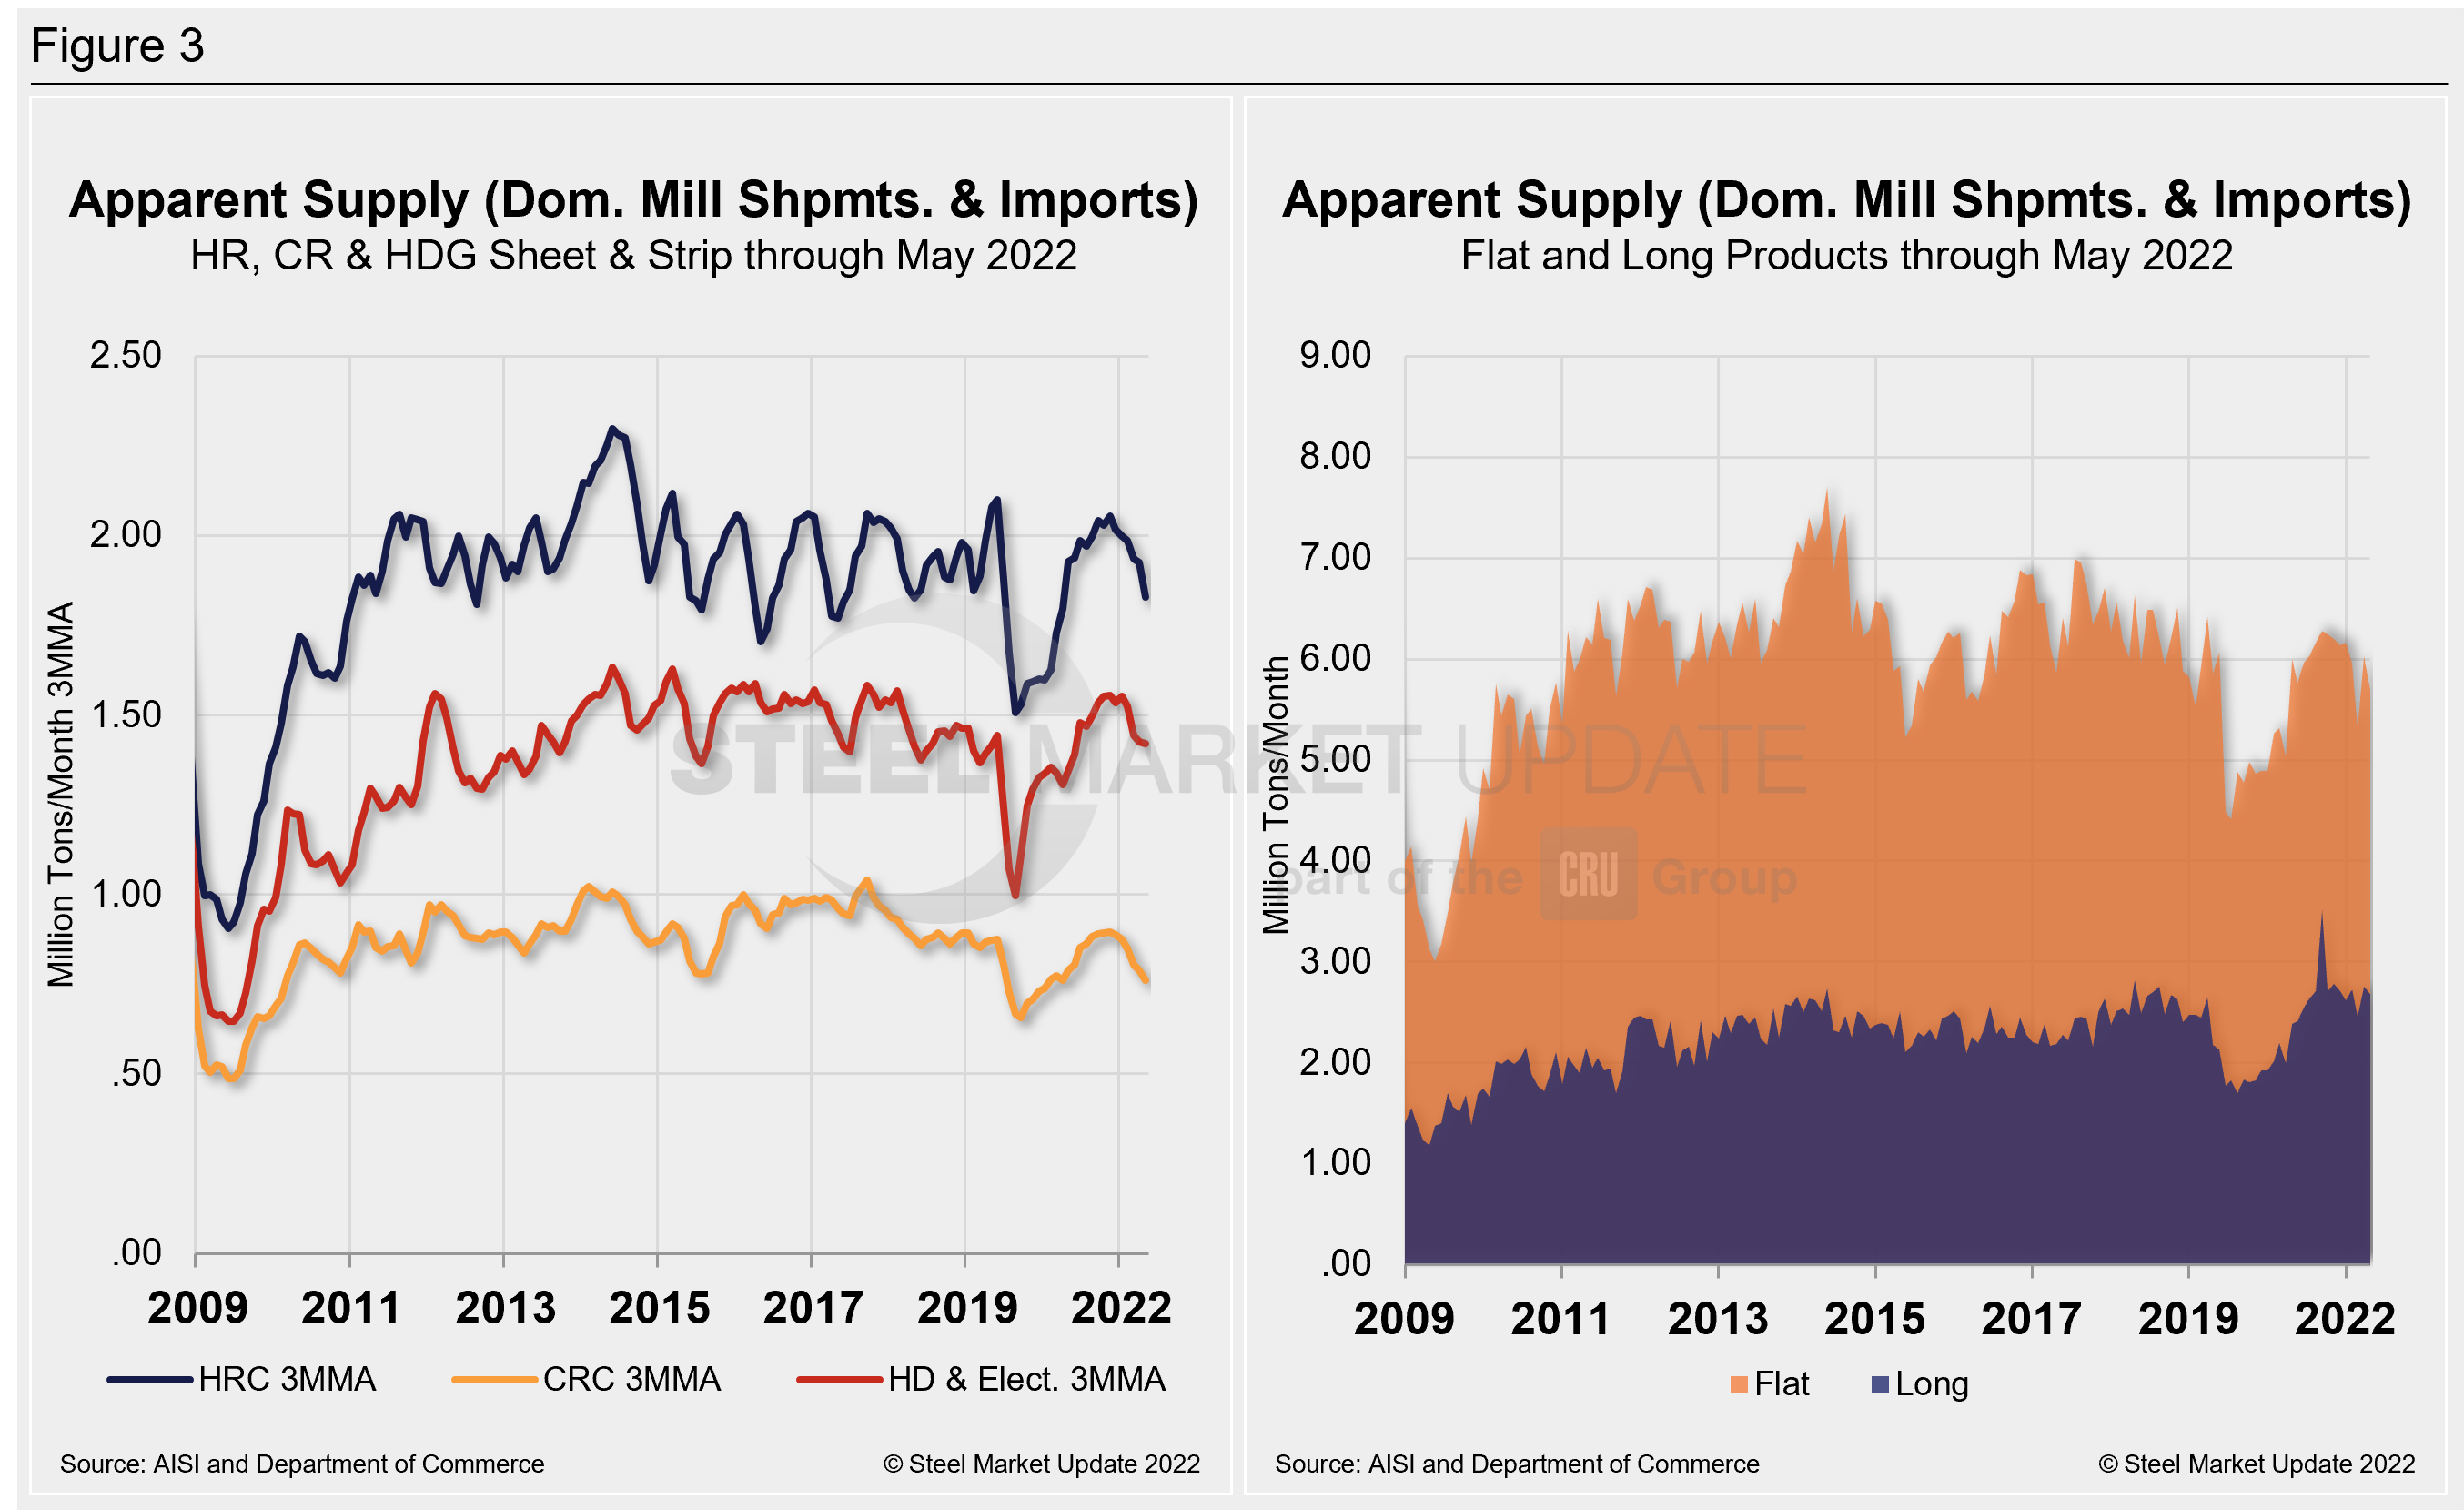
The supply picture for HRC, CRC, and HDG since January 2009 as three-month moving averages versus the long-term comparison between flat and long products is shown side-by-side in Figure 3. On the left chart, all three sheet products are displayed. They had experienced some improvement since mid-2020 but have now been trending down of late. When compared to the same pre-pandemic period in 2019, cold rolled and hot rolled are down. Supplies of cold rolled have seen the largest percentage decline (-12.8), followed by hot rolled (-4.4%). Galvanized (hot dipped and electrolytic) is up 2.5% from the same pre-pandemic period in 2019. In the right chart, note that these are monthly numbers (not 3MMAs), which show the trend difference between longs and flat products including plate.
By David Schollaert, David@SteelMarketUpdate.com


