

Market Data

August 5, 2022
SMU Steel Buyers Sentiment Index Unexpectedly Bounces Back
Written by Brett Linton
Steel Market Update’s Steel Buyers Sentiment Index bounced back from its mid-July dip and is now at the highest level since early June. Our Future Sentiment Index also significantly recovered compared to our previous survey and is now at an eight-week high.
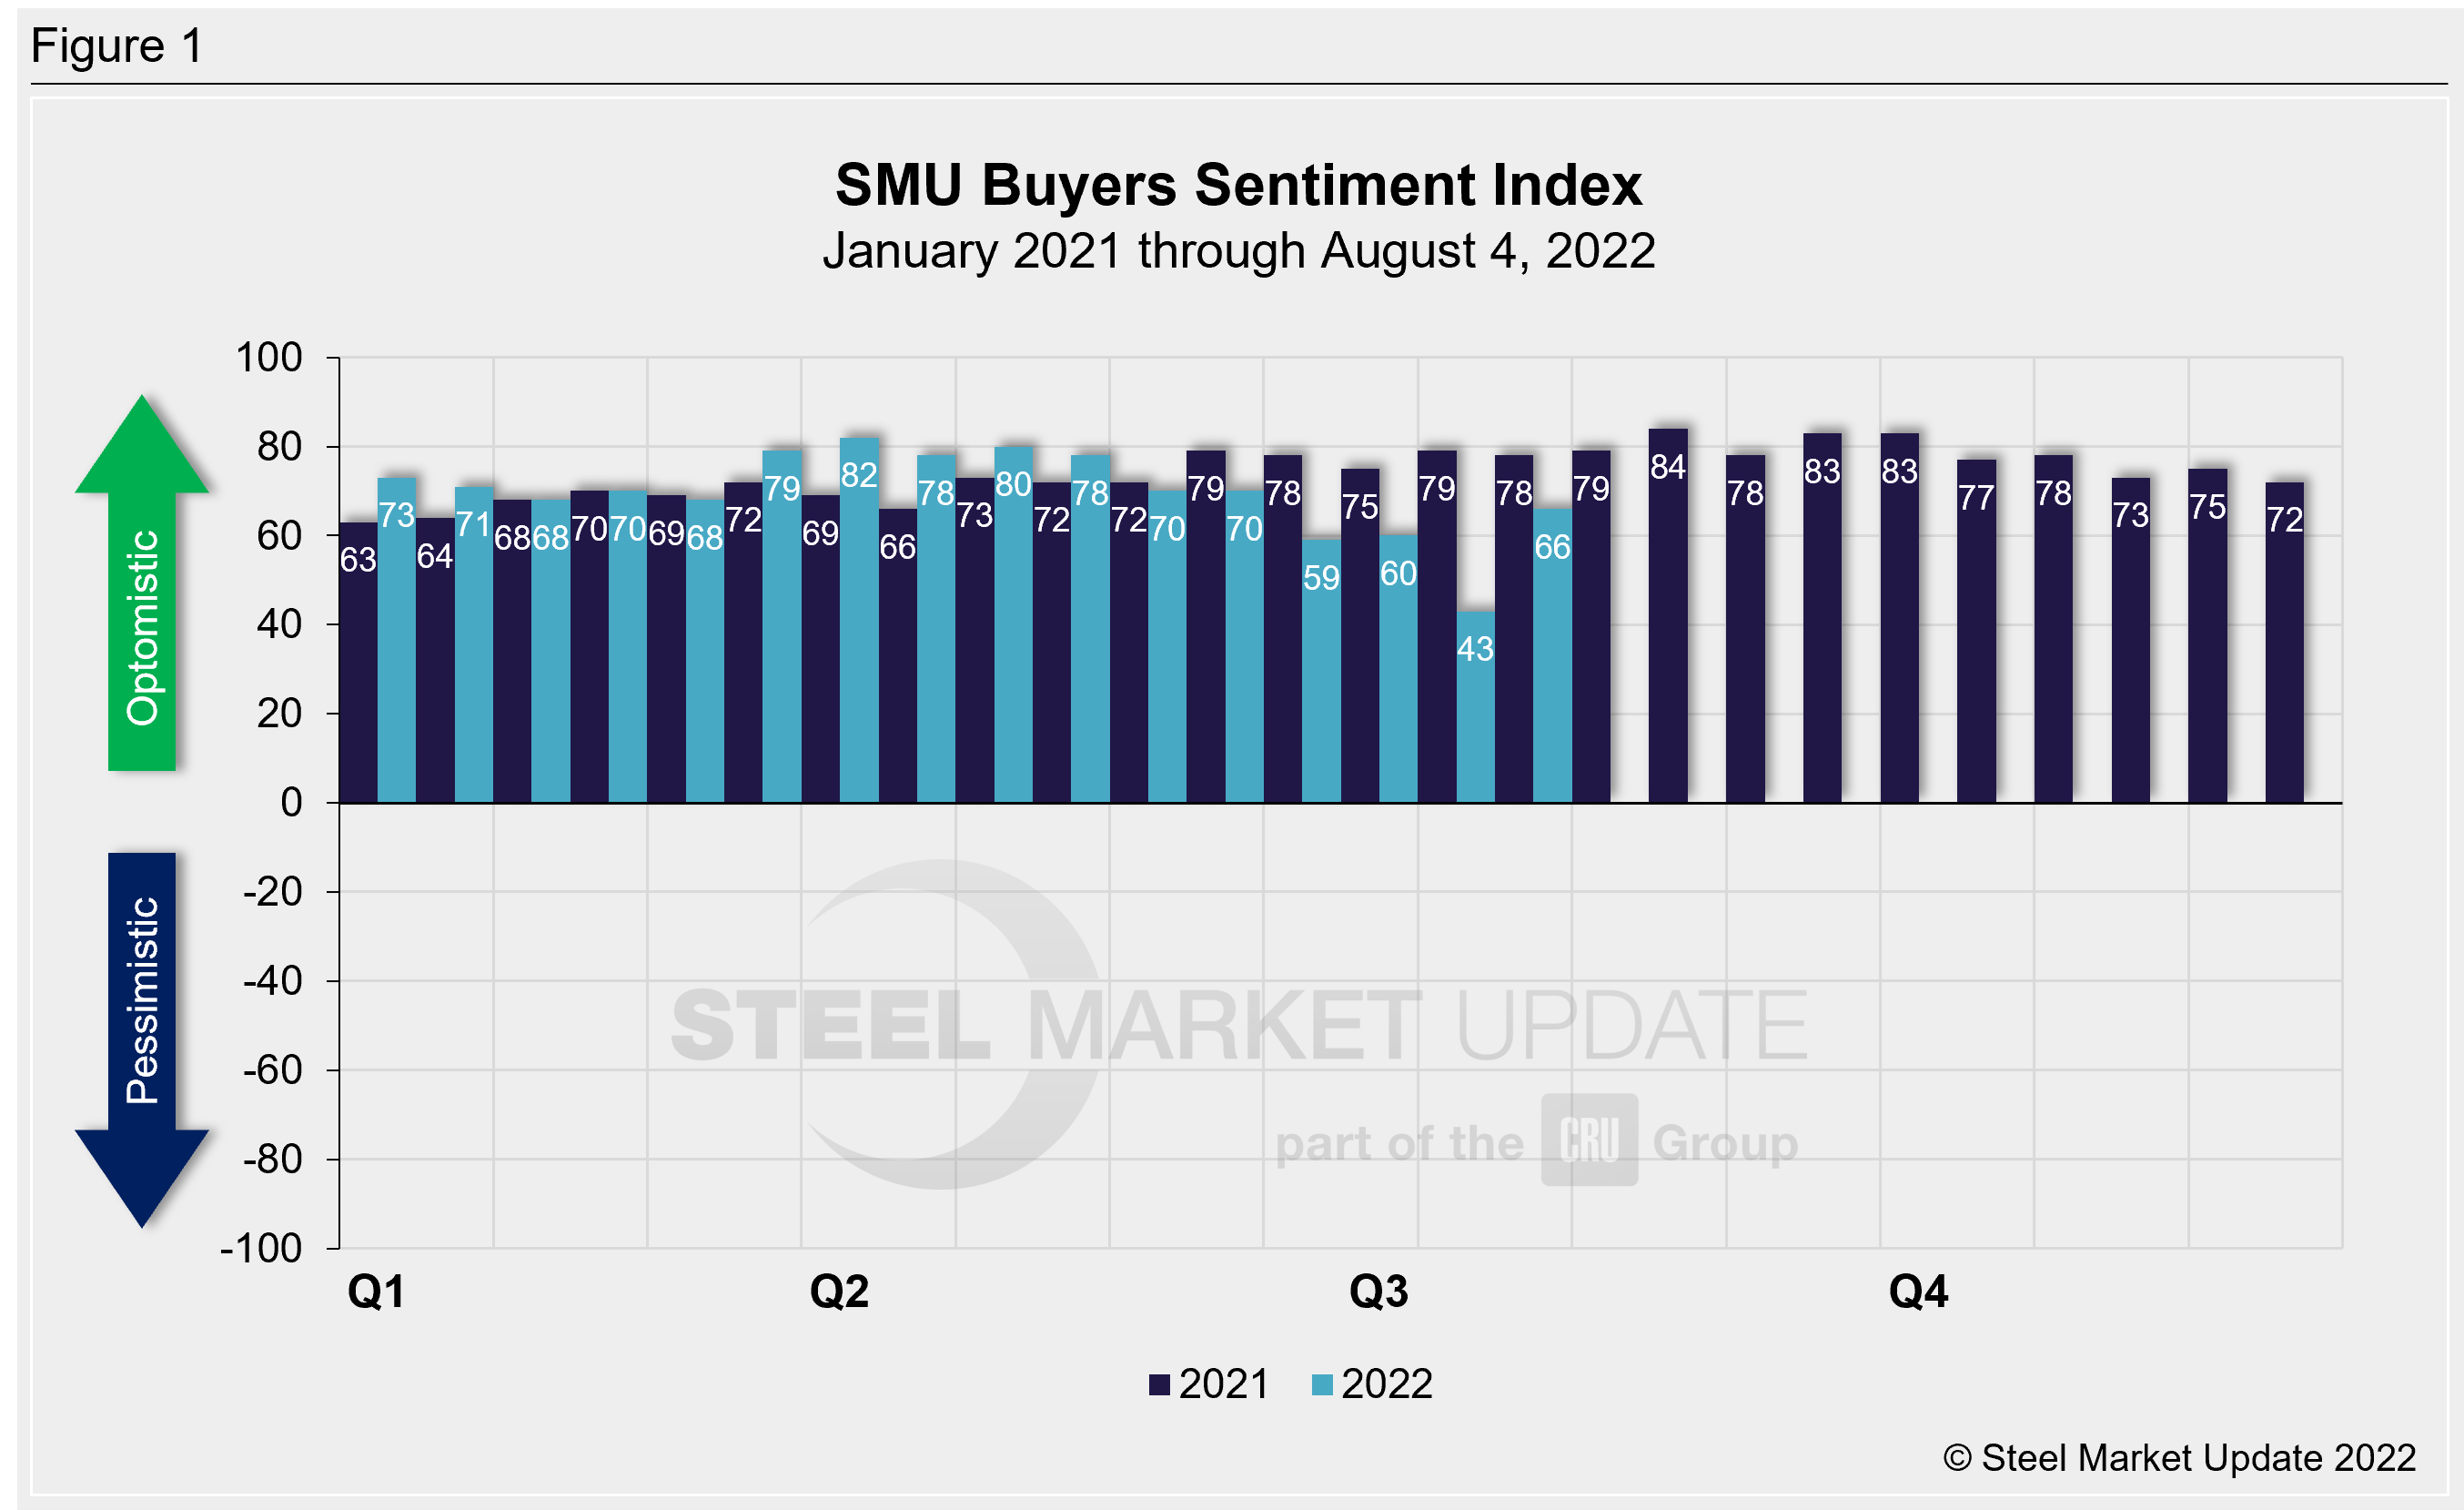
SMU surveys steel buyers every other week, asking how they view their chances of success in the market today and also a few months down the road. SMU’s Buyers Sentiment Index registered +66 this week, surging 23 points from two weeks prior and up six points from one month ago (Figure 1). In mid-July, Sentiment declined by 17 points to +43. It had not been that low since August 2020. Our Buyers Sentiment Index peaked at +82 in late March.
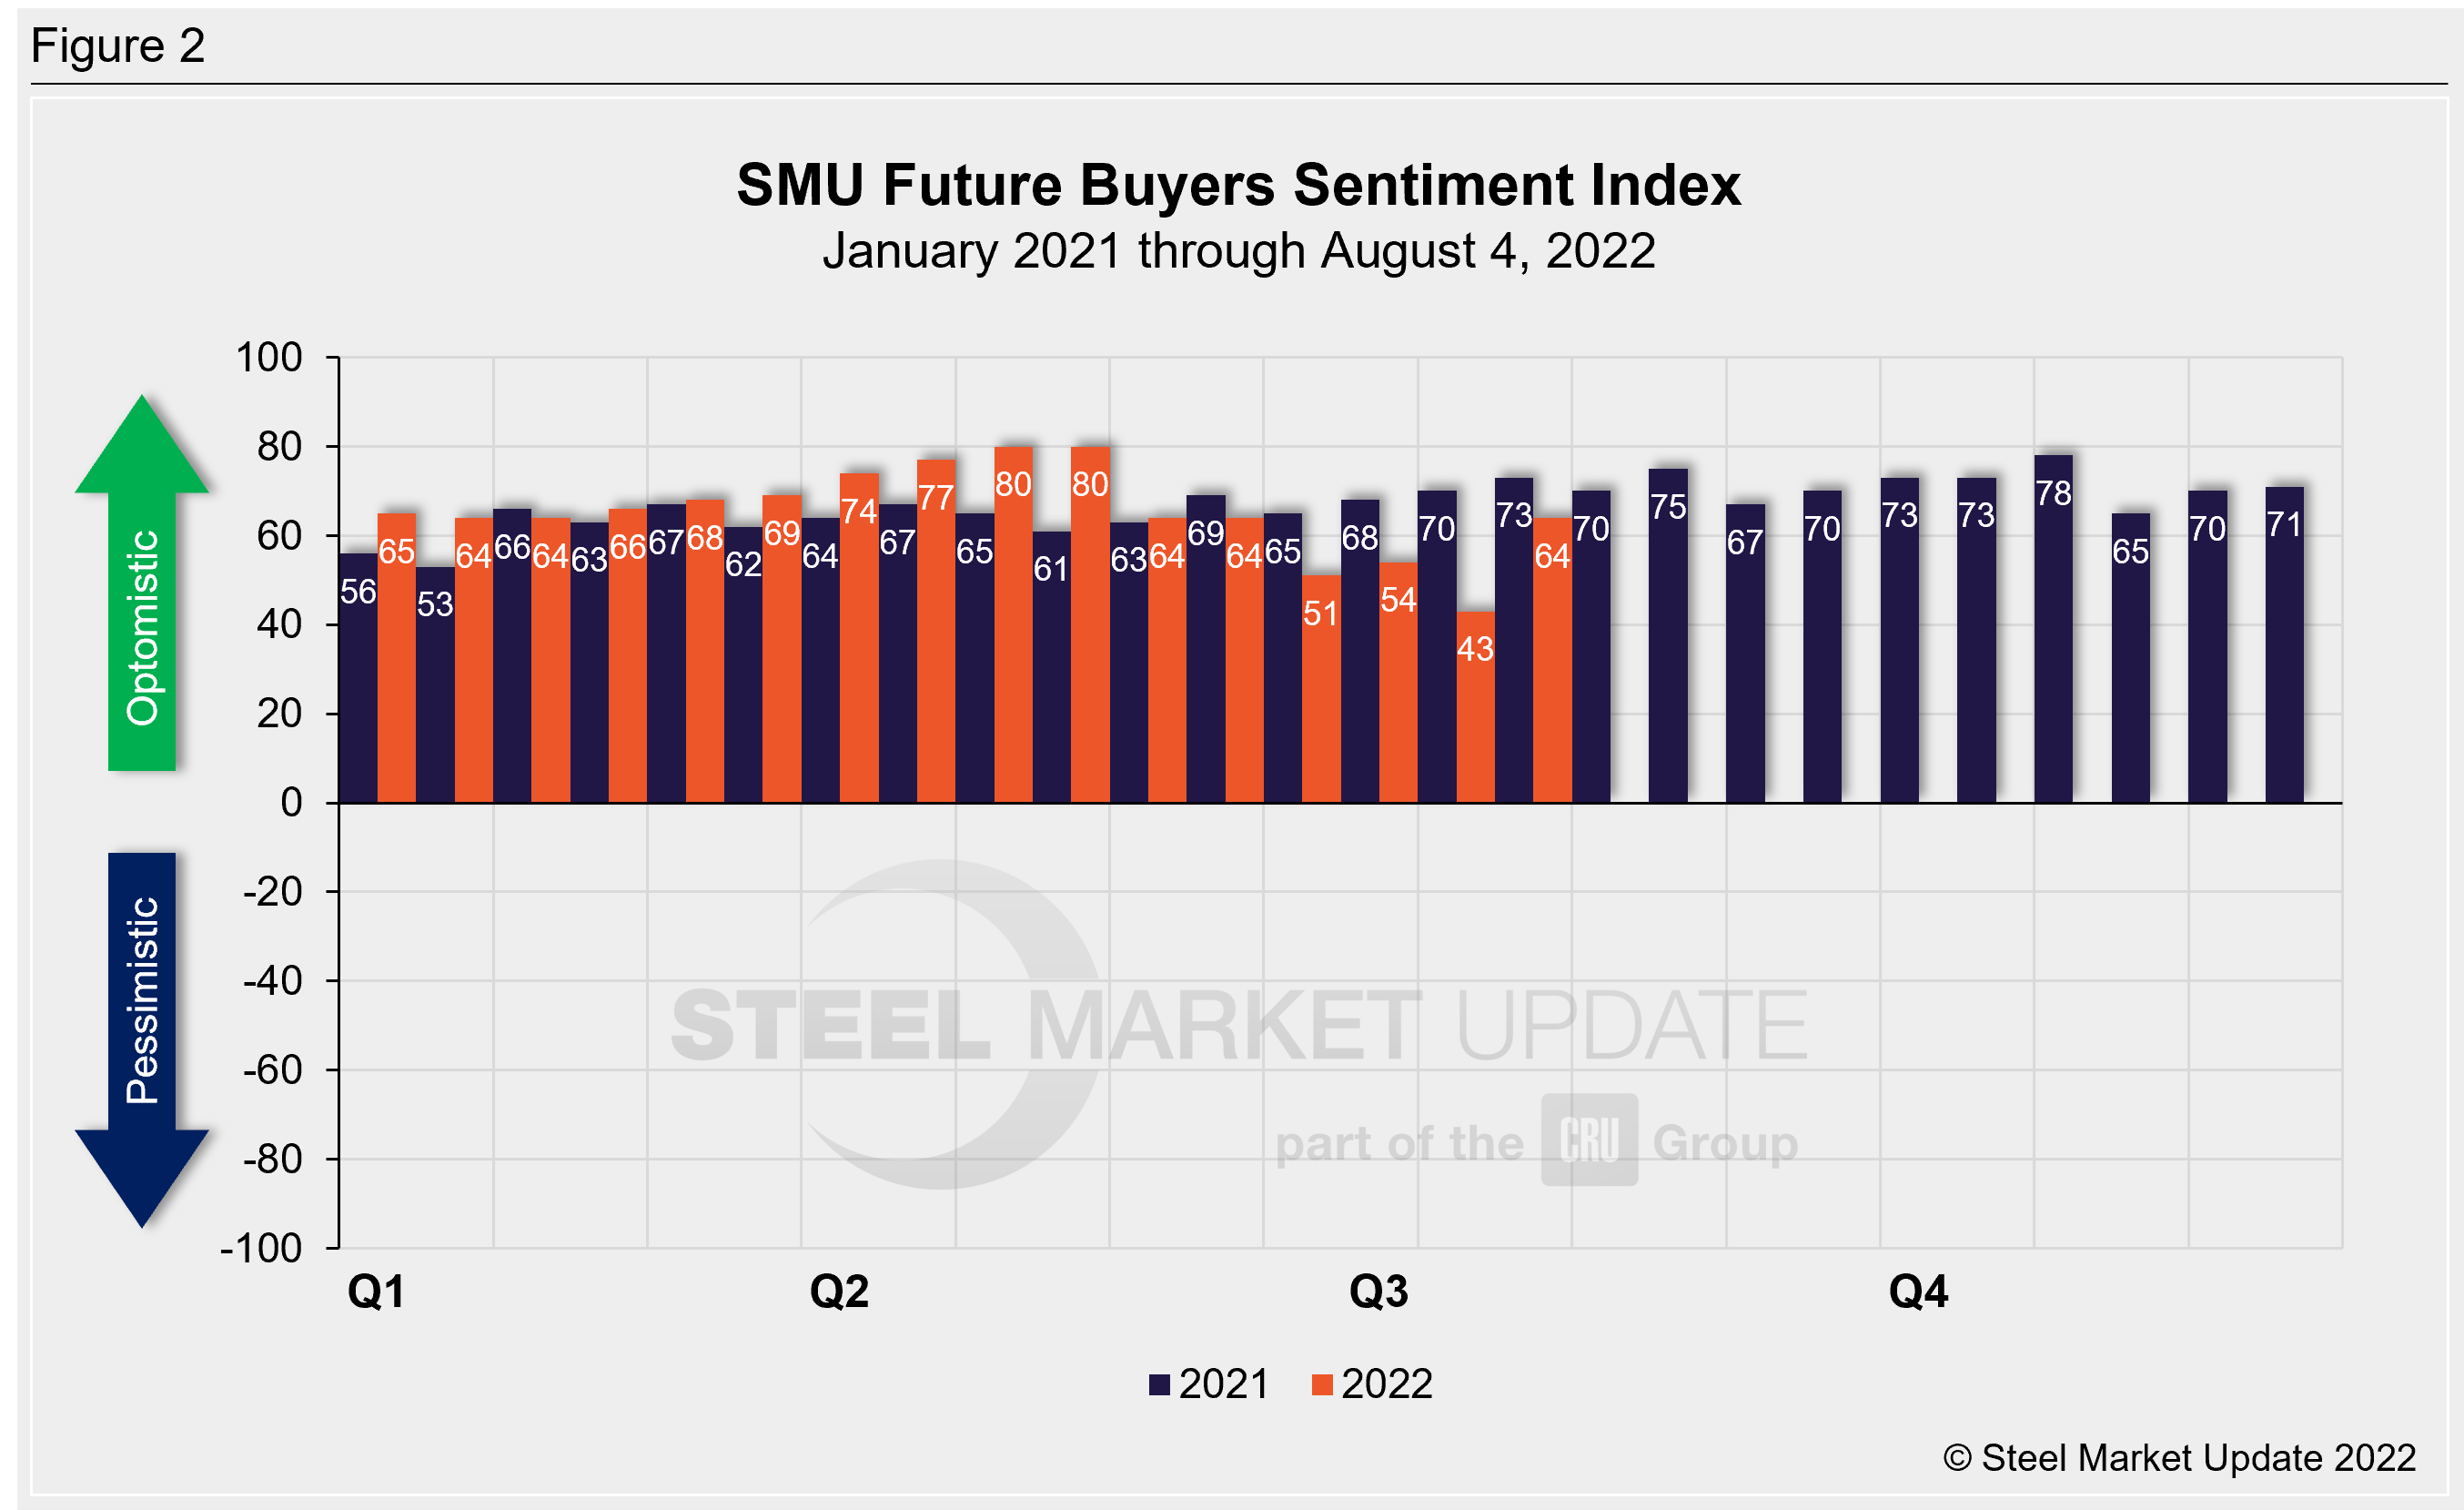
SMU’s Future Buyers Sentiment Index, which measures buyers’ feelings about business conditions three to six months in the future, recovered by 21 points from our previous survey and now stands at +64 (Figure 2). In mid-July our Future Sentiment Index had fallen to +43, a nearly two-year low. Earlier this year we saw the highest Future Sentiment readings recorded in our 13.5-year history. Late April and early May both registered +80.
Recall that as steel prices peaked last September, Current Sentiment reached an all-time high of +84, while Future Sentiment peaked two months later at +78. The lowest levels over the past decade both occurred in April 2020, at -8 and +10 respectively.
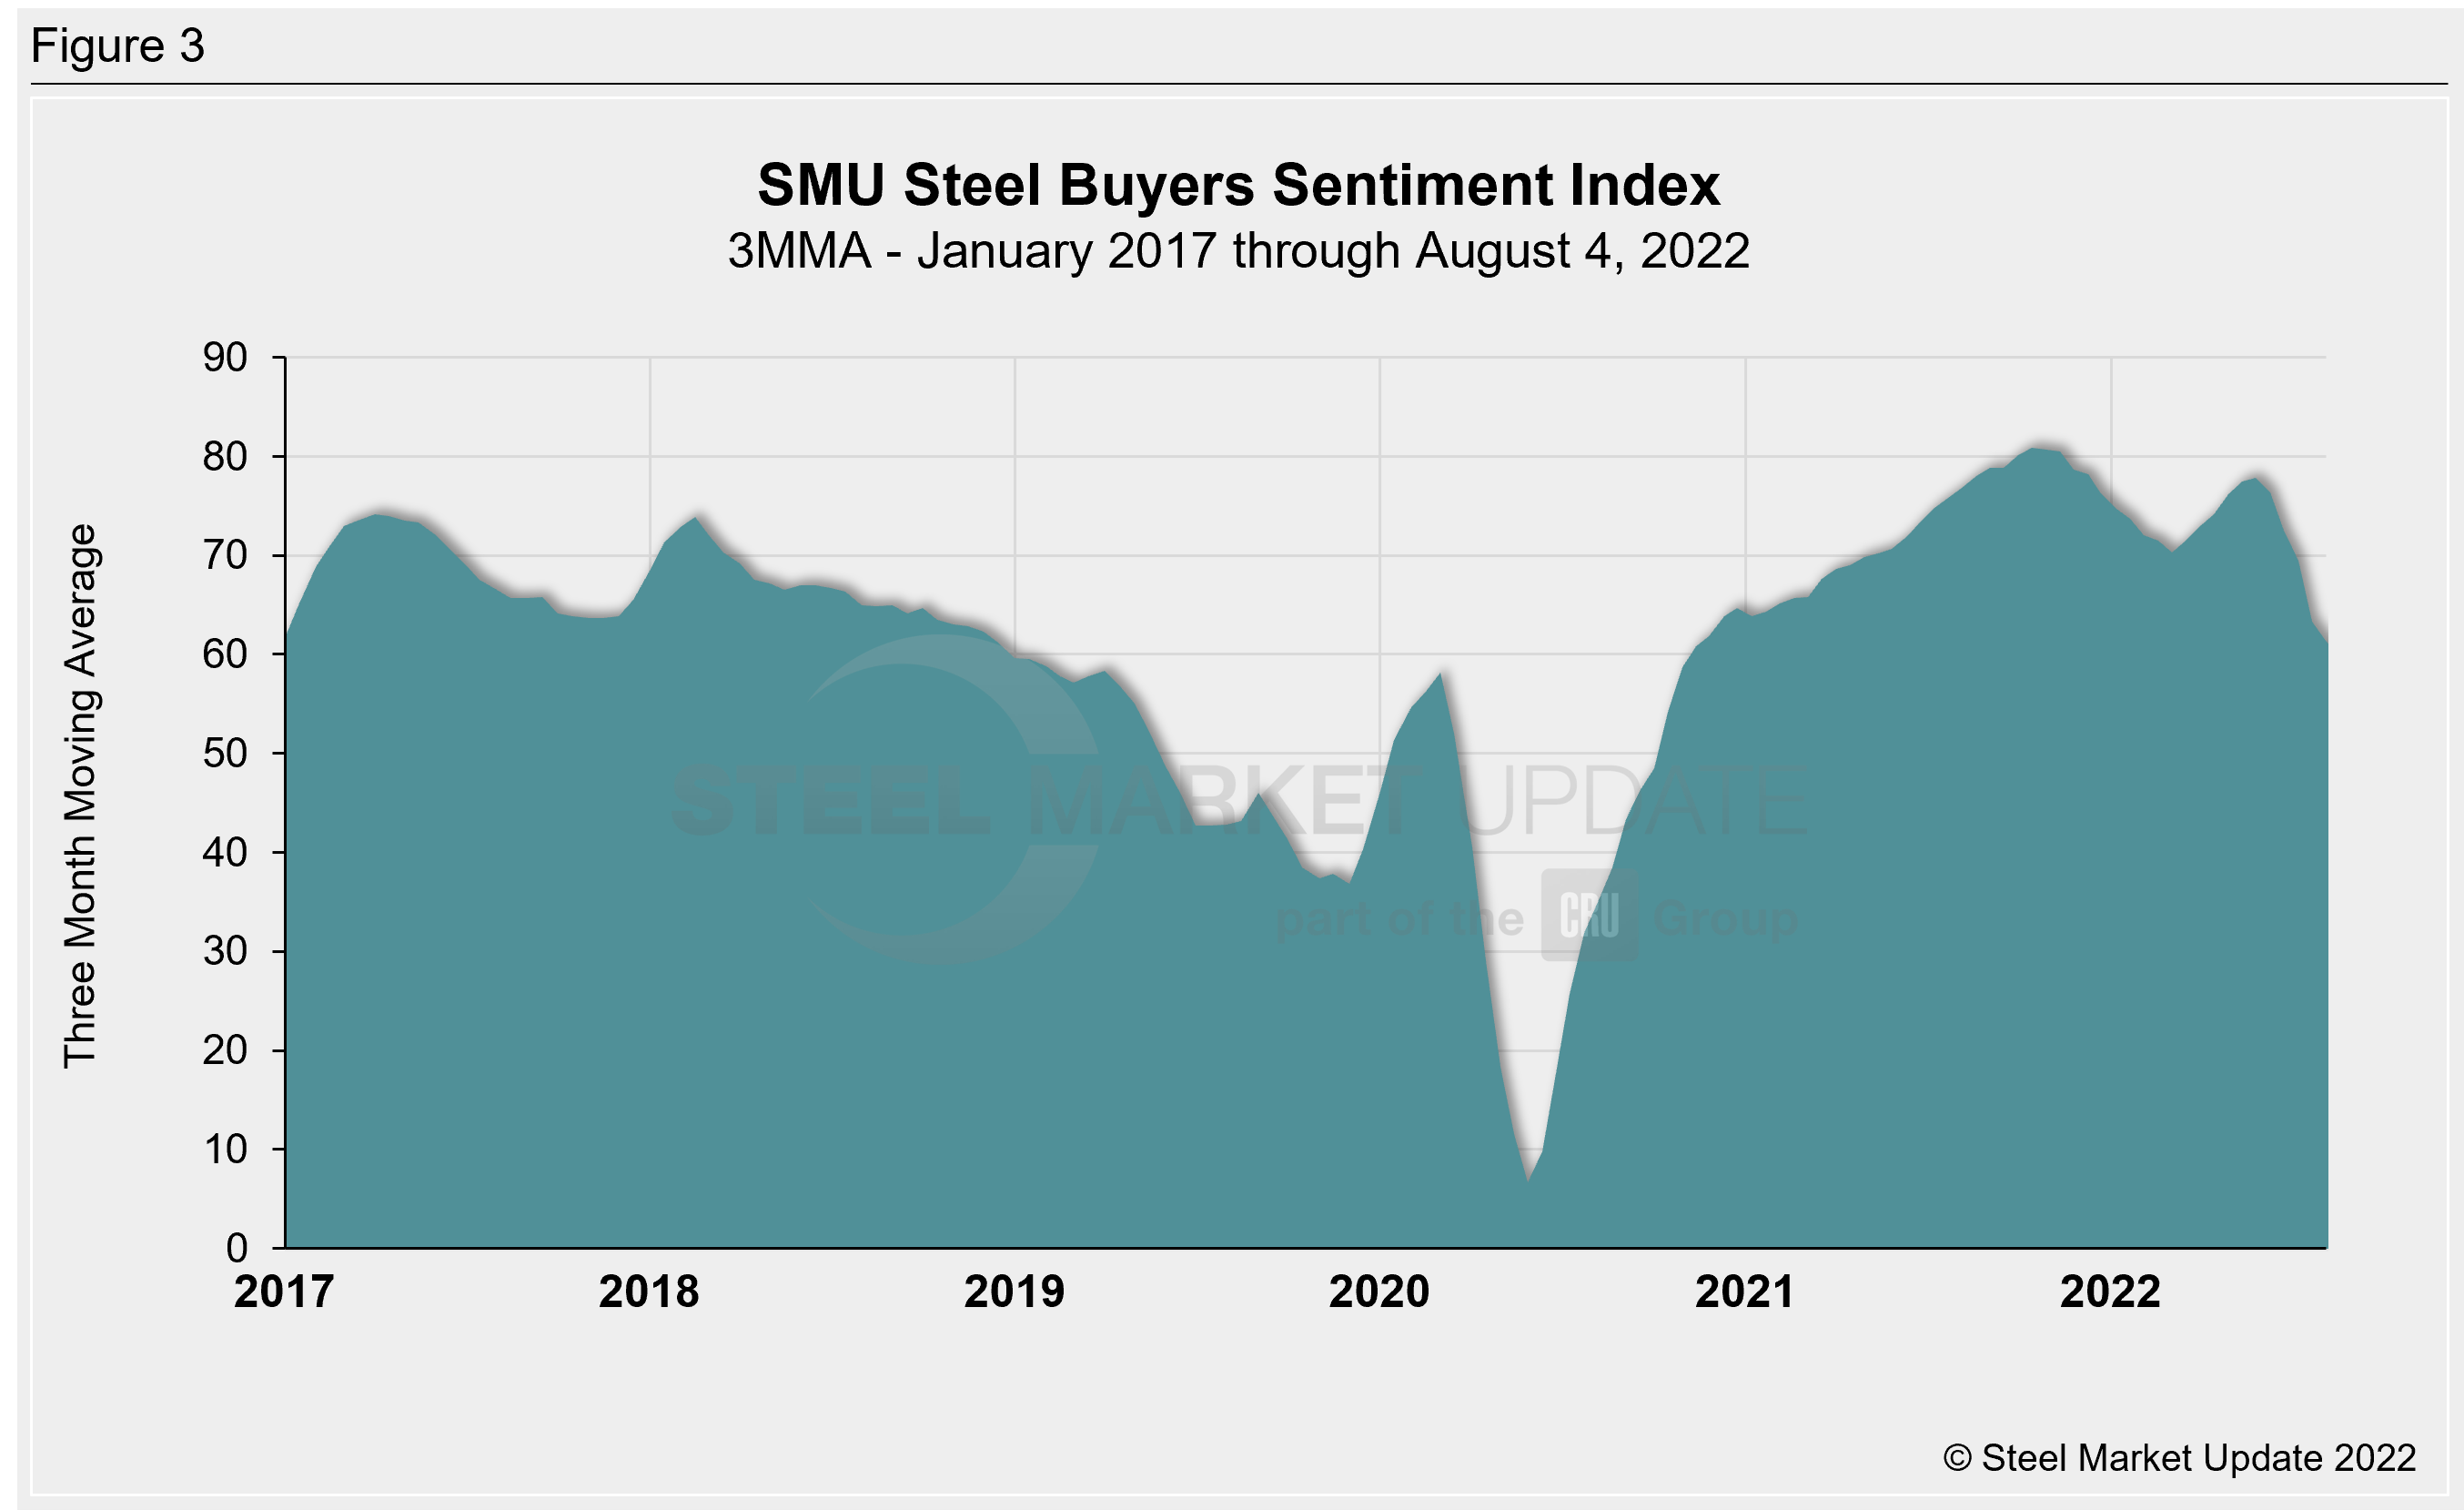
Measured as a three-month moving average, the Current Sentiment 3MMA declined two points to +61.33 last week, a decline of eight points compared to one month prior (Figure 3). Ten weeks ago, the Current Sentiment 3MMA peaked at +77.83, the highest level since December 2021.
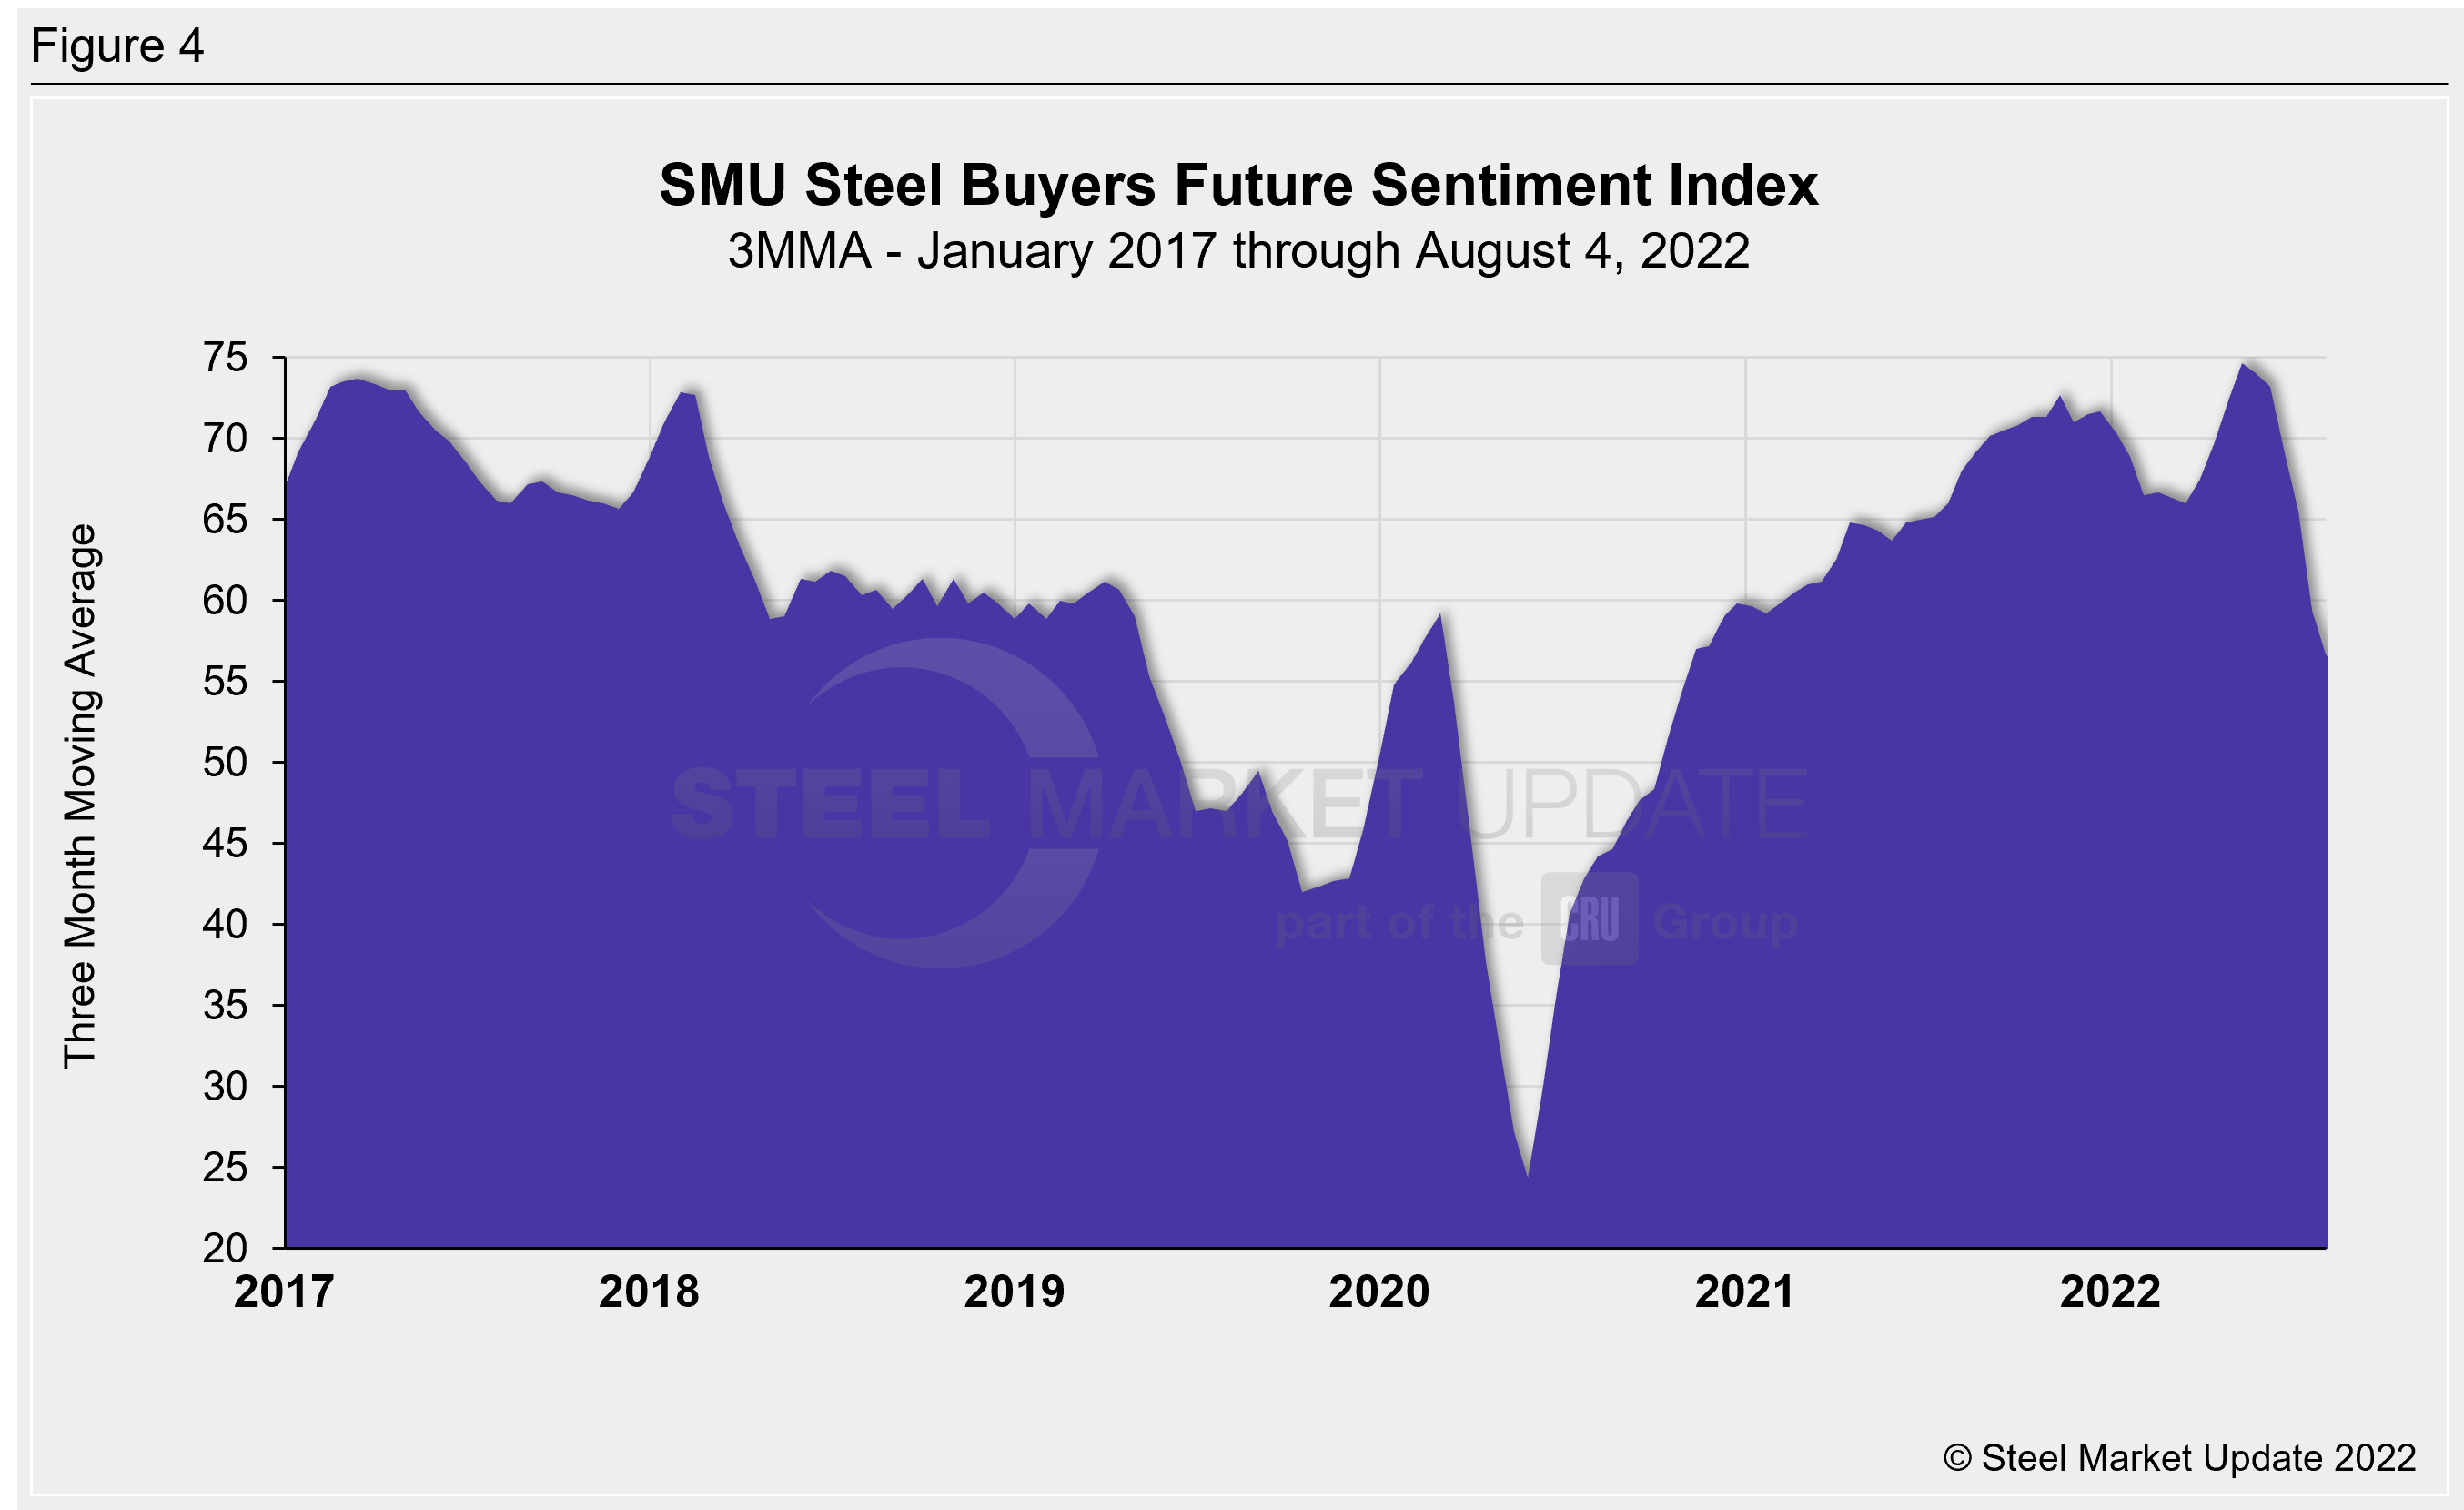
The Future Sentiment 3MMA declined three points this week to +56.67, down nine points from one month prior (Figure 4). Back in May, the Future Sentiment 3MMA reached a record high of +74.67, surpassing the previous record of +73.67 in March 2017.
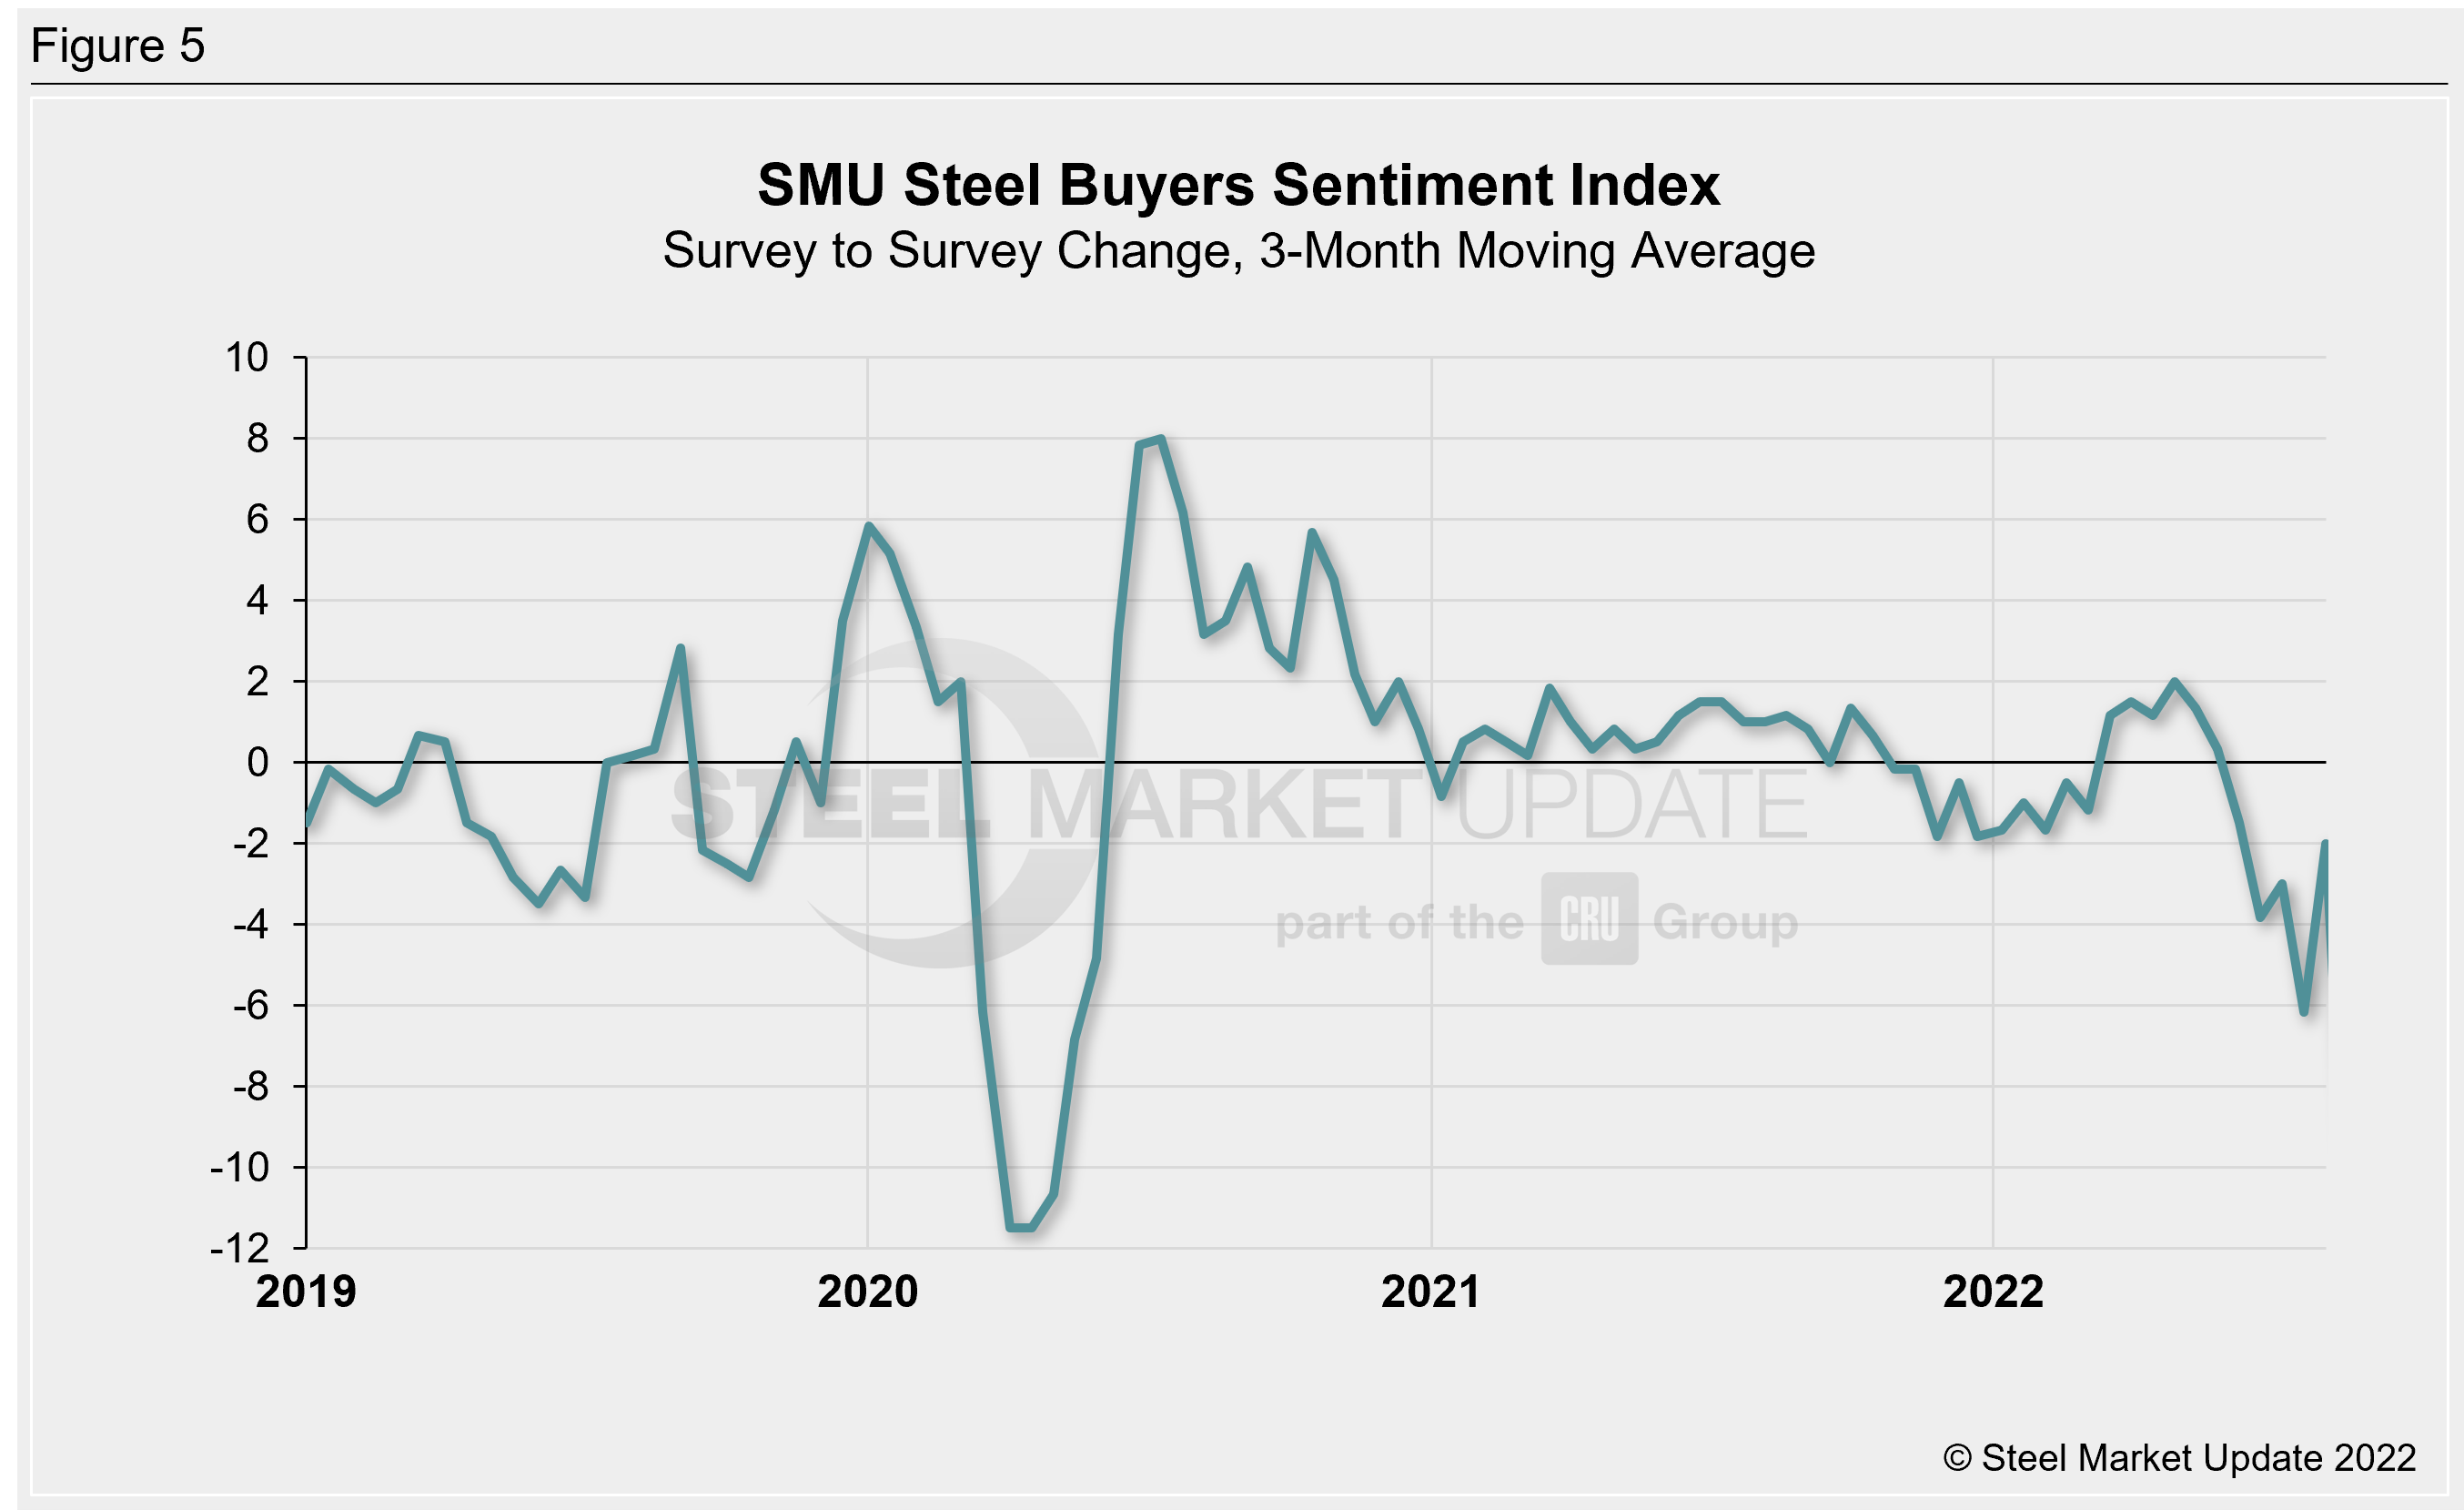
One helpful way to measure changes in Sentiment is to graph the survey-to-survey change in the Current Sentiment 3MMA Index (Figure 5). The latest survey-to-survey 3MMA change is down two points compared to mid-July. Two weeks prior, we saw a six-point decline, which was the largest survey-to-survey change since April 2020. Between November 2020 and June 2022, the survey-to-survey change in our 3MMA Sentiment readings was steady, never exceeding two points. In late June of this year, it began to exceed that range and did so through July.
What SMU Survey Respondents Had to Say
“While sales are dramatically off from 2021 YTD … it is still a good year.”
“Losing money on every order.”
“I think demand will falter as the higher interest rates … pull back business.”
“We still have regular buys, but I am concerned about futures.”
“We have inventory and can fill spot requirements quickly.”
“We’ll do better and better once we actually hit the bottom of this market and our inventory isn’t under water anymore.”
“The margin compression is just too much to overcome on pure service center CTLS/slitting/distribution.”
“I just don’t see much positive happening. Future demand is cloudy, and companies are getting conservative about business.”
“We continue to book orders.”
“Still have to work through inventory glut with lower demand requirements.”
“I expect a reduction of orders in the next 60 days.”
Tracking steel buyers’ sentiment is helpful in predicting their future behavior.
About the SMU Steel Buyers Sentiment Index
SMU Steel Buyers Sentiment Index is a measurement of the current attitude of buyers and sellers of flat-rolled steel products in North America regarding how they feel about their company’s opportunity for success in today’s market. It is a proprietary product developed by Steel Market Update for the North American steel industry.
Positive readings run from +10 to +100. A positive reading means the meter on the right-hand side of our home page will fall in the green area indicating optimistic sentiment. Negative readings run from -10 to -100. They result in the meter on our homepage trending into the red, indicating pessimistic sentiment. A reading of “0” (+/- 10) indicates a neutral sentiment (or slightly optimistic or pessimistic), which is most likely an indicator of a shift occurring in the marketplace. Sentiment is measured via Steel Market Update surveys that are conducted twice per month. We display the meter on our home page.
We send invitations to participate in our survey to more than 700 North American companies. Approximately 45 percent of respondents are service centers/distributors, 30 percent are manufacturers, and the remainder are steel mills, trading companies or toll processors involved in the steel business.
Click here to view an interactive graphic of the SMU Steel Buyers Sentiment Index or the SMU Future Steel Buyers Sentiment Index.
By Brett Linton, Brett@SteelMarketUpdate.com


