

Market Data

August 18, 2022
PPI Data: July’s Results Mixed, Steel Still Falling
Written by David Schollaert
Producer prices fell in July, stunning a 27-month growth run. Last month the headline index declined by 3.1%, seasonally adjusted, driven by a plunge in energy prices that slowed the pace of inflation, the US Labor Department reported.
July’s producer price index (PPI), a measure of the prices received for final-demand products, fell 0.5% from June, the first month-over-month (MoM) decline since April 2020. The result was a surprise, as the consensus estimate was a 0.2% increase for the period.
On an annual basis, the index rose 9.8%, the lowest rate since October 2021. That compares with an 11.3% increase just last month, and the record 11.7% gain seen earlier in March.
The PPI data, which covers more than 10,000 goods and services, is helpful in comparing the direction of price changes in the short and medium term. This analysis is intended to provide subscribers with a view of the relative competitive positions of sheet steel, aluminum, plastic, and wood. It also includes some downstream products and a comparison of truck and rail transportation.
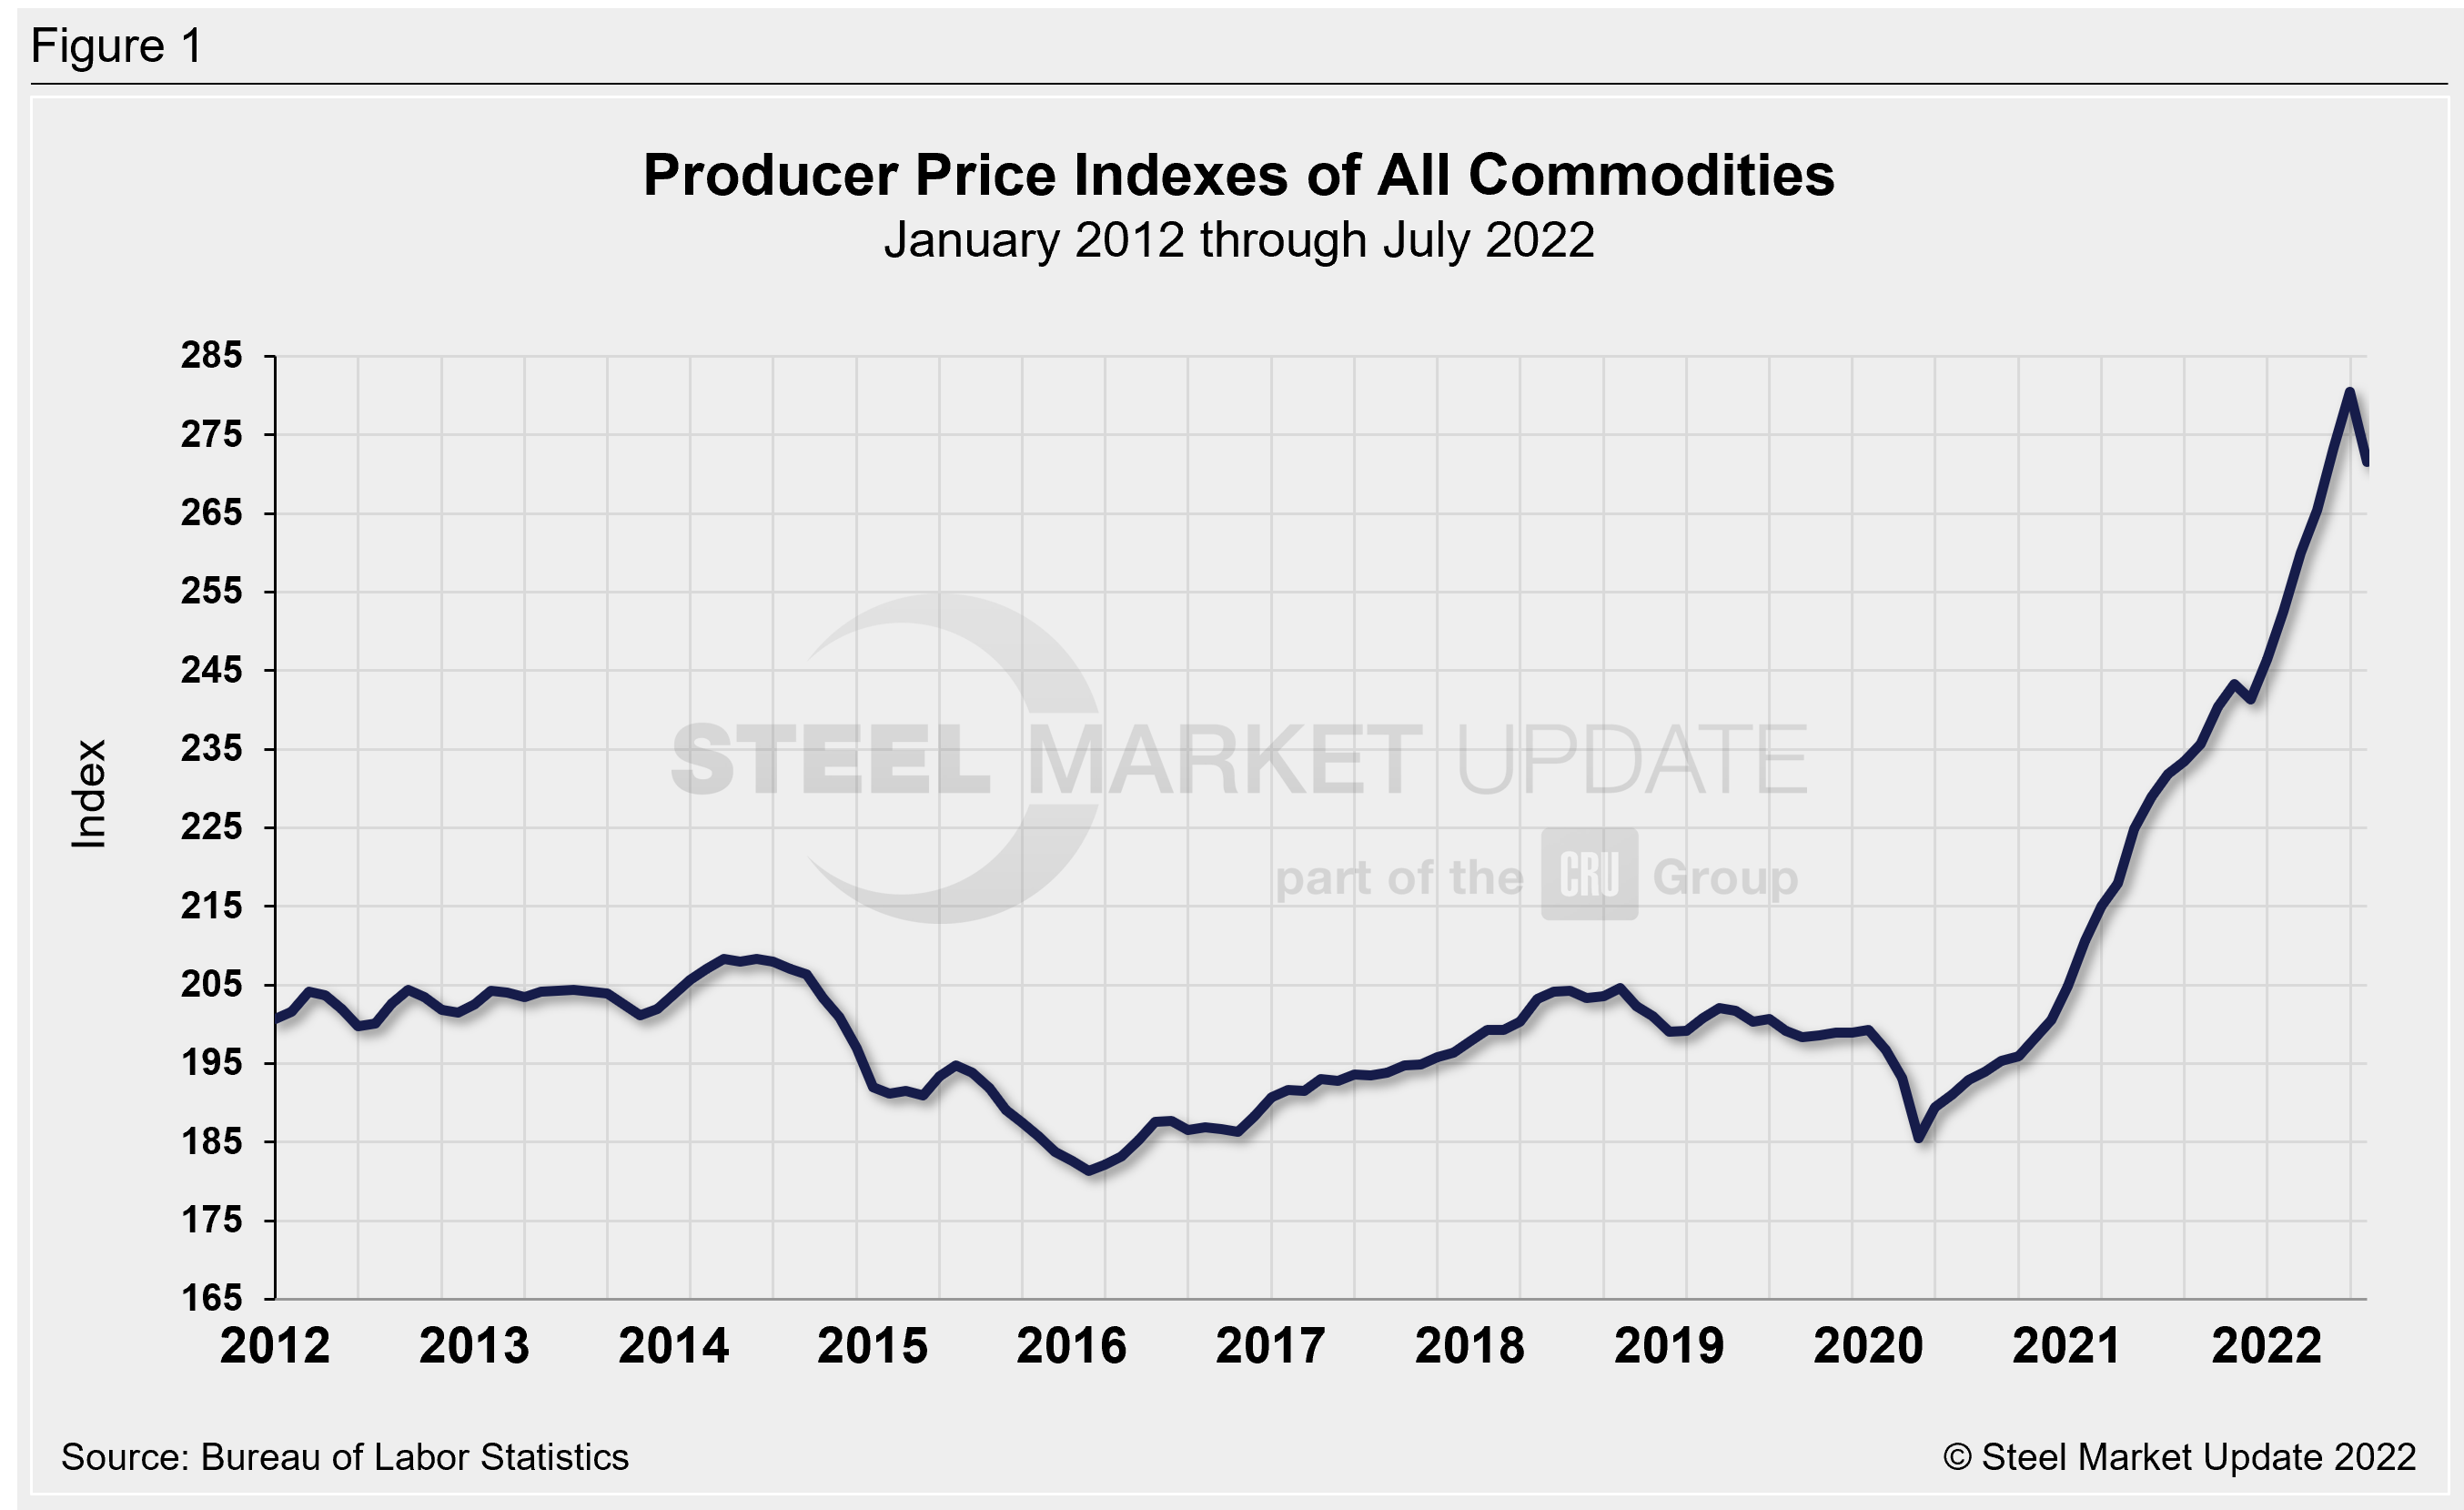
The composite PPI for all commodities (Figure 1) weakened at the onset of the pandemic in 2020, tumbling by more than 4.0%. The US economy has recovered well since then, but inflationary pressure has taken hold.
Most of the decline came from energy, which dropped 9% at the wholesale level and accounted for 80% of the total decline in goods prices, which fell 1.8%. The index for services rose 0.1%.
Stripping out food, energy and trade services, PPI increased 0.2% in July, which was less than the expected 0.4% gain. Core PPI rose 5.8% from a year ago.
SMU’s benchmark hot-rolled coil price range stood at $750–850 per net ton ($37.50–42.50/cwt) with an average of $800 per net ton FOB mill, east of the Rockies, as of Aug. 16. Despite a slight blip, HRC prices have been falling since reaching their most recent peak of $1,480 per net ton on average in mid-April. They have declined by roughly $75 per net ton since SMU’s PPI report last month. PPI prices have moved in the opposite direction driven by rising inflation for most other goods.
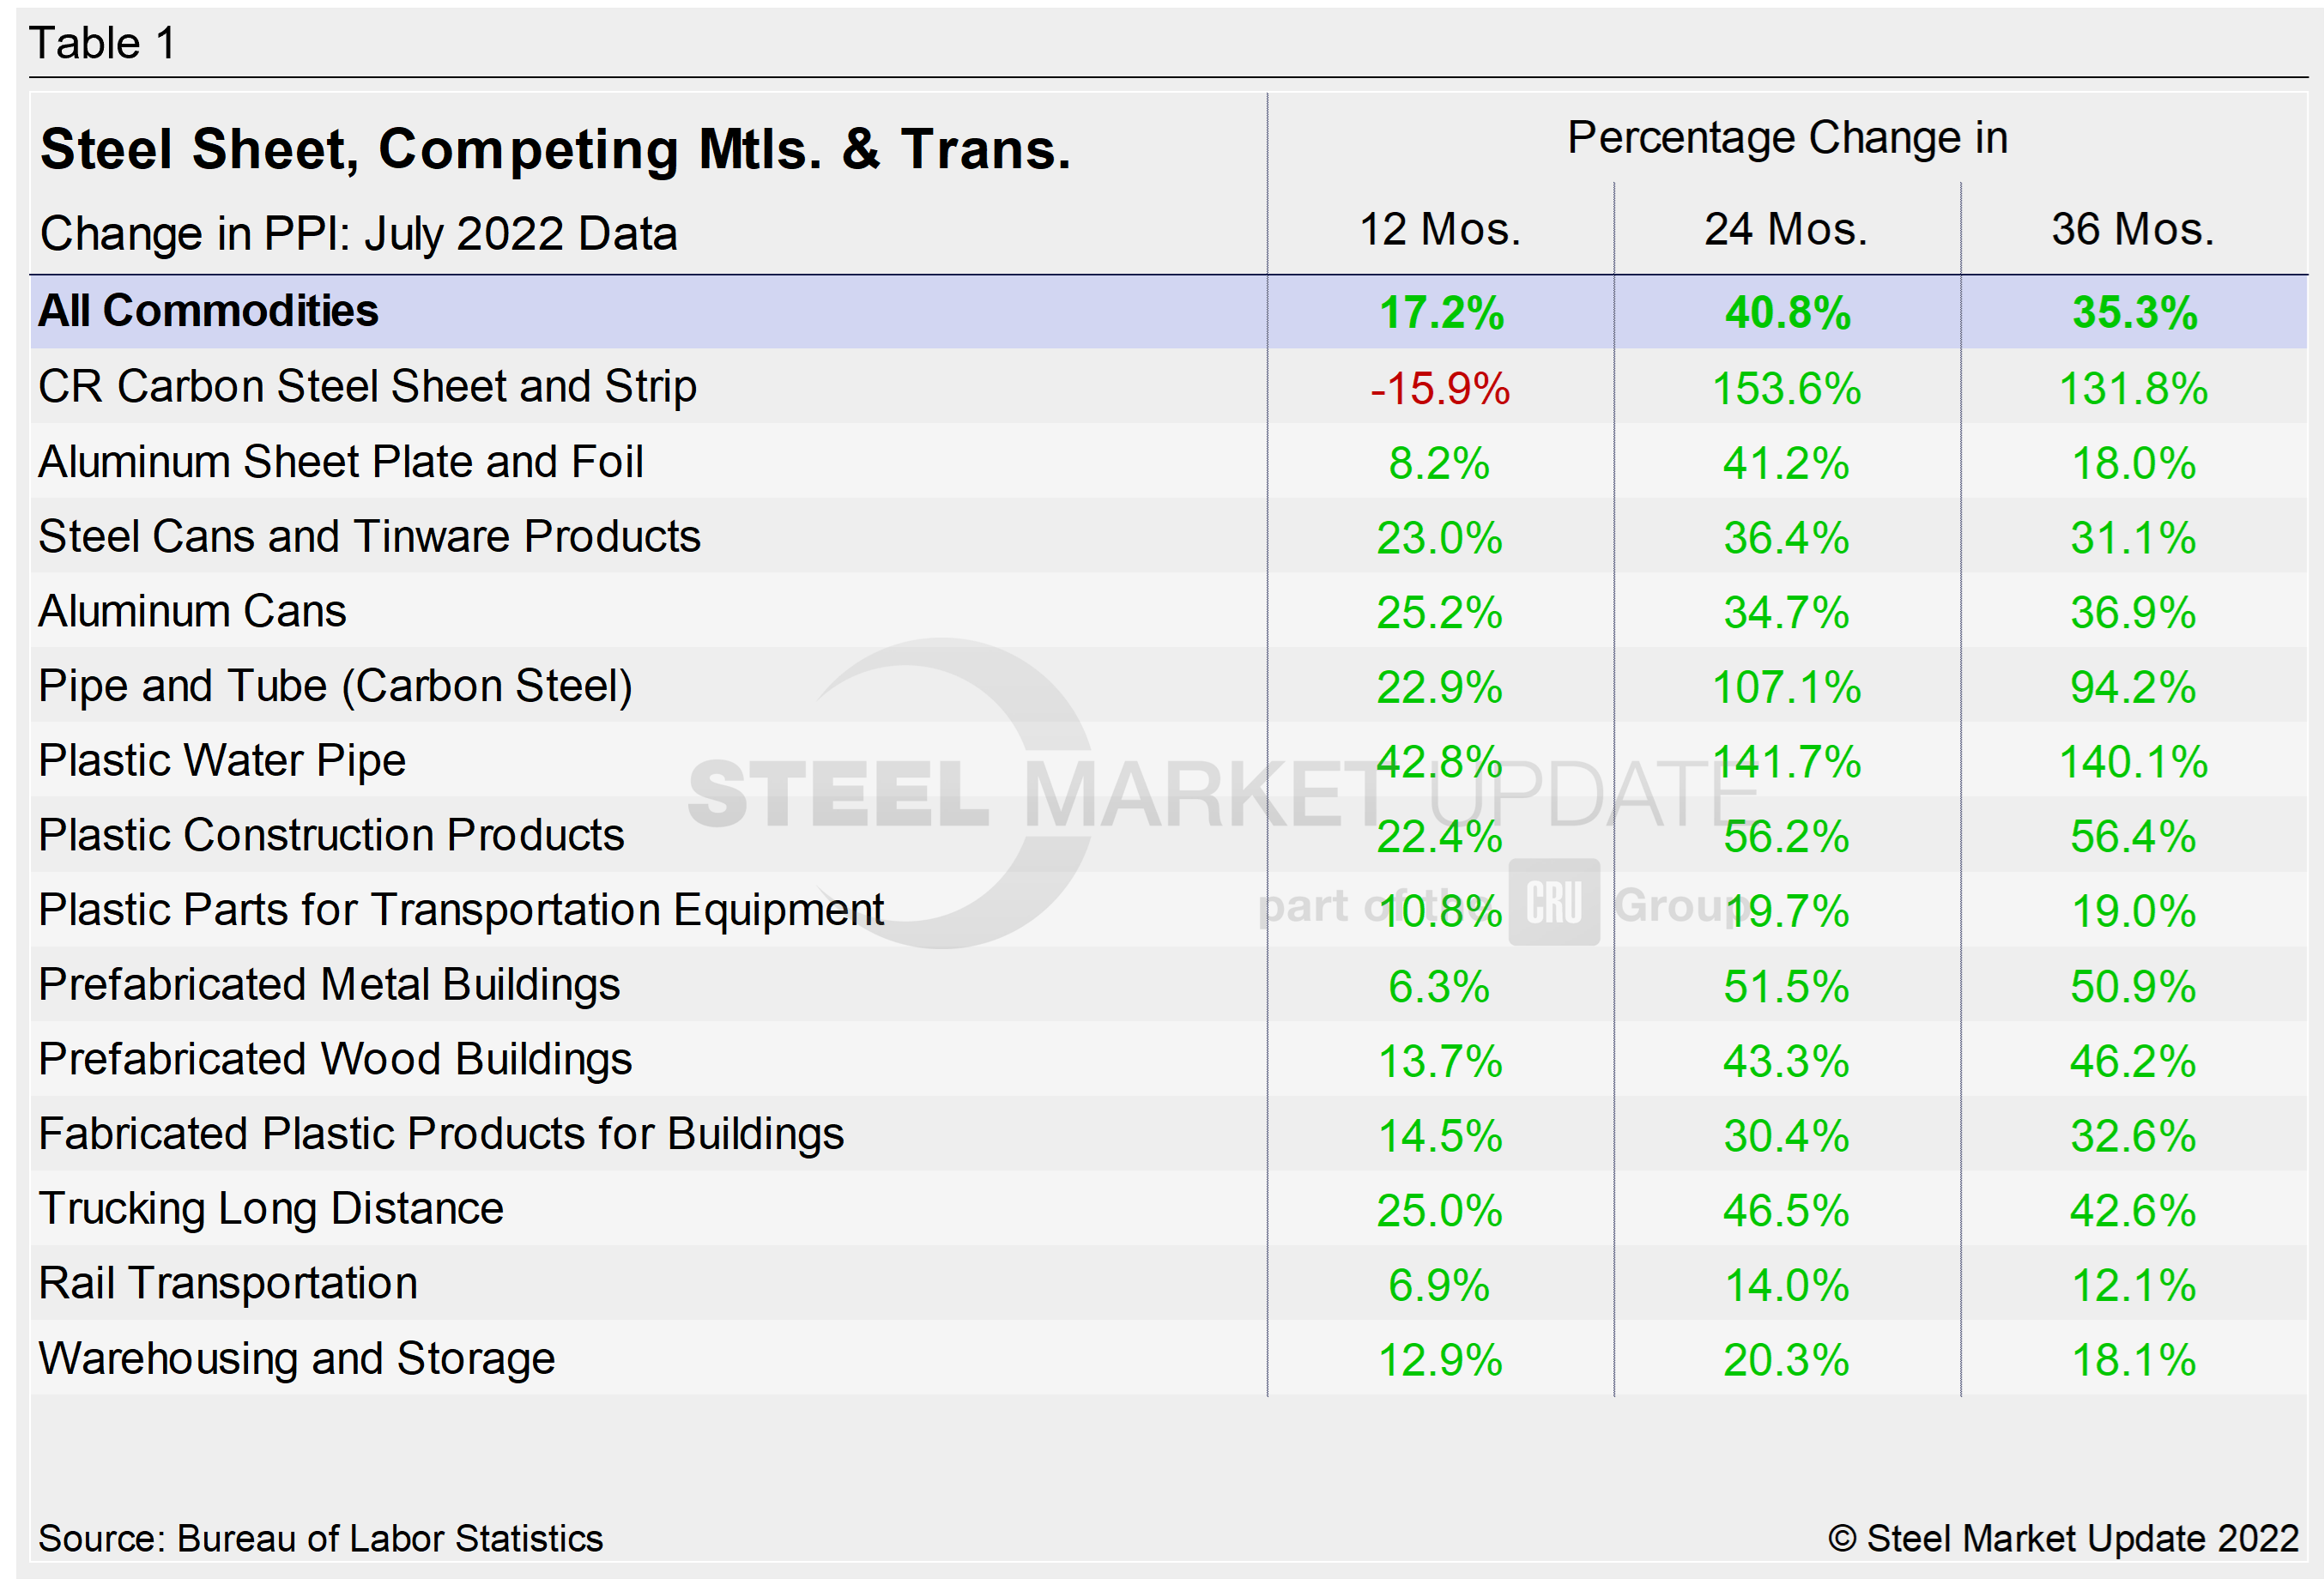
A summary of each segment’s change on a one-, two- and three-year basis is shown in the table below. The gain/loss pattern is shown by the color codes. Rising prices are considered positive. The positive swing on a 12- and 24-month basis is no surprise, given a strong recovery following Covid lockdowns in 2020. The growth at 36 months, however, is significant. The clear surge not only reinforces this historic recovery but also the inflation that has taken hold.
The table includes direct comparisons where possible between steel and competing products, such as plastics. It also includes transportation, warehousing, and storage to better contextualize current market conditions. Construction-related products are up anywhere from 6.3% to 42.8% at the 12-month level, with similar increases for the 24- and 36-month periods. The market has been resilient despite growing concerns about the impact of inflation, which has been significantly higher than forecast. But the rate of price gains for some products has slowed despite continuing supply-chain bottlenecks, and in some cases has started to slip.
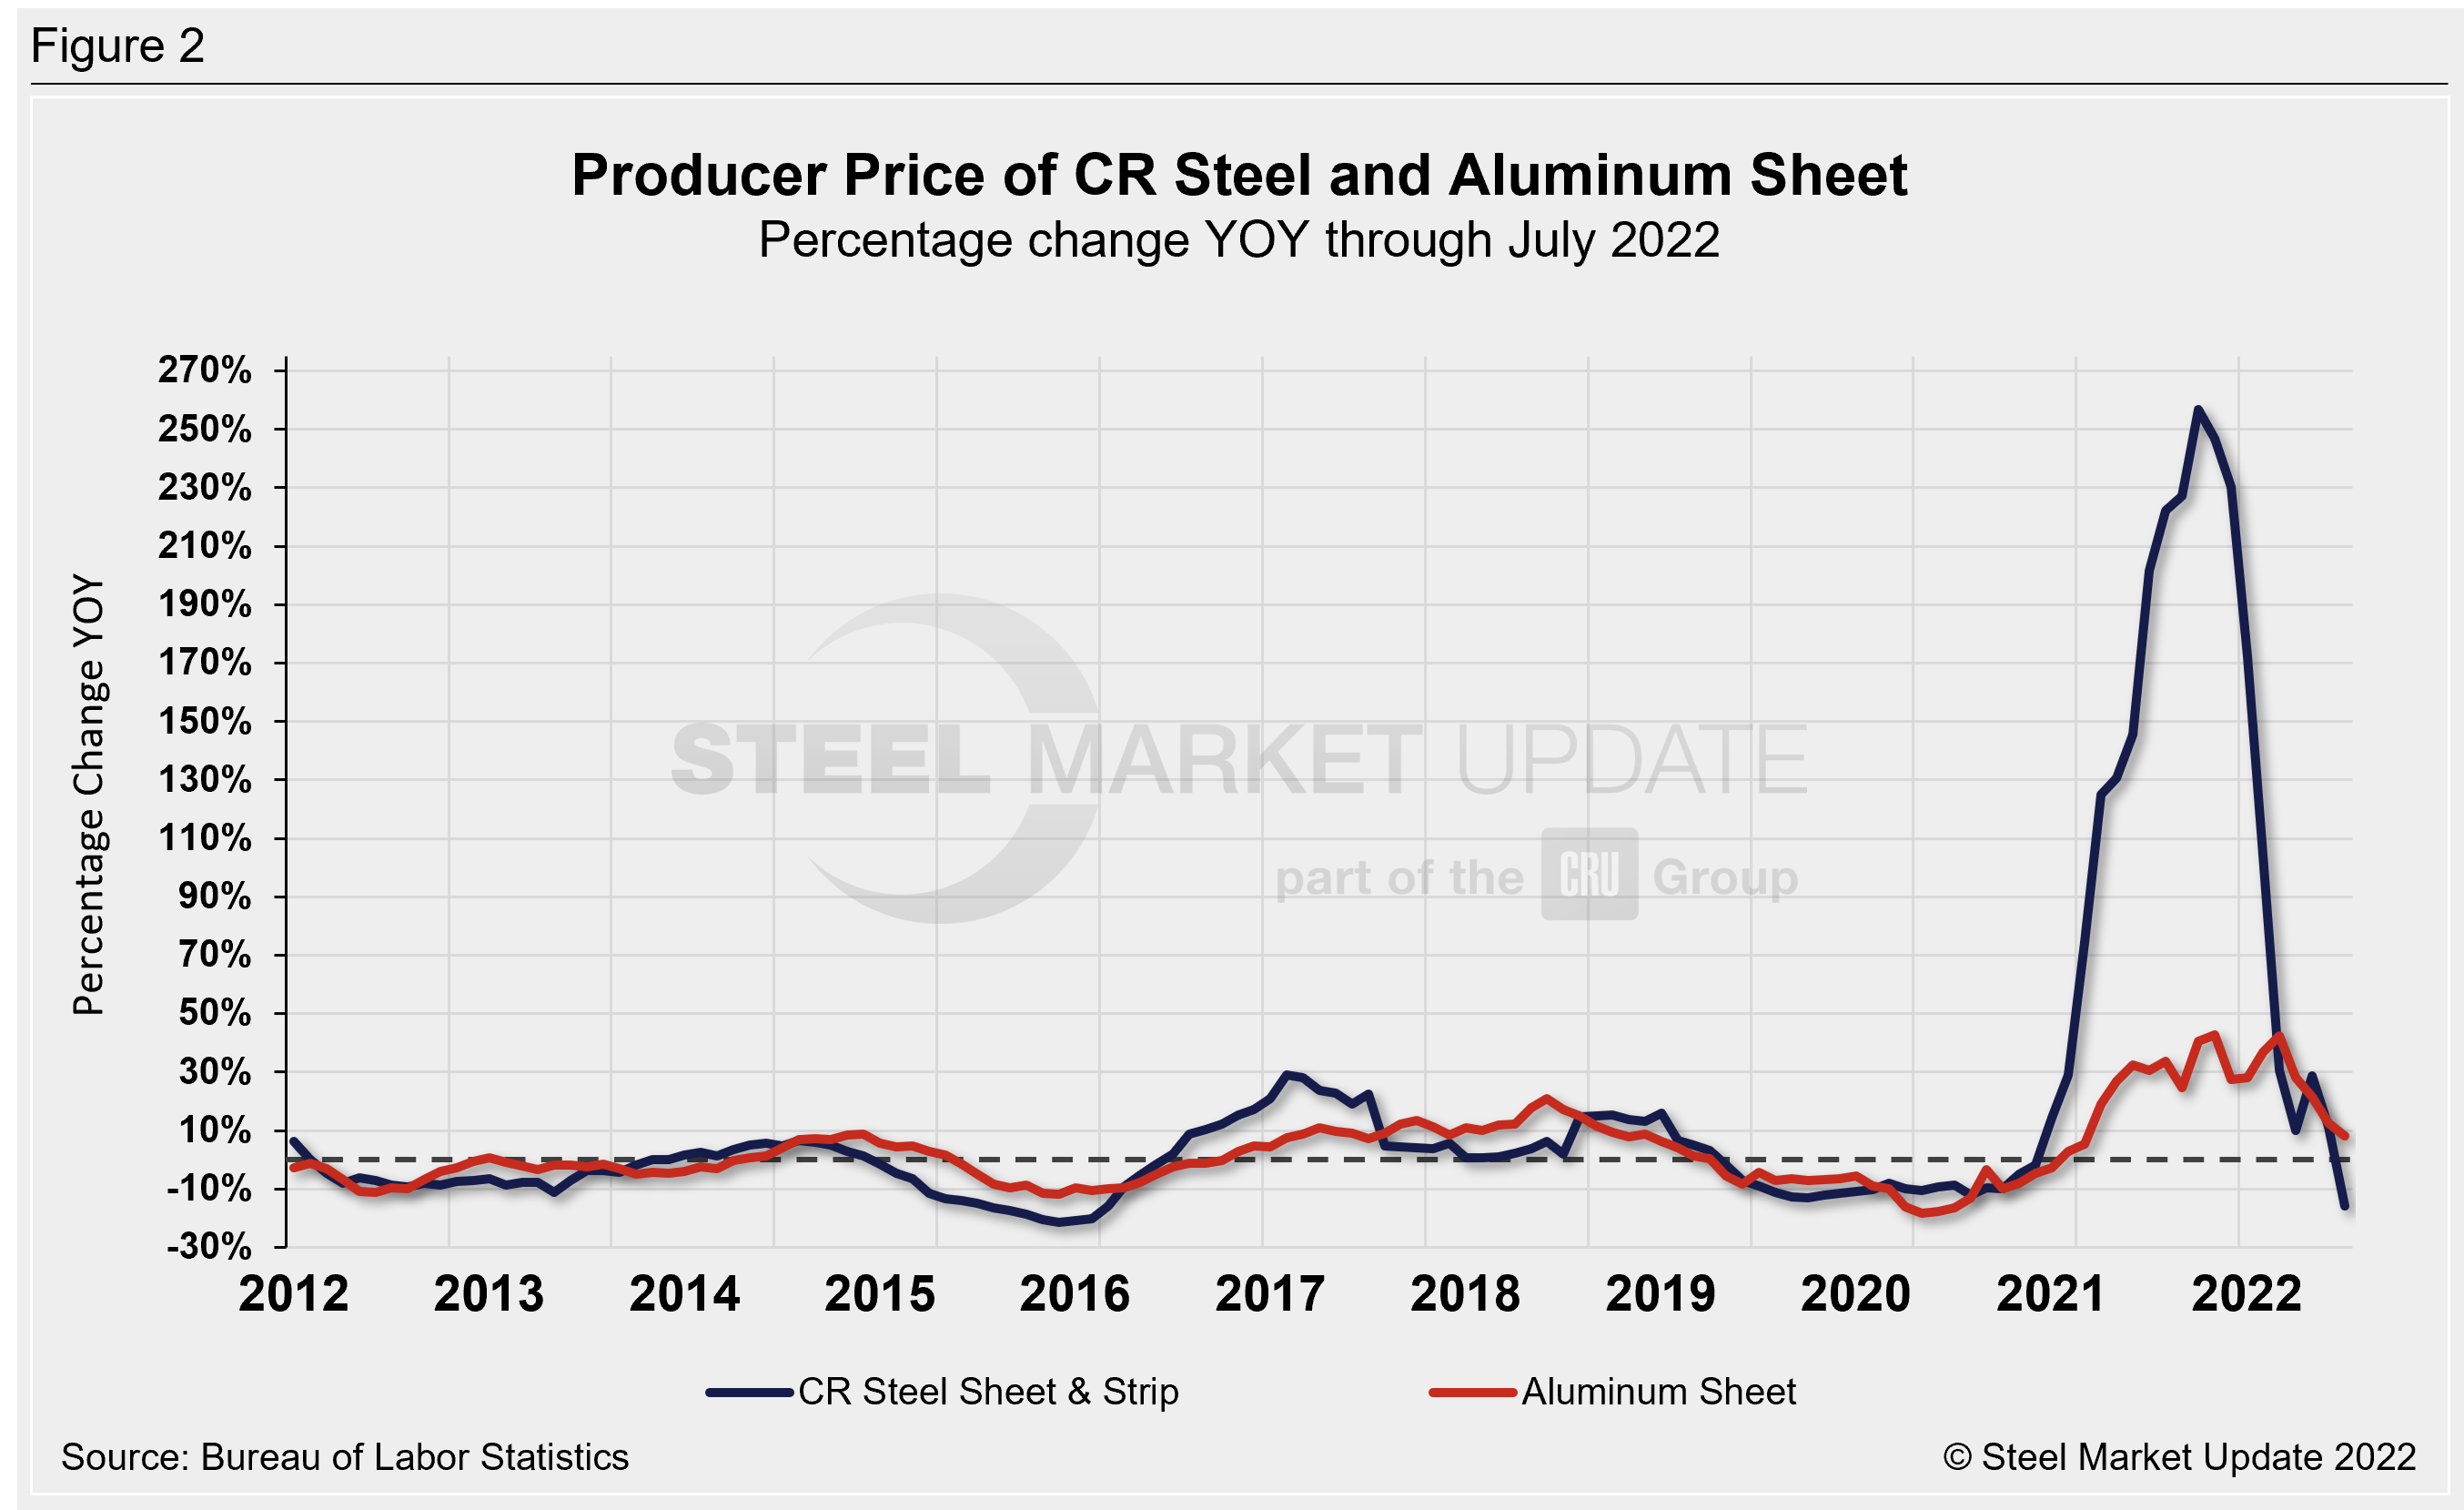
Both steel and aluminum products (Figure 2) had easily overtaken pre-pandemic PPI figures, reaching unprecedented highs. They saw additional support in the early days of the war in Ukraine, which sparked concerns about raw materials prices and additional supply-chain disruptions. As the shock of the war faded, prices retreated. They have been losing ground since mid-April in most cases.
Let’s compare the prices of cold-rolled steel sheet and flat-rolled aluminum. Both recovered from 2020’s losses and reached historic highs. The trajectory in cold-rolled steel sheet prices overshadowed the impressive rebound in flat-rolled aluminum. But the decline has also been as precipitous as the rise.
Both cold-rolled steel sheet and flat-rolled aluminum fell in July versus the prior month. Cold-rolled steel prices declined 7.2% MoM in July, while flat-rolled aluminum declined by 3.6% over the same period.
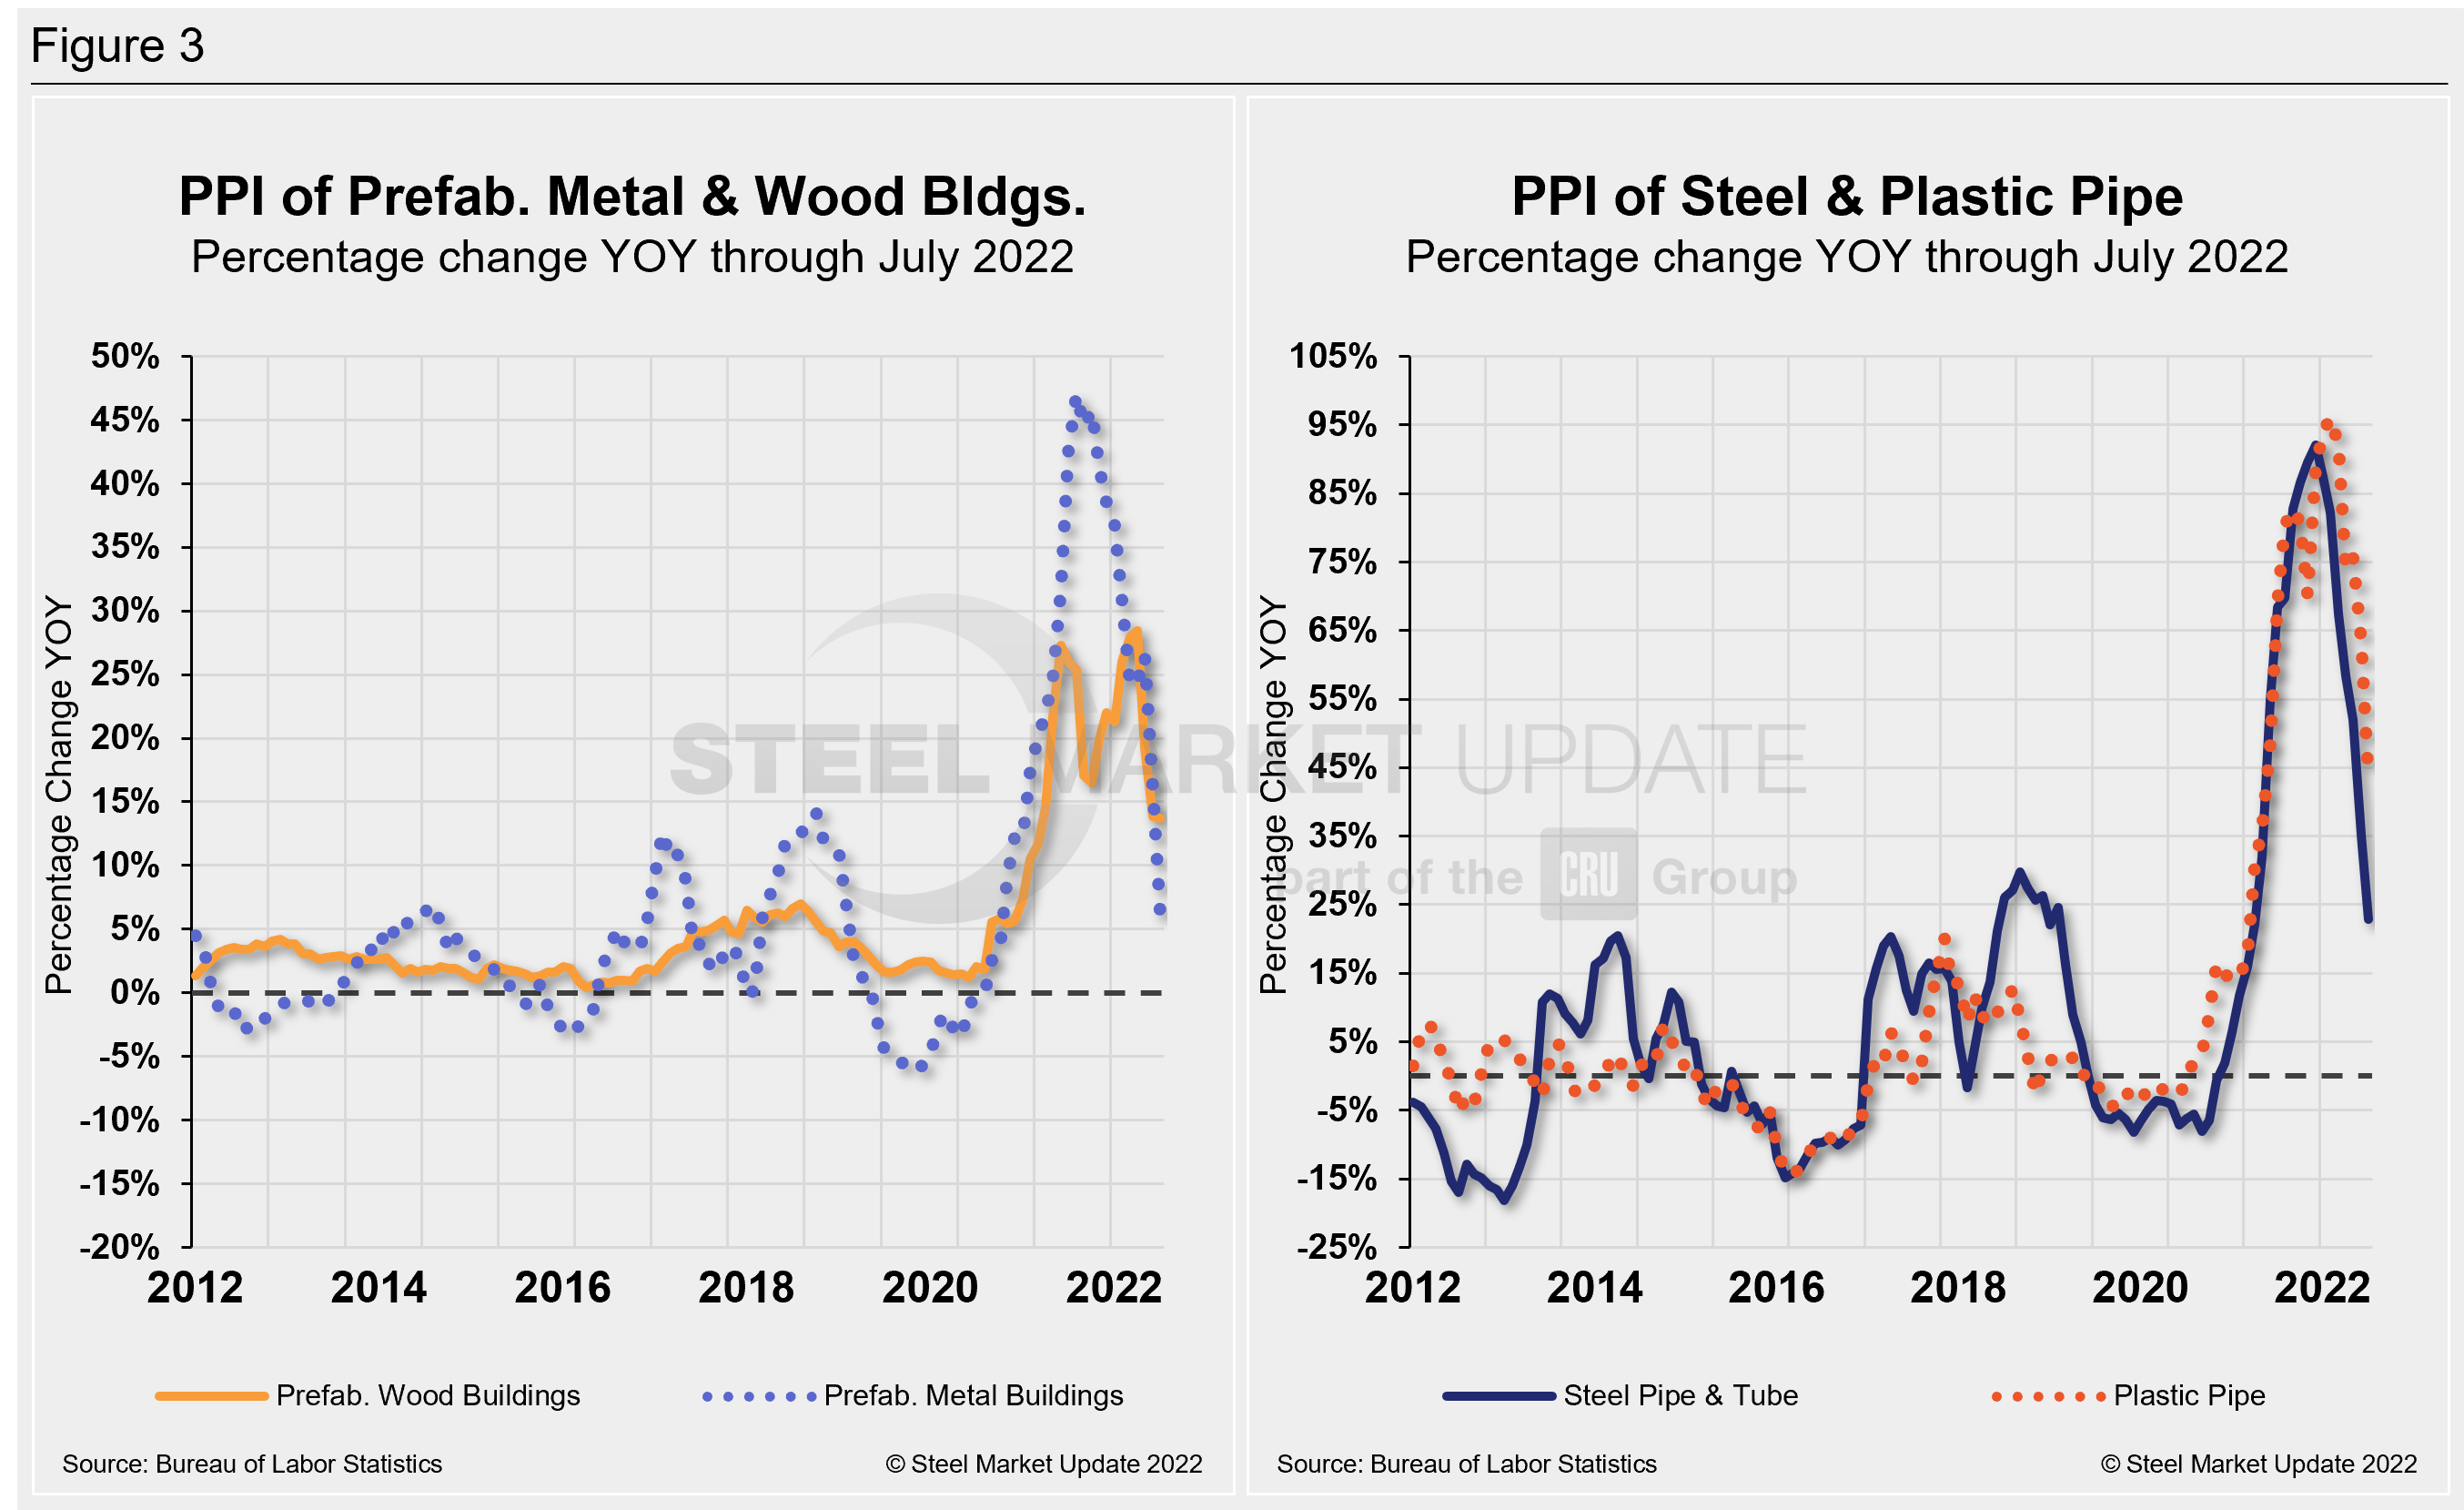
Prices of prefabricated metal buildings and prefabricated wood buildings have both seen significant increases since the beginning of 2021 and carrying into 2022. The rate of growth has diverged over the past few months, with prefabricated steel buildings slowing at a faster pace than prices for prefabricated wood buildings.
Prefabricated steel building prices were in negative territory in June 2020 but rallied to a positive by 37.9% over 17 months. Growth has been inconsistent through most of 2022, slipping 0.9% MoM in July.
A similar trend was seen in prefabricated wood buildings over the same period, though that sector never hit negative growth. Prices had recovered consecutively in April and May but edged down repeatedly since, with a 0.4% MoM decline in July.
The prices of steel and plastic pipe have both experienced big swings because of the pandemic. Plastic pipe prices are up, but the growth rate has slowed. Steel pipe prices have declined, in-line with the same trend seen across most steel products.
Steel pipe prices slipped 0.8% MoM in July while plastic pipe prices were up a 1% over the same period. Figure 3 is a side-by-side comparison of prefabricated buildings and pipe price dynamics.
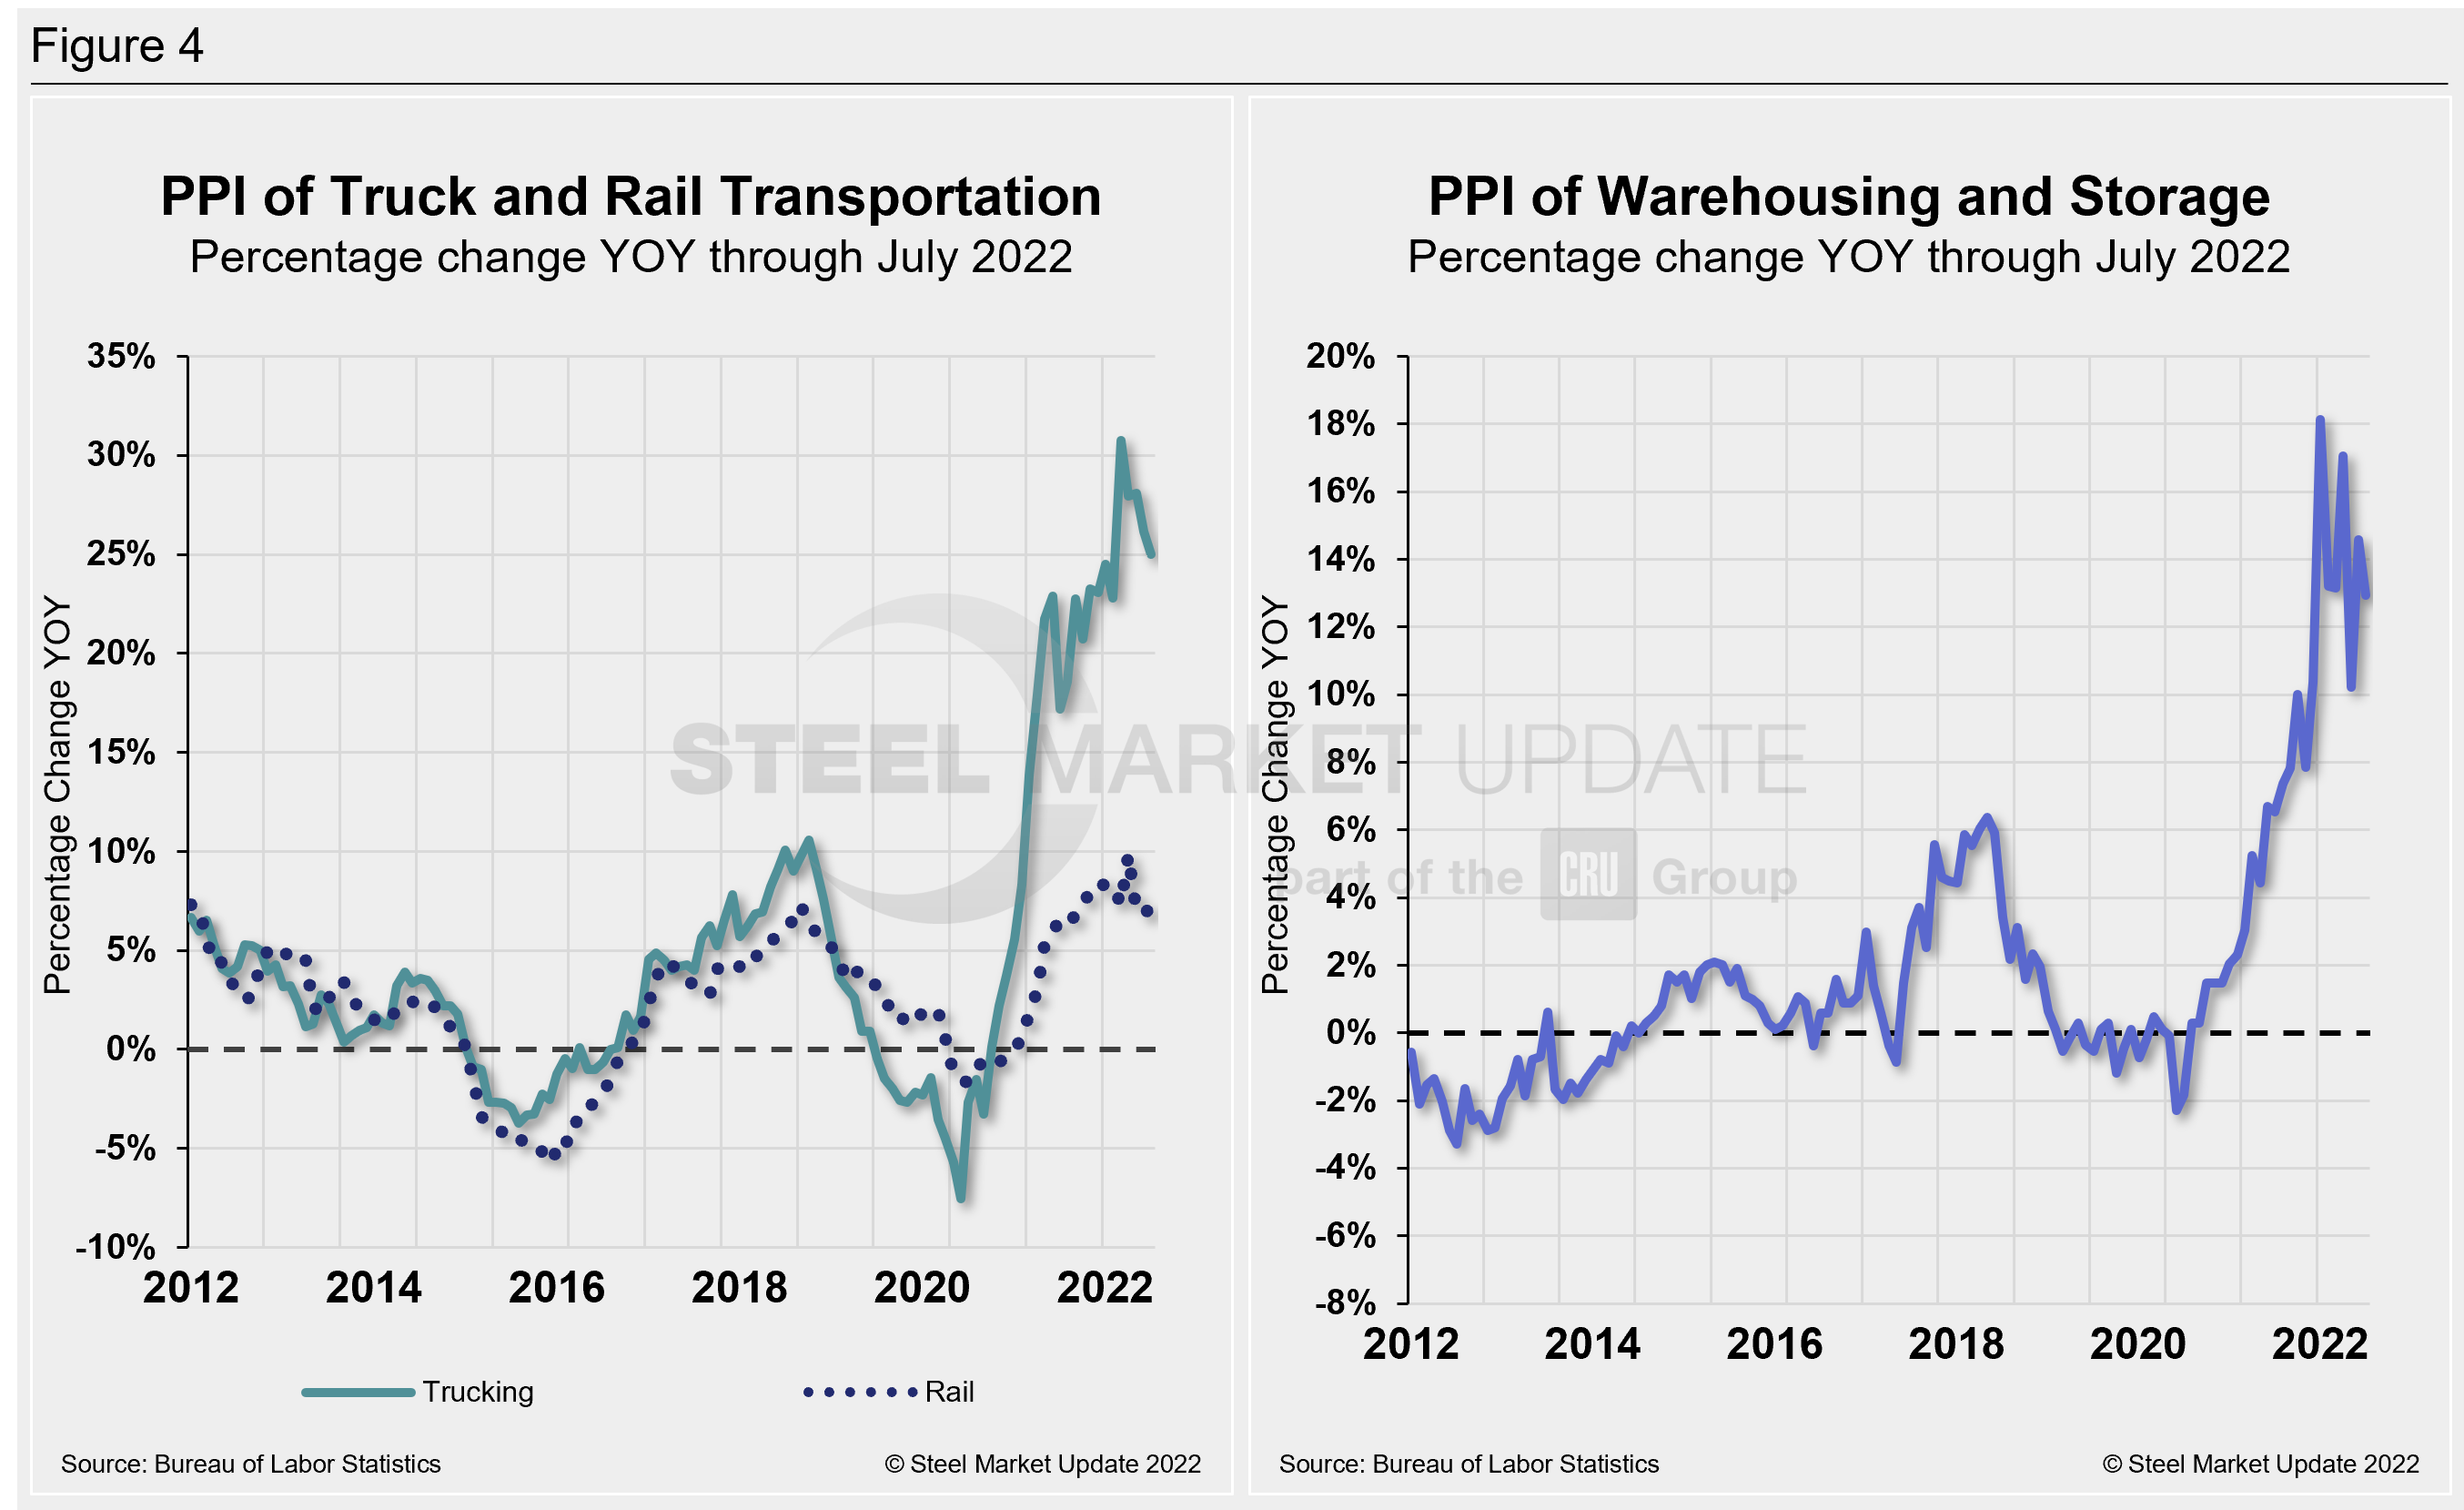
The growth of truck transportation prices has far exceeded those of rail since they both bottomed out in June 2020. Rail dipped to a negative 1.7% at that time but has since steadily corrected to a positive 6.9% through July. Long-distance trucking, on the other hand, recovered to 23.9% this past November after falling to -7.5% in July 2020. But trucking has been a bit erratic of late. Even though long-distance slipped by 1% MoM, freight costs have experienced the most significant increase in more than a decade.
Warehousing and storage prices also have risen but have fluctuated for much of 2022. They have been erratic over the past few months. After rebounding and accelerating by 2.6% in June, they slipped down 1.1% MoM in July. Last month’s reading of 128.4 is 12.9% above the same year-ago level. Figure 4 is a side-by-side comparison of transportation and warehousing dynamics.
The official description of this program from the BLS reads as follows: “The Producer Price Index (PPI) is a family of indexes that measure the average change over time in the prices received by domestic producers of goods and services. PPIs measure price change from the perspective of the seller. This contrasts with other measures, such as the Consumer Price Index (CPI). CPIs measure price changes from the purchaser’s perspective. Sellers’ and purchasers’ prices can differ due to government subsidies, sales and excise taxes, and distribution costs. More than 10,000 PPIs for individual products and groups of products are released each month. PPIs are available for the products of virtually every industry in the mining and manufacturing sectors of the U.S. economy. New PPIs are gradually being introduced for the products of industries in the construction, trade, finance, and services sectors of the economy. More than 100,000 price quotations per month are organized into three sets of PPIs: (1) stage-of-processing indexes, (2) commodity indexes, and (3) indexes for the net output of industries and their products. The stage-of-processing structure organizes products by class of buyer and degree of fabrication. The commodity structure organizes products by similarity of end use or material composition. The entire output of various industries is sampled to derive price indexes for the net output of industries and their products.
By David Schollaert, David@SteelMarketUpdate.com


