

Market Data

August 18, 2022
Steel Mill Lead Times Slightly Extend
Written by Brett Linton
Steel mill lead times were mixed this week, with the processing time for some ordered products extending, shrinking for one, and another holding steady. Cold rolled and coated lead times increased compared to our previous market check, while plate lead times slightly declined and hot rolled lead times remained flat.
On average this week, lead times increased 0.2 weeks across the board compared to two weeks prior, an extension of 0.4 weeks compared to levels one month ago. Having gradually declined from the April peak, lead times generally remain in line with early 2022 levels.
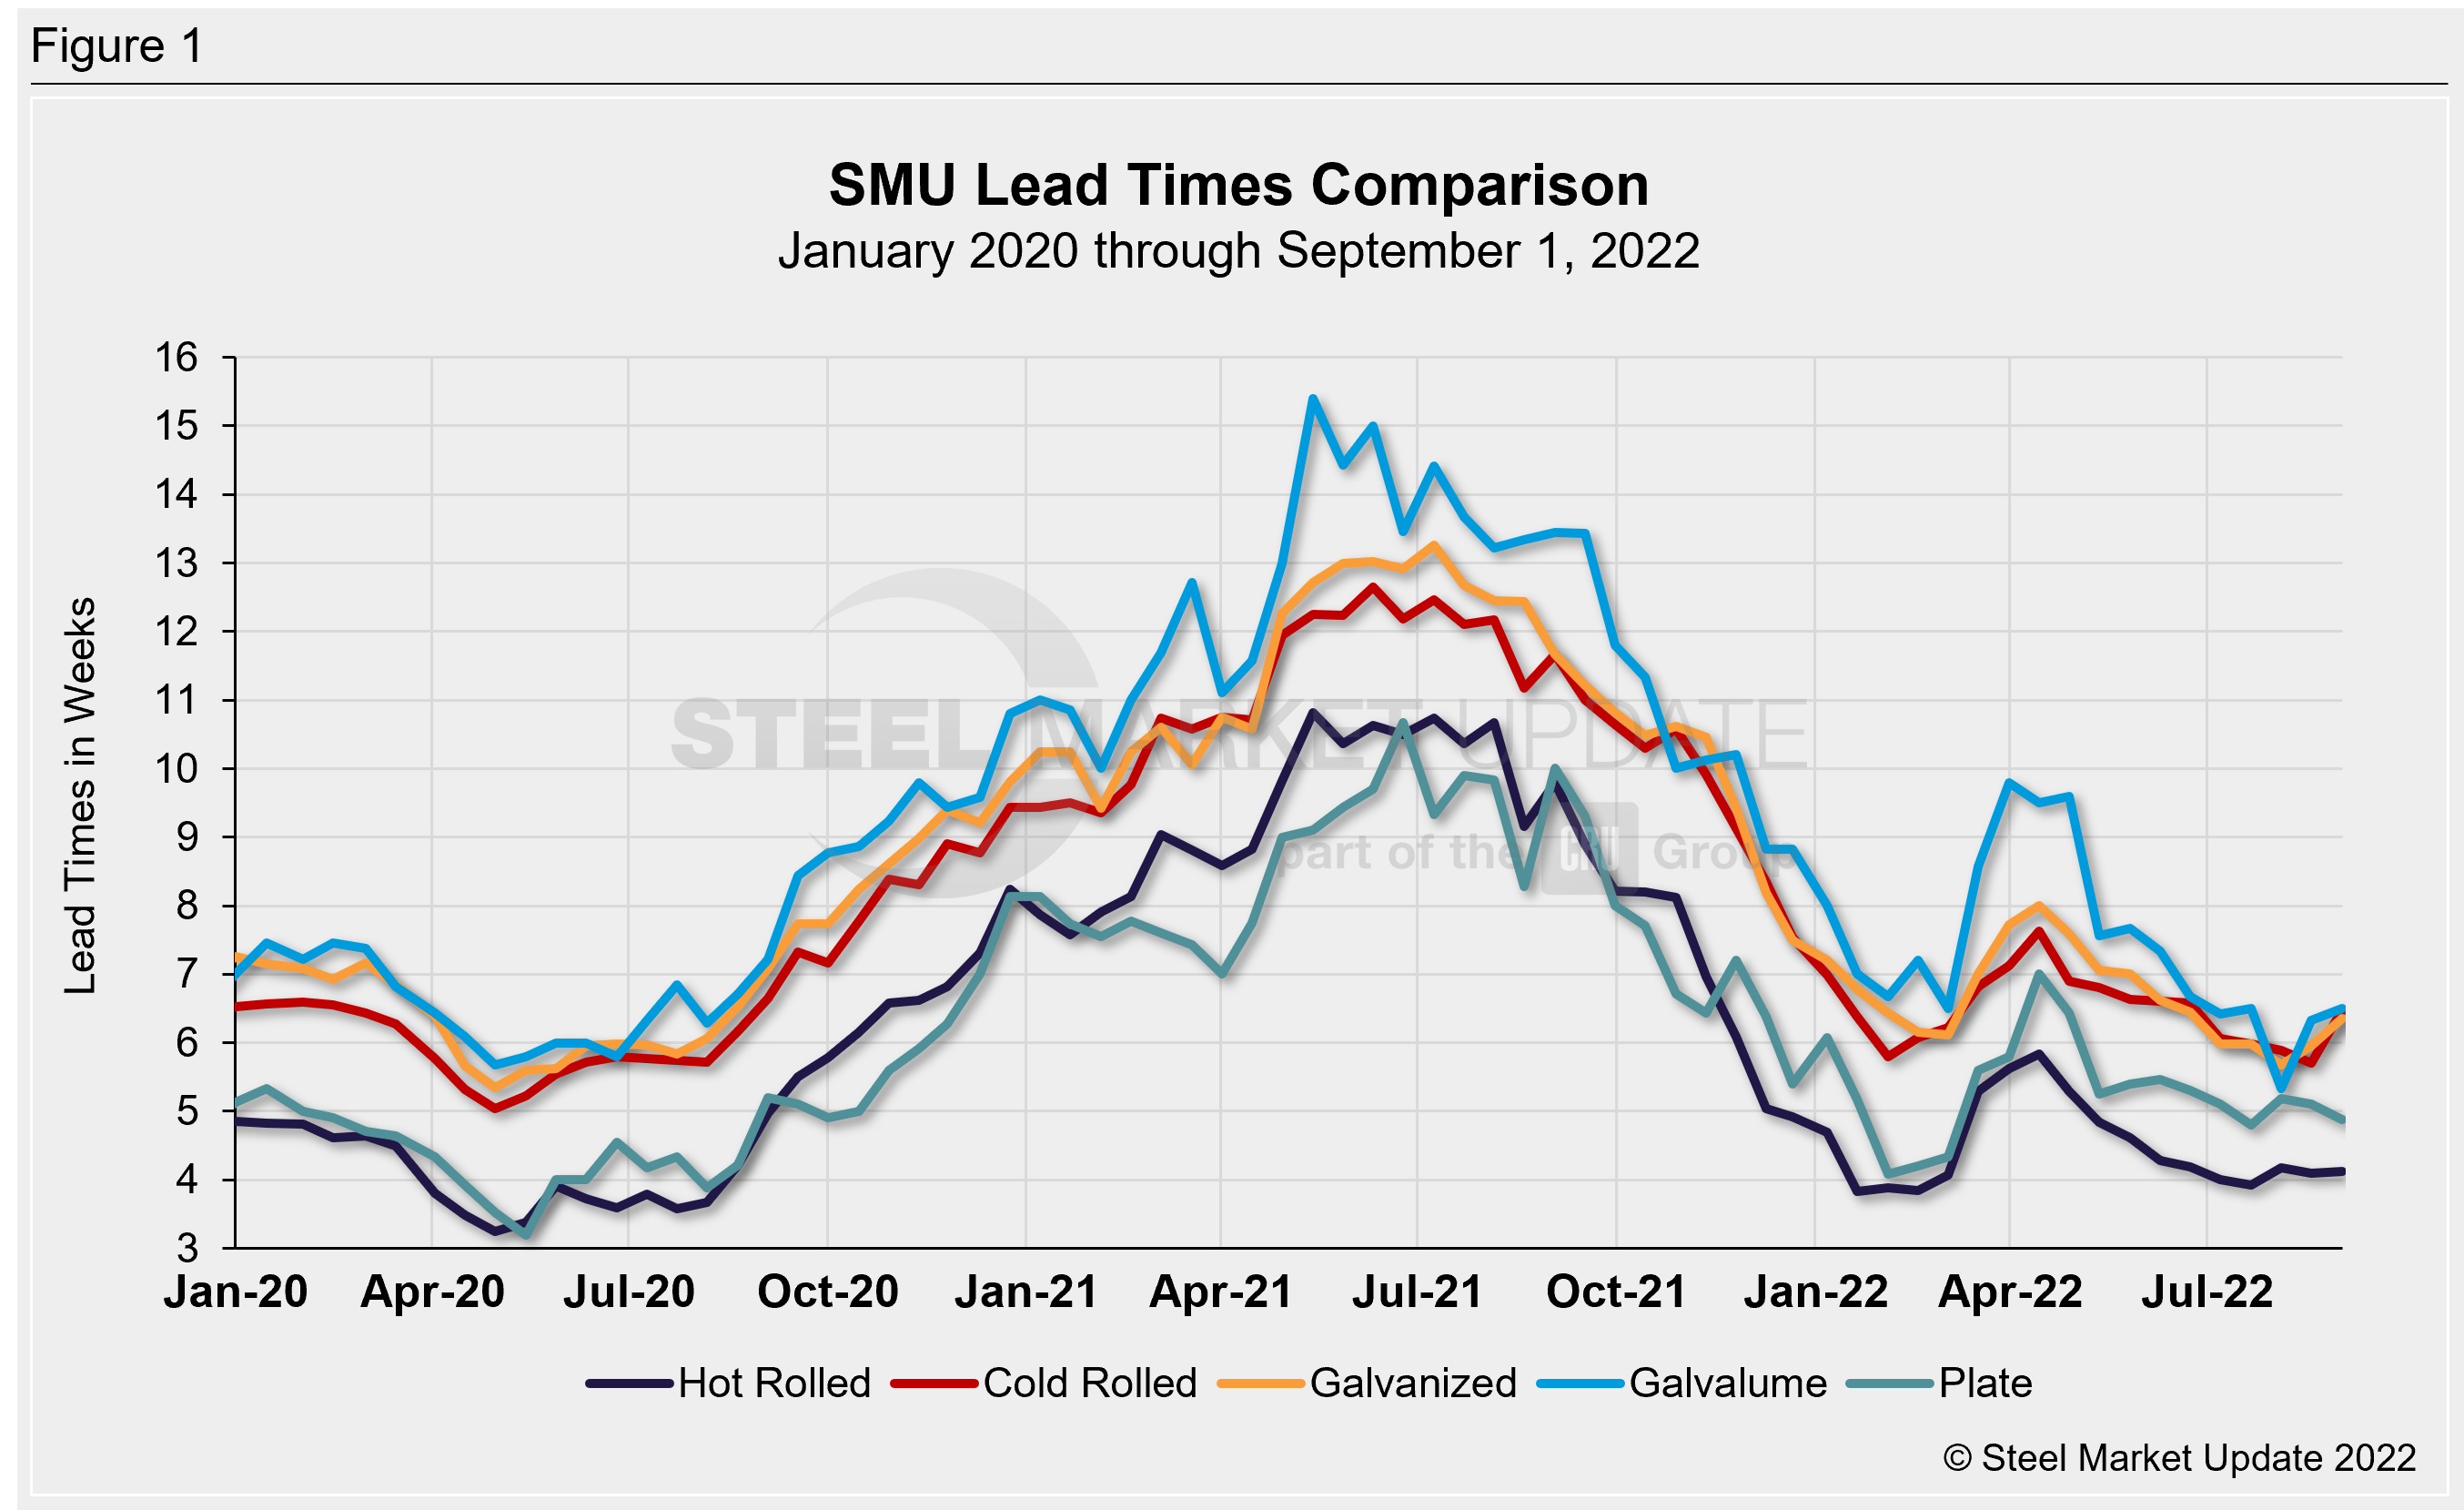
Buyers surveyed this week reported mill lead times ranging from 3–6 weeks for hot rolled, 5–9 weeks for cold rolled, 5–8 weeks for galvanized, 6–7 weeks for Galvalume, and 4–6 weeks for plate.
SMU’s hot rolled lead times held steady from mid-August at 4.1 weeks. HR lead times are down 0.1 weeks compared to one month prior, down from a peak of 5.8 weeks in April. The lowest hot rolled level this year was 3.8 weeks seen in January and in February. The record low in our ~11-year data history was 2.8 weeks in October 2016.
Cold rolled lead times increased 0.8 weeks to 6.5 weeks, rising from the near two-year low seen two weeks prior. Galvanized lead times also extended from their mid-August low, rising 0.4 weeks to 6.4 weeks (our record low was 4.8 weeks in February 2015). The average Galvalume lead time rose 0.2 weeks to 6.5 weeks. Note that Galvalume figures can be more volatile due to the limited size of that market and our smaller sample size. One month ago, Galvalume lead times were 5.3 weeks.
Mill lead times for plate declined by 0.2 weeks to 4.9 weeks. Recall that in mid-July, plate lead times fell to 4.8 weeks, the first time seeing a sub-5-week figure since early March. The lowest plate lead time this year was 4.1 weeks in early February. In our four-year history of plate lead times, the lowest figure we have recorded was 3.2 weeks in May 2020.
Approximately 73% of the executives responding to this week’s questionnaire told SMU they were seeing stable lead times, down from 76% in our previous survey. 19% reported lead times were slipping and 8% said lead times were extending, both relatively unchanged from two weeks prior. Here is what a few of our respondents had to say:
“Availability remains in good levels.”
“They are stable-to-shrinking, which is crazy considering how low they’ve been.”
“Expect to move out a bit in the coming weeks.”
“Extending, increased orders combined with outages.”
“Stable and very short.”
“Very slightly extending.”
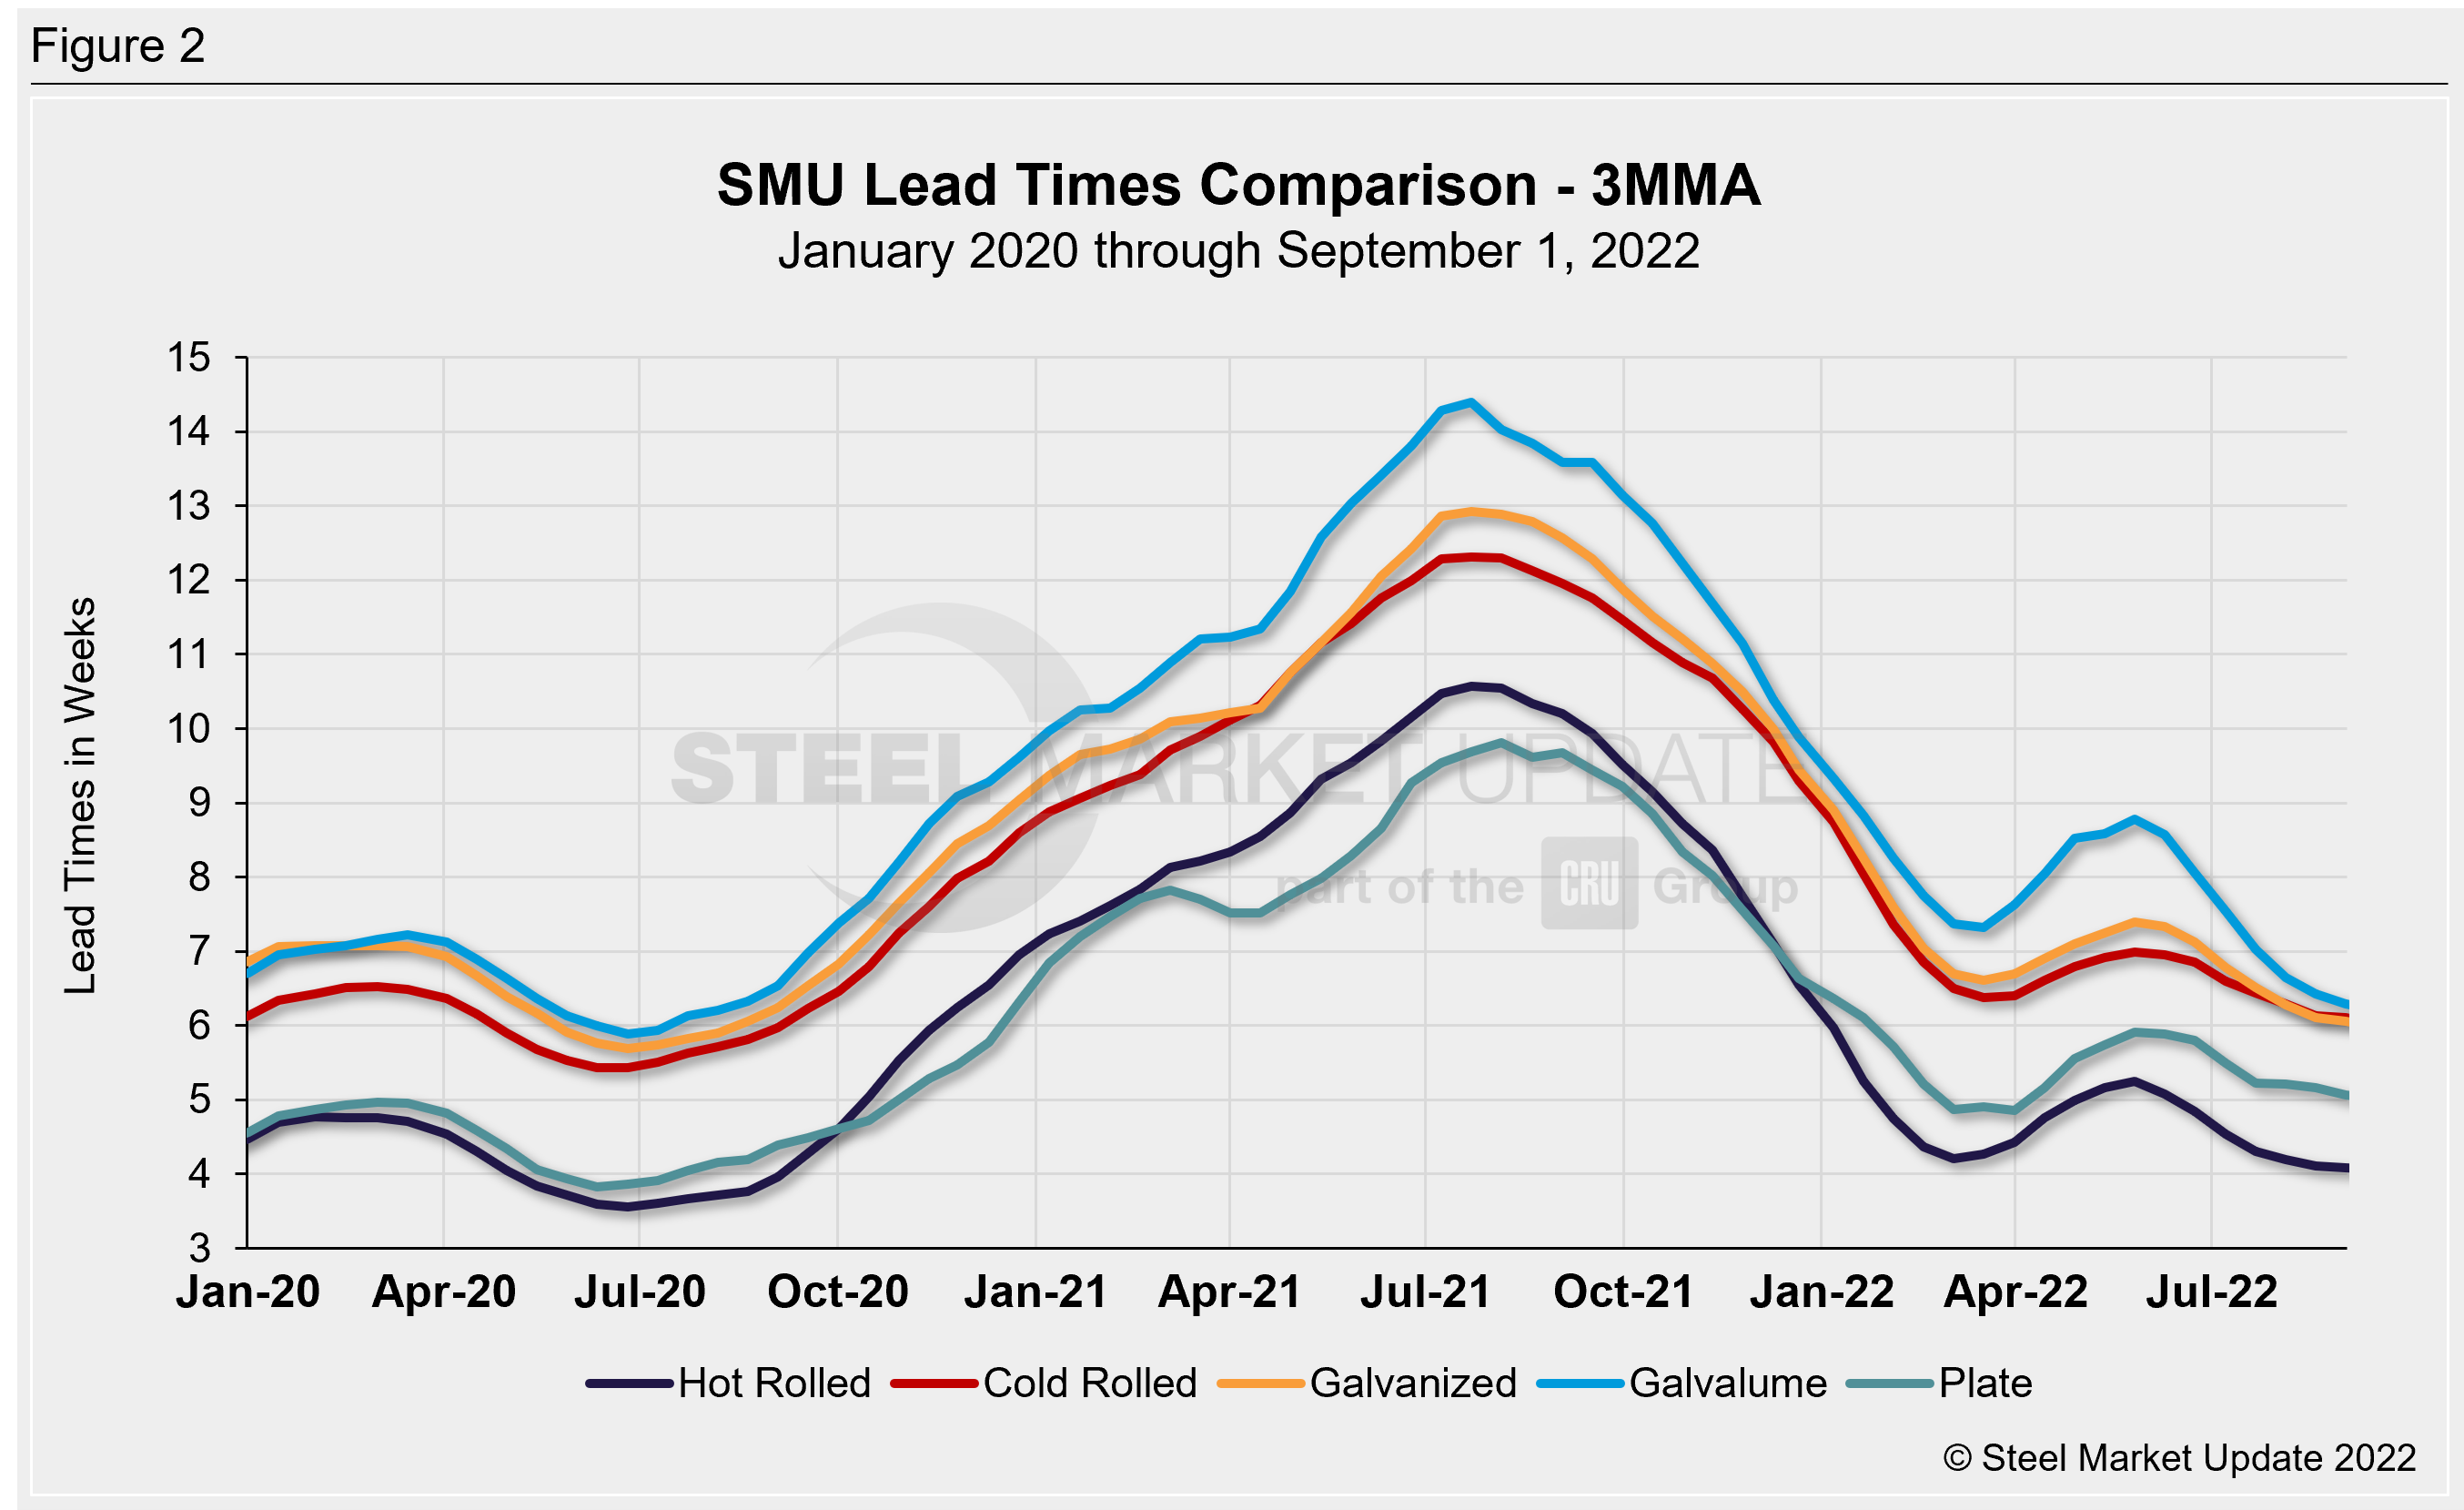
Looking at lead times on a three-month moving average can smooth out the variability in the biweekly readings. As a 3MMA, all products were flat to down 0.1 weeks compared to two weeks prior and down as much as 0.4 weeks compared to early August. The current 3MMA for hot rolled held steady at 4.1 weeks, cold rolled and galvanized remained at 6.1 weeks, Galvalume declined 0.1 weeks to 6.3 weeks, and plate eased 0.1 weeks to 5.1 weeks.
Note: These lead times are based on the average from manufacturers and steel service centers who participated in this week’s SMU market trends analysis. SMU measures lead times as the time it takes from when an order is placed with the mill to when the order is processed and ready for shipping, not including delivery time to the buyer. Our lead times do not predict what any individual may get from any specific mill supplier. Look to your mill rep for actual lead times. To see an interactive history of our Steel Mill Lead Times data, visit our website here.
By Brett Linton, Brett@SteelMarketUpdate.com


