

Market Data

August 19, 2022
SMU Steel Demand Index: Indecision Is King, For Now
Written by David Schollaert
Steel Market Update is pleased to share this new Premium content—an index comparing lead time and demand data—with Executive members. For information on upgrading to a Premium-level subscription, email Info@SteelMarketUpdate.com.
Apparent demand for flat-rolled steel in the US was sideways in our mid-August reading. The lack of change in the index highlights the current state of flux in hot-rolled coil (HRC) prices and lead times, according to Steel Market Update’s (SMU) latest survey results.
The lack of clarity across the market and the economy seems to be driving the state of indecision being felt in the industry.
Sentiment has been a little up and down of late. Mills seem eager to set a price floor—particularly for HRC—and are less willing to negotiate. Spreads in some cases remain at historic levels, while lead times have held or are modestly extending.
And the economy is giving no indication of where we’re going. Though the unemployment rate is now back to its pre-pandemic level and July’s job report provided a surprising boost, headwinds are just as notable. Second quarter gross domestic product fell to a -0.9% annualized pace, and inflation is running at a 40-year high of 8.5%.
Cue the mounting pile of indecision.
July’s reading was mostly stable after falling seven points to start the month. August’s results are shaping up similarly. Following an early index rebound of six points to kick off the month, the lack of clear direction looks to result in an unchanged reading for the month, though still pointing towards down demand.
SMU’s Steel Demand Index, which compares lead times and demand, is a diffusion index derived from our market surveys. This index continues to precede lead times, which is notable given that lead times are typically a leading indicator of steel price moves.
An index score above 50 indicates an increase in demand, and a score below 50 indicates a decrease.
The latest demand index registered 39 on Aug. 18, unchanged versus the previous reading on Aug. 4. (SMU sends out full surveys to the market every two weeks.) Though static, the result continues to underscore a weakening market that is still reporting down demand.
The result was up just six points from a month ago, which was the lowest reading since 2020. But the latest score is down 14 points from mid-May—the last time the index was above 50. Detailed side-by-side in Figure 1 are both the historical views and the latest steel demand index.
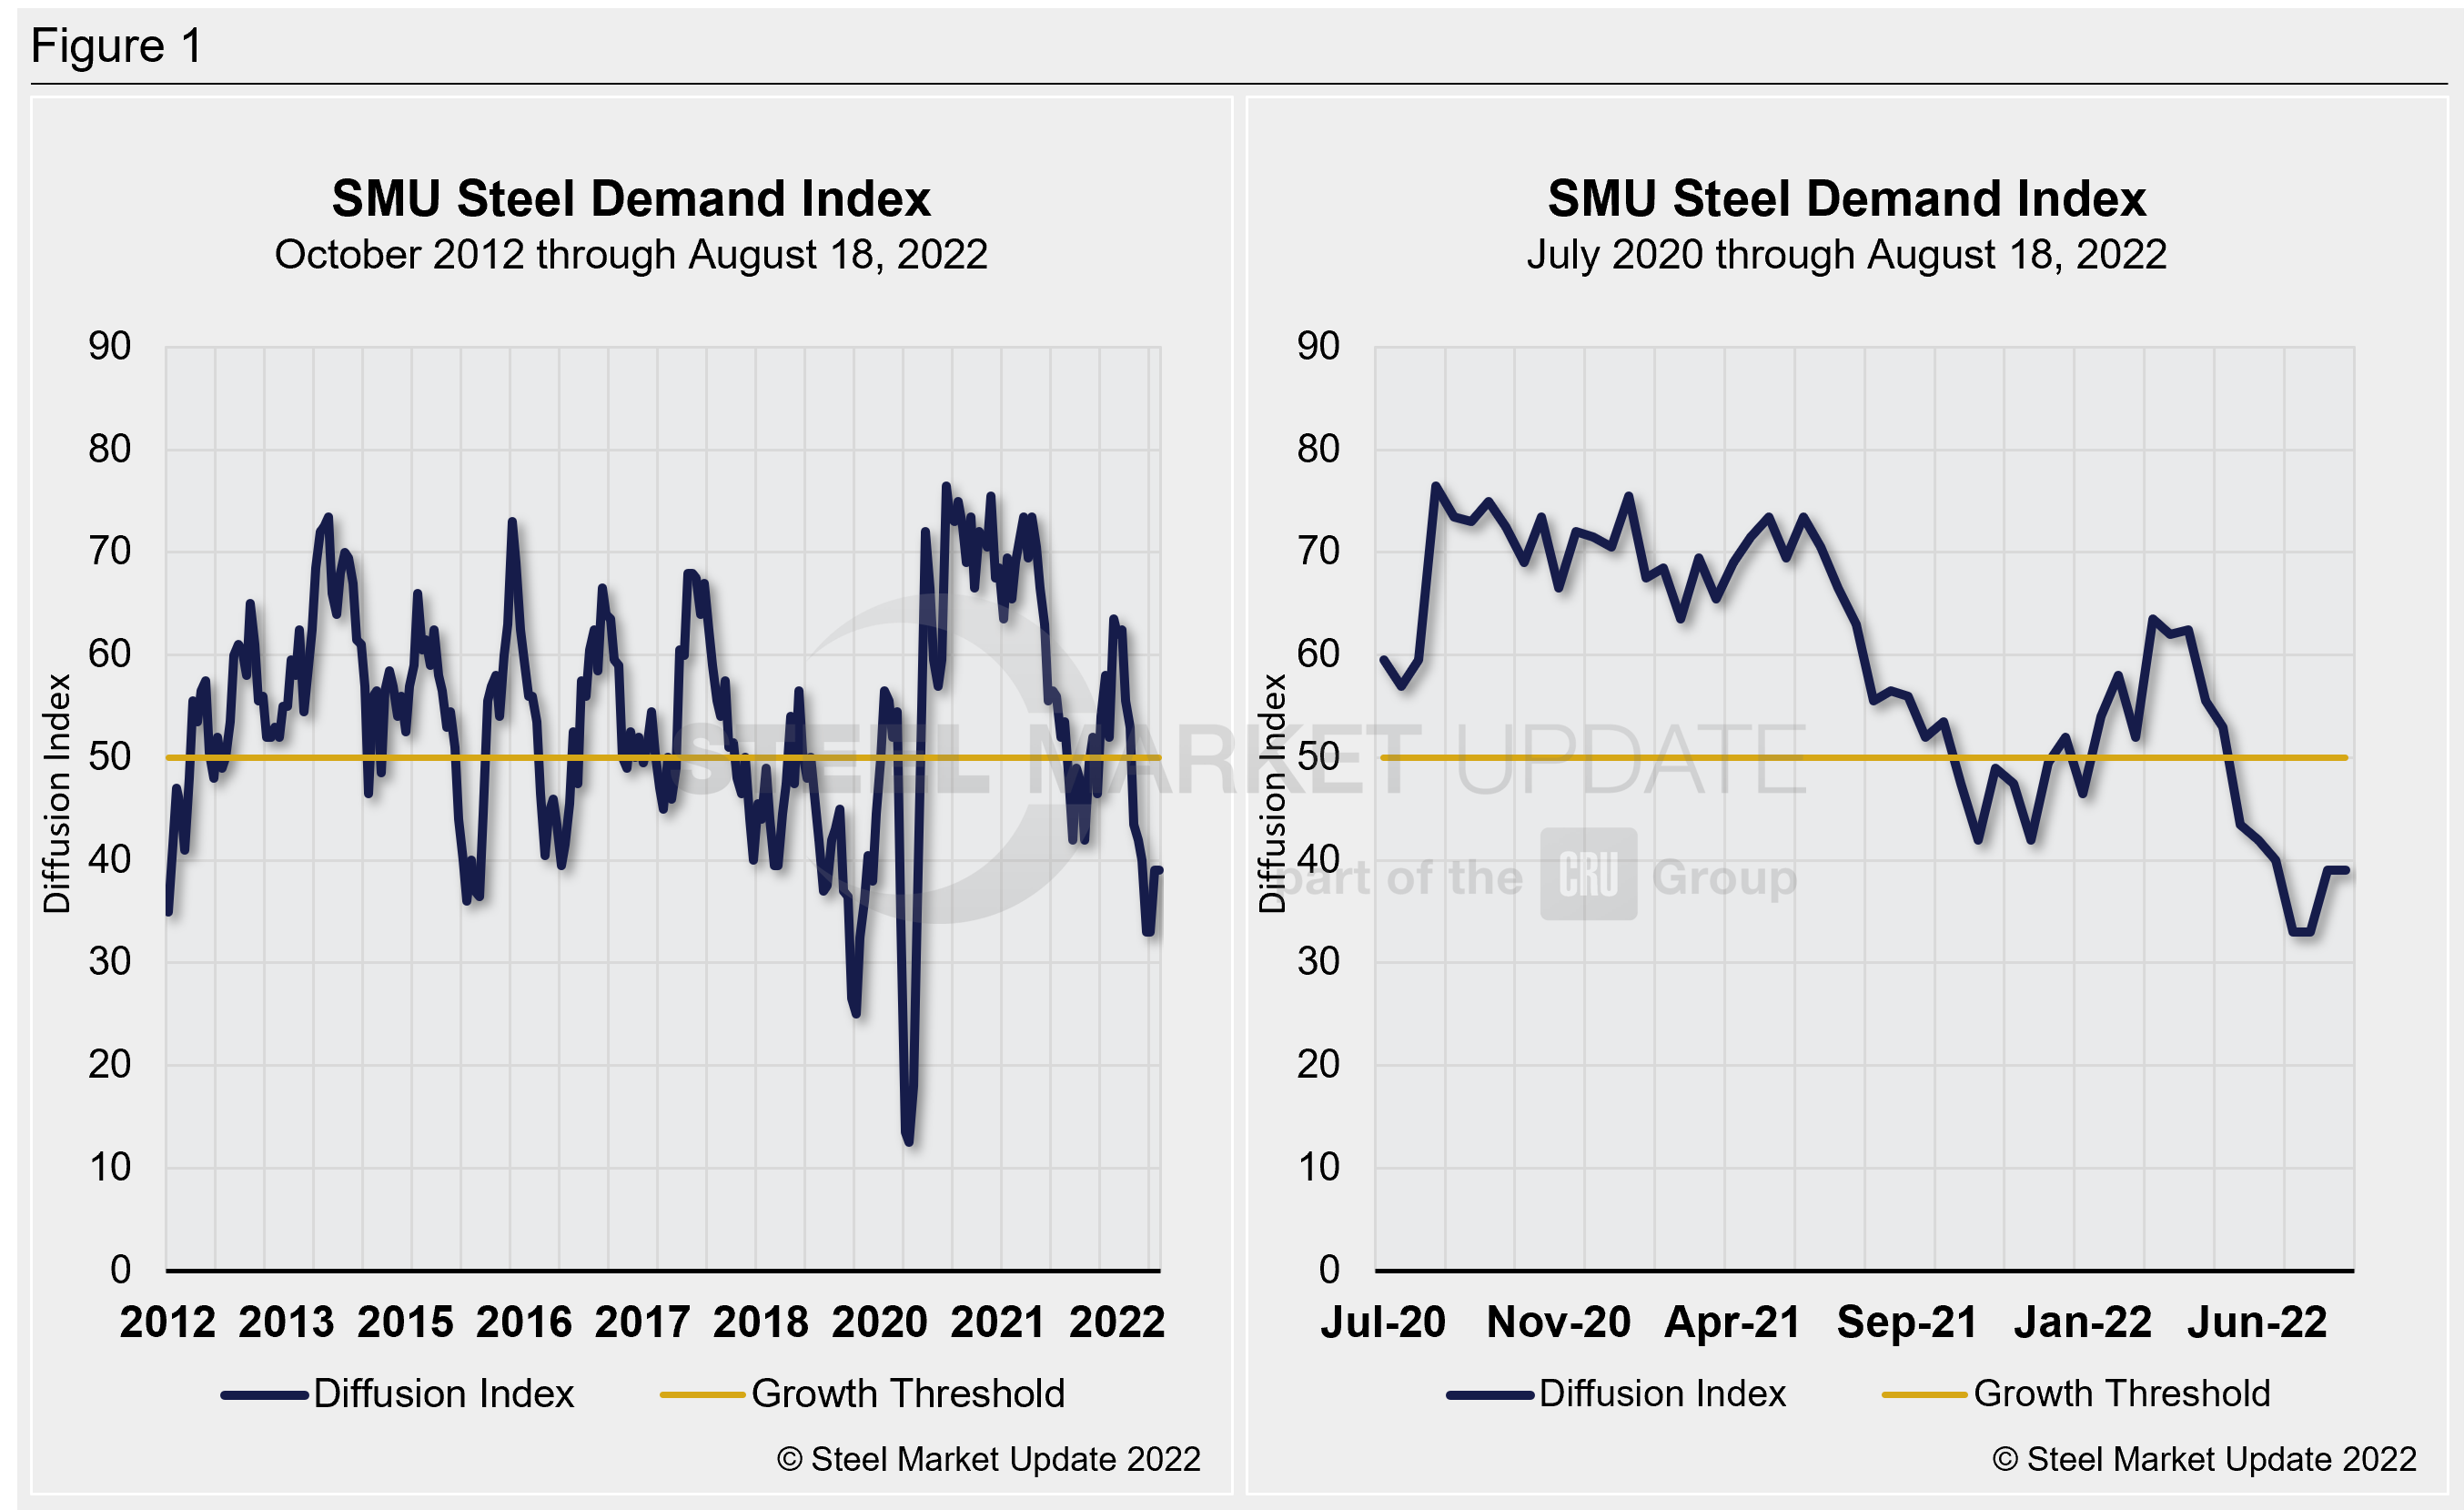
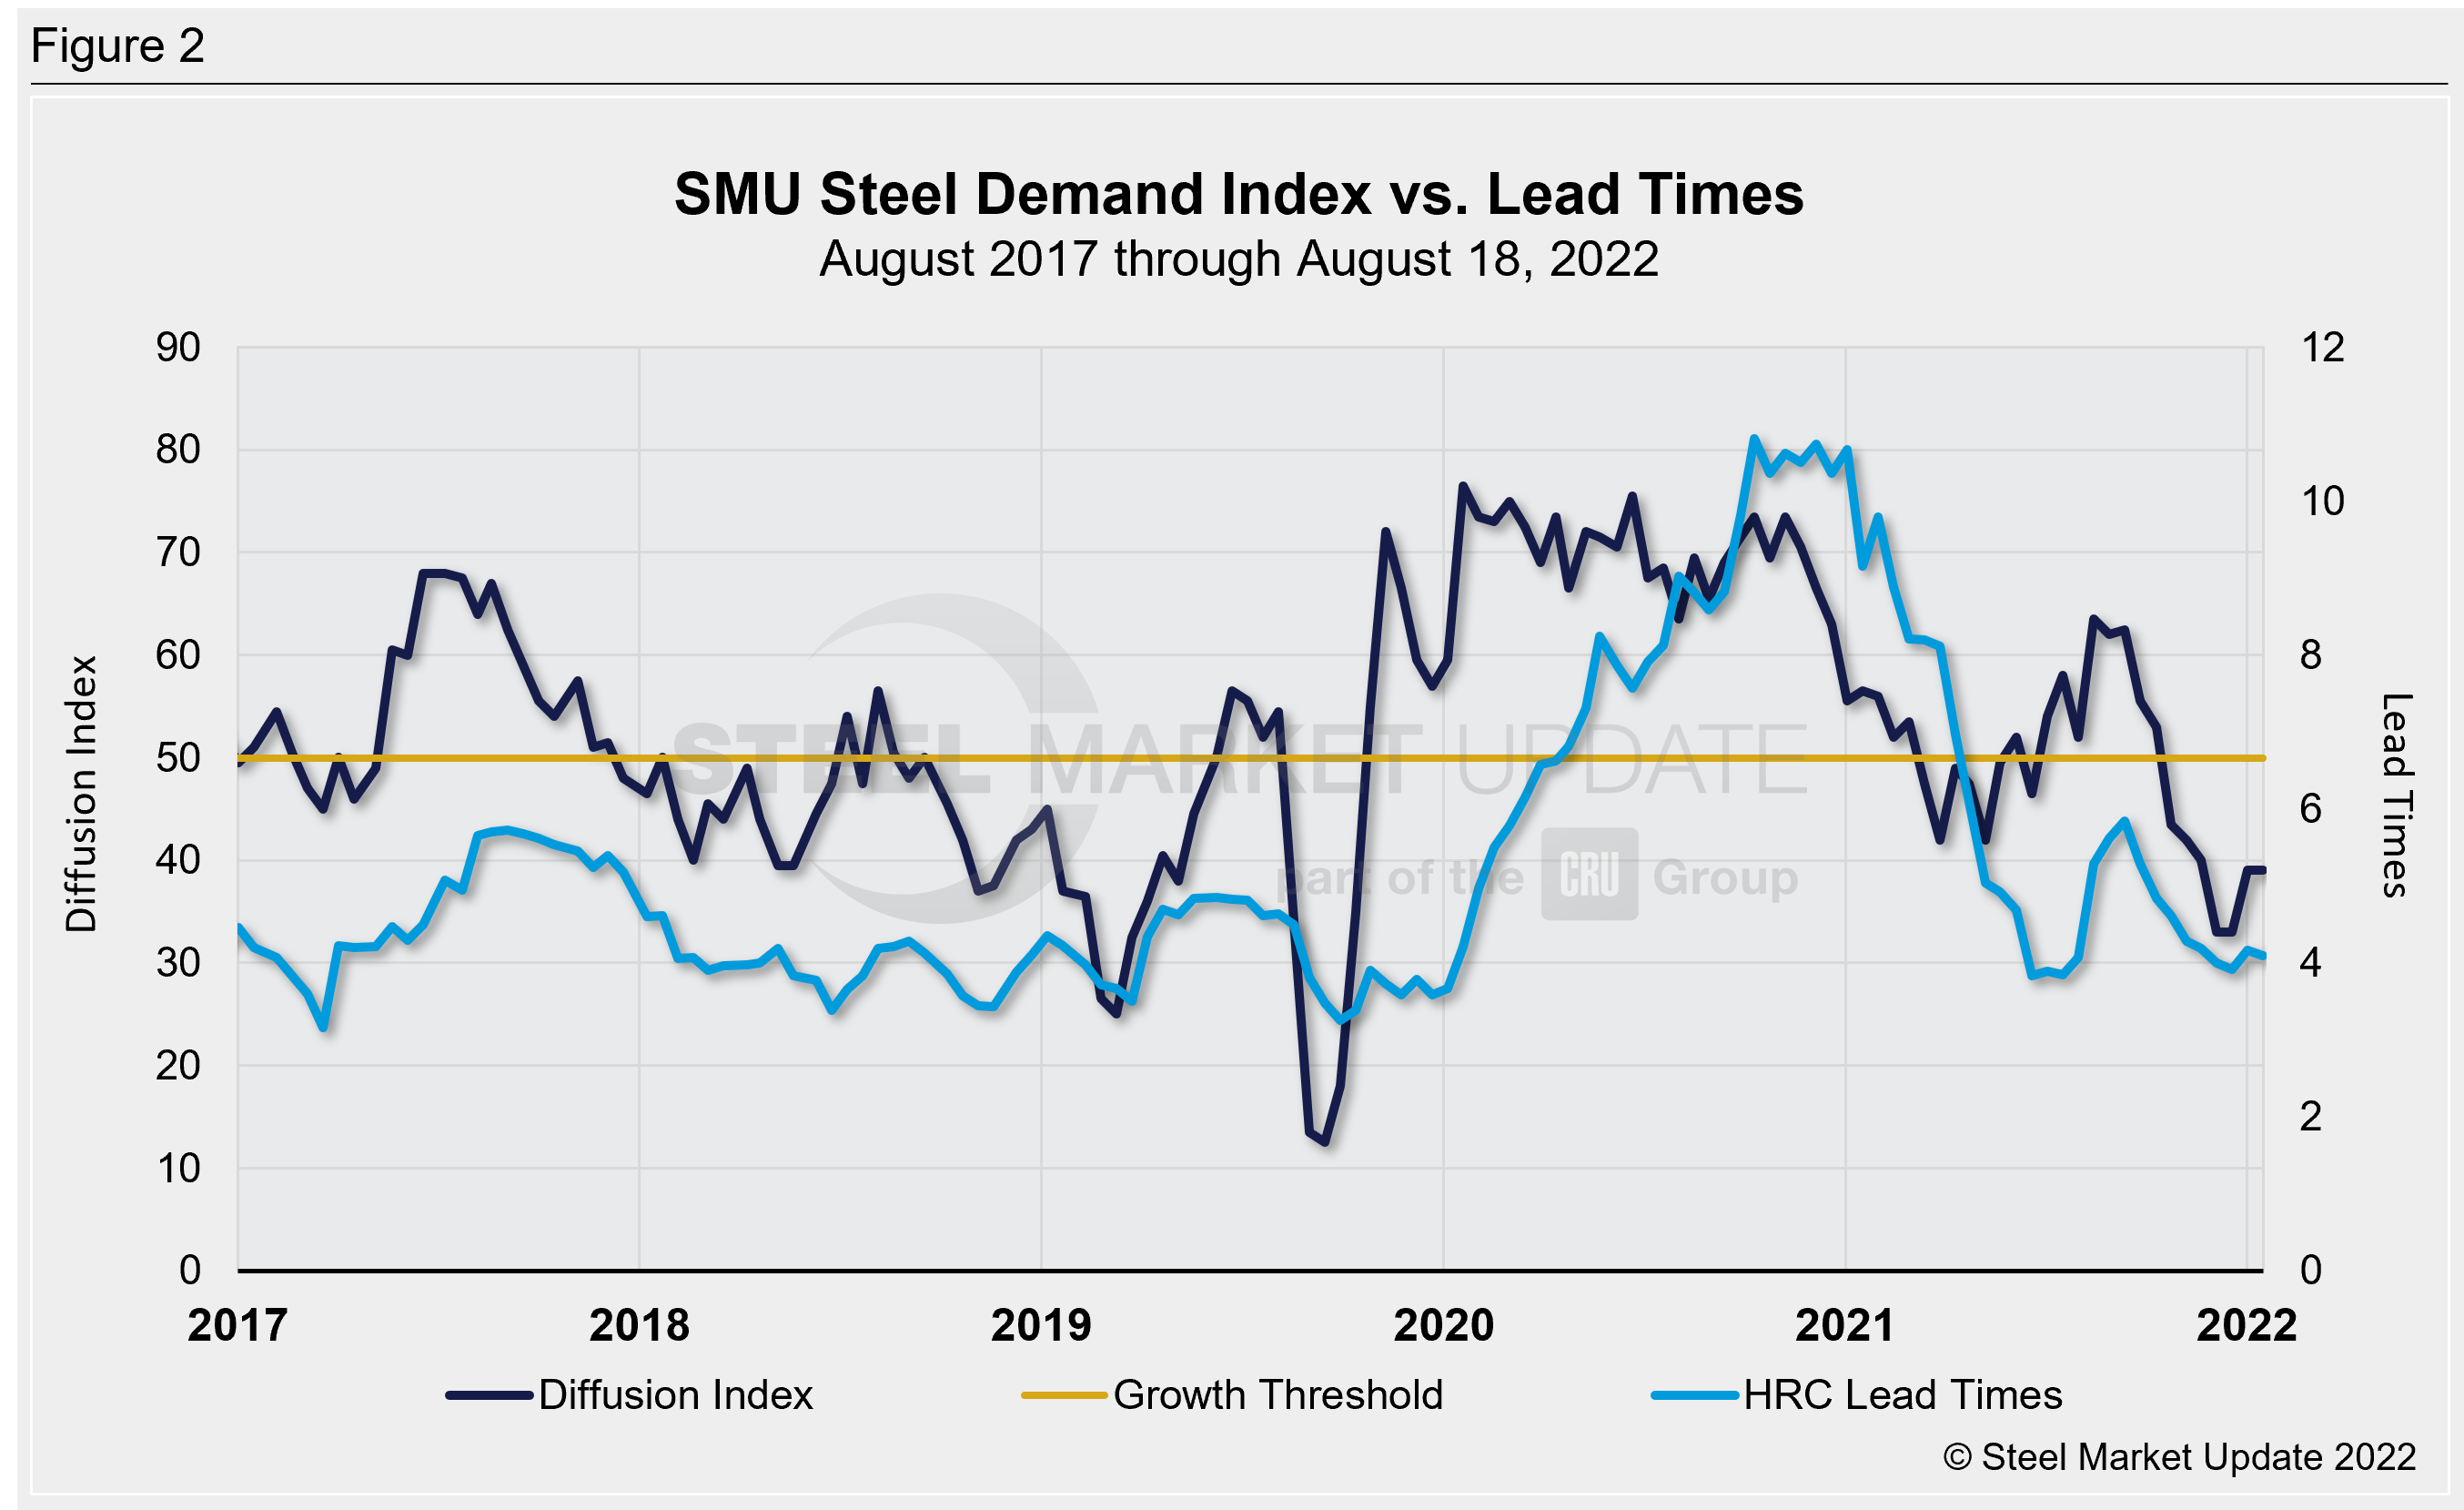
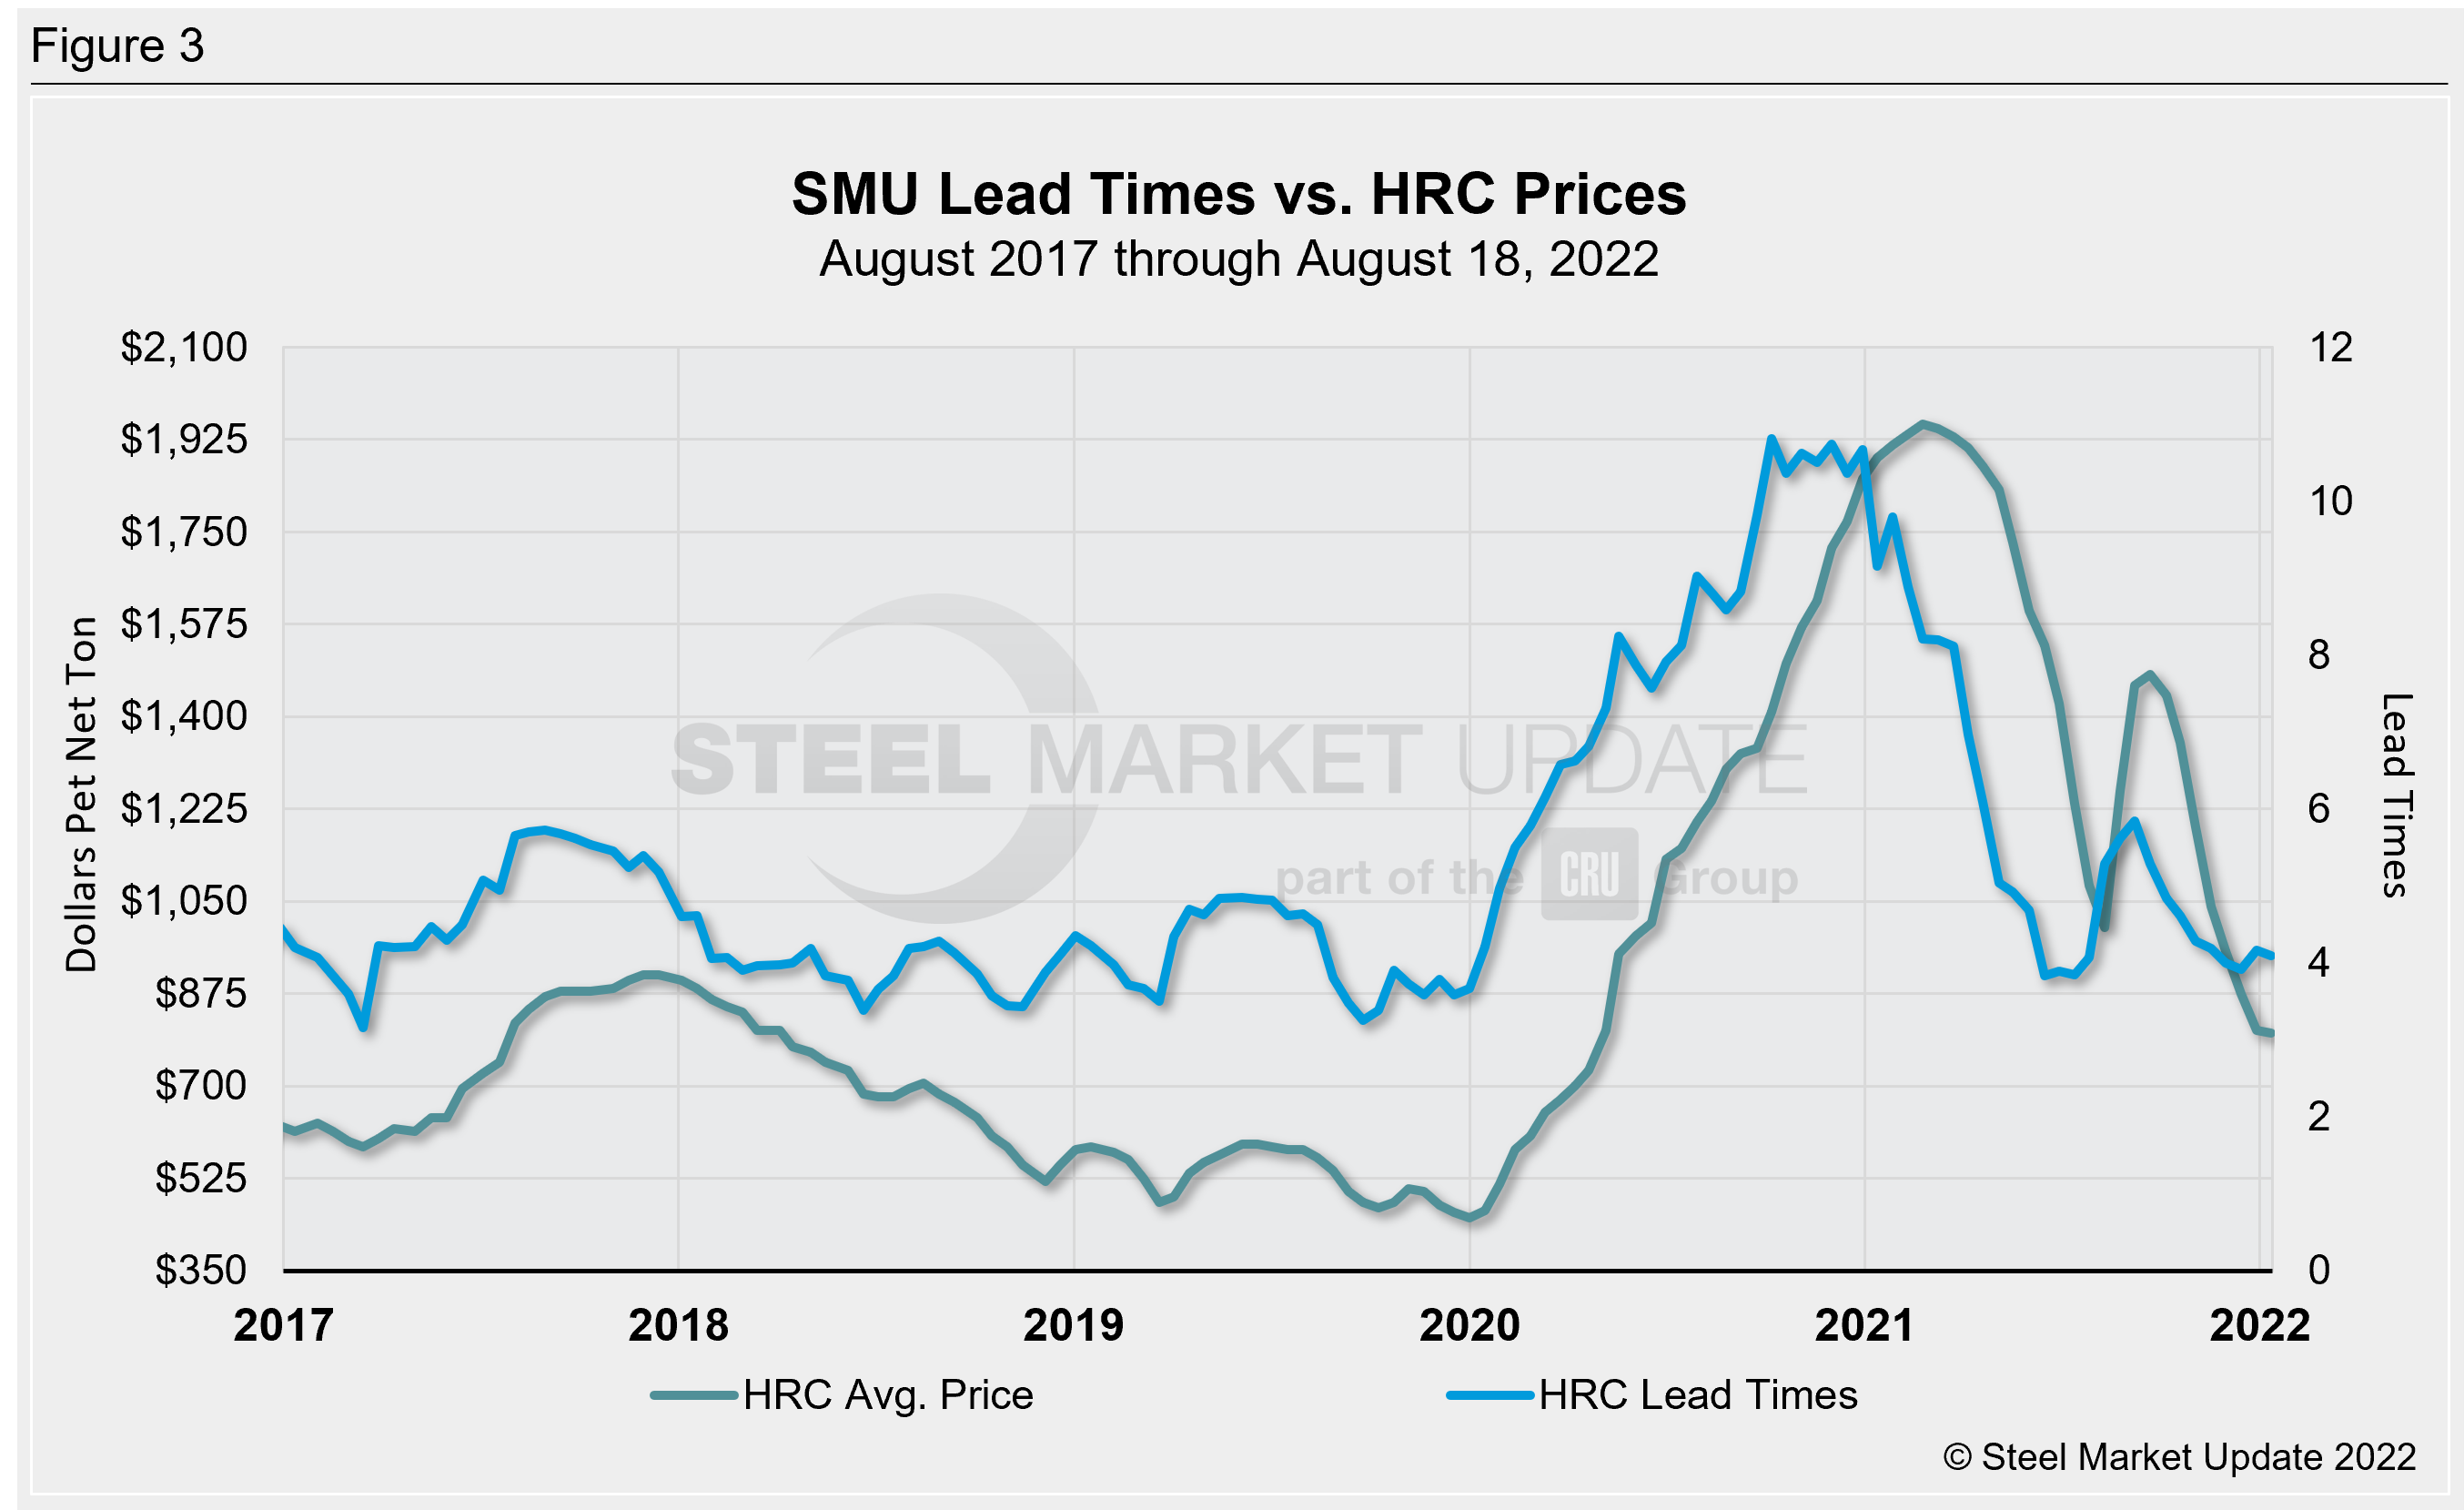
Steel buyers—mainly OEMs and service centers—are still reporting weakening demand in August, a result that maybe has been compounded by a traditional summer slowdown. The apparent lack of direction is likely to be short-lived, though. SMU’s demand diffusion index has rarely remained in a holding pattern for long, and for nearly a decade has consistently preceded steel mill lead times (Figure 2 – featuring the past five years). Historically, SMU’s lead times have also been a leading indicator for flat-rolled steel prices, and HRC prices in particular (Figures 3 – featuring the past five years).
SMU’s average HRC price now stands at $800 per ton ($40/cwt), according to our latest check of the market on Aug. 16. Our overall average is down $20 per ton week-on-week, as recent mill increases seem to lack staying power.
Our hot rolled lead time averages 4.09 weeks, a marginal decline from 4.17 weeks in early August. Overall, lead times are still low and not far from 2022 lows of ~3.8 weeks in late January and February. But they remain significantly higher than the record low in our ~11-year data history, which was 2.8 weeks in October 2016.
These shifting markers certainly underscore the indecisive or static sentiment and index currently in play. With much uncertainty still ahead, including the possibility of labor turmoil and a fraught economy in the near-term, further fluctuations are likely.
The takeaway: Mills continue to report steady demand and remain overall bullish about their future prospects. They point towards a rebounding automotive sector and expected growth from energy and infrastructure demand as catalyst drivers for steel. Respondents to our surveys, mostly steel consumers, reported mixed results on the periphery, some improved sentiment, and others declining. The bulk of respondents though, near two-thirds, continue to report static sentiment. So, while demand may still be down in our index, our latest data suggest that the recent shift may have been a blip and is likely to remain unchanged to down for the time being. The back third of the year will certainly draw much attention as we try to identify the sector’s direction.
Note: Demand, lead times and prices are based on the average data from manufacturers and steel service centers who participate in SMU market trends analysis surveys. Our demand and lead times do not predict prices but are leading indicators of overall market dynamics and potential pricing dynamics. Look to your mill rep for actual lead times and prices.
By David Schollaert, David@SteelMarketUpdate.com


