

Market Data

October 2, 2022
Slight Uptick in SMU's Steel Buyers Sentiment Index
Written by Brett Linton
Steel Market Update’s (SMU) Steel Buyers Sentiment Index saw a slight uptick this week. The modest gain follows a double-digit decline two weeks prior.
Industry sentiment has trended downward since May, with continued concerns about demand, profitability, high-cost inventory, and recession. Despite the increased gloom, SMU’s Future Steel Buyers Sentiment Index also bounced back this week, rising 12 points from mid-September – which saw one of the lowest readings in the past two years.
SMU’s Buyers Sentiment Index aims to measure how steel buyers and sellers feel about their company’s ability to be successful not only today but also three to six months into the future. We poll hundreds of steel buyers every other week regarding sentiment, with a data history going back to 2008.
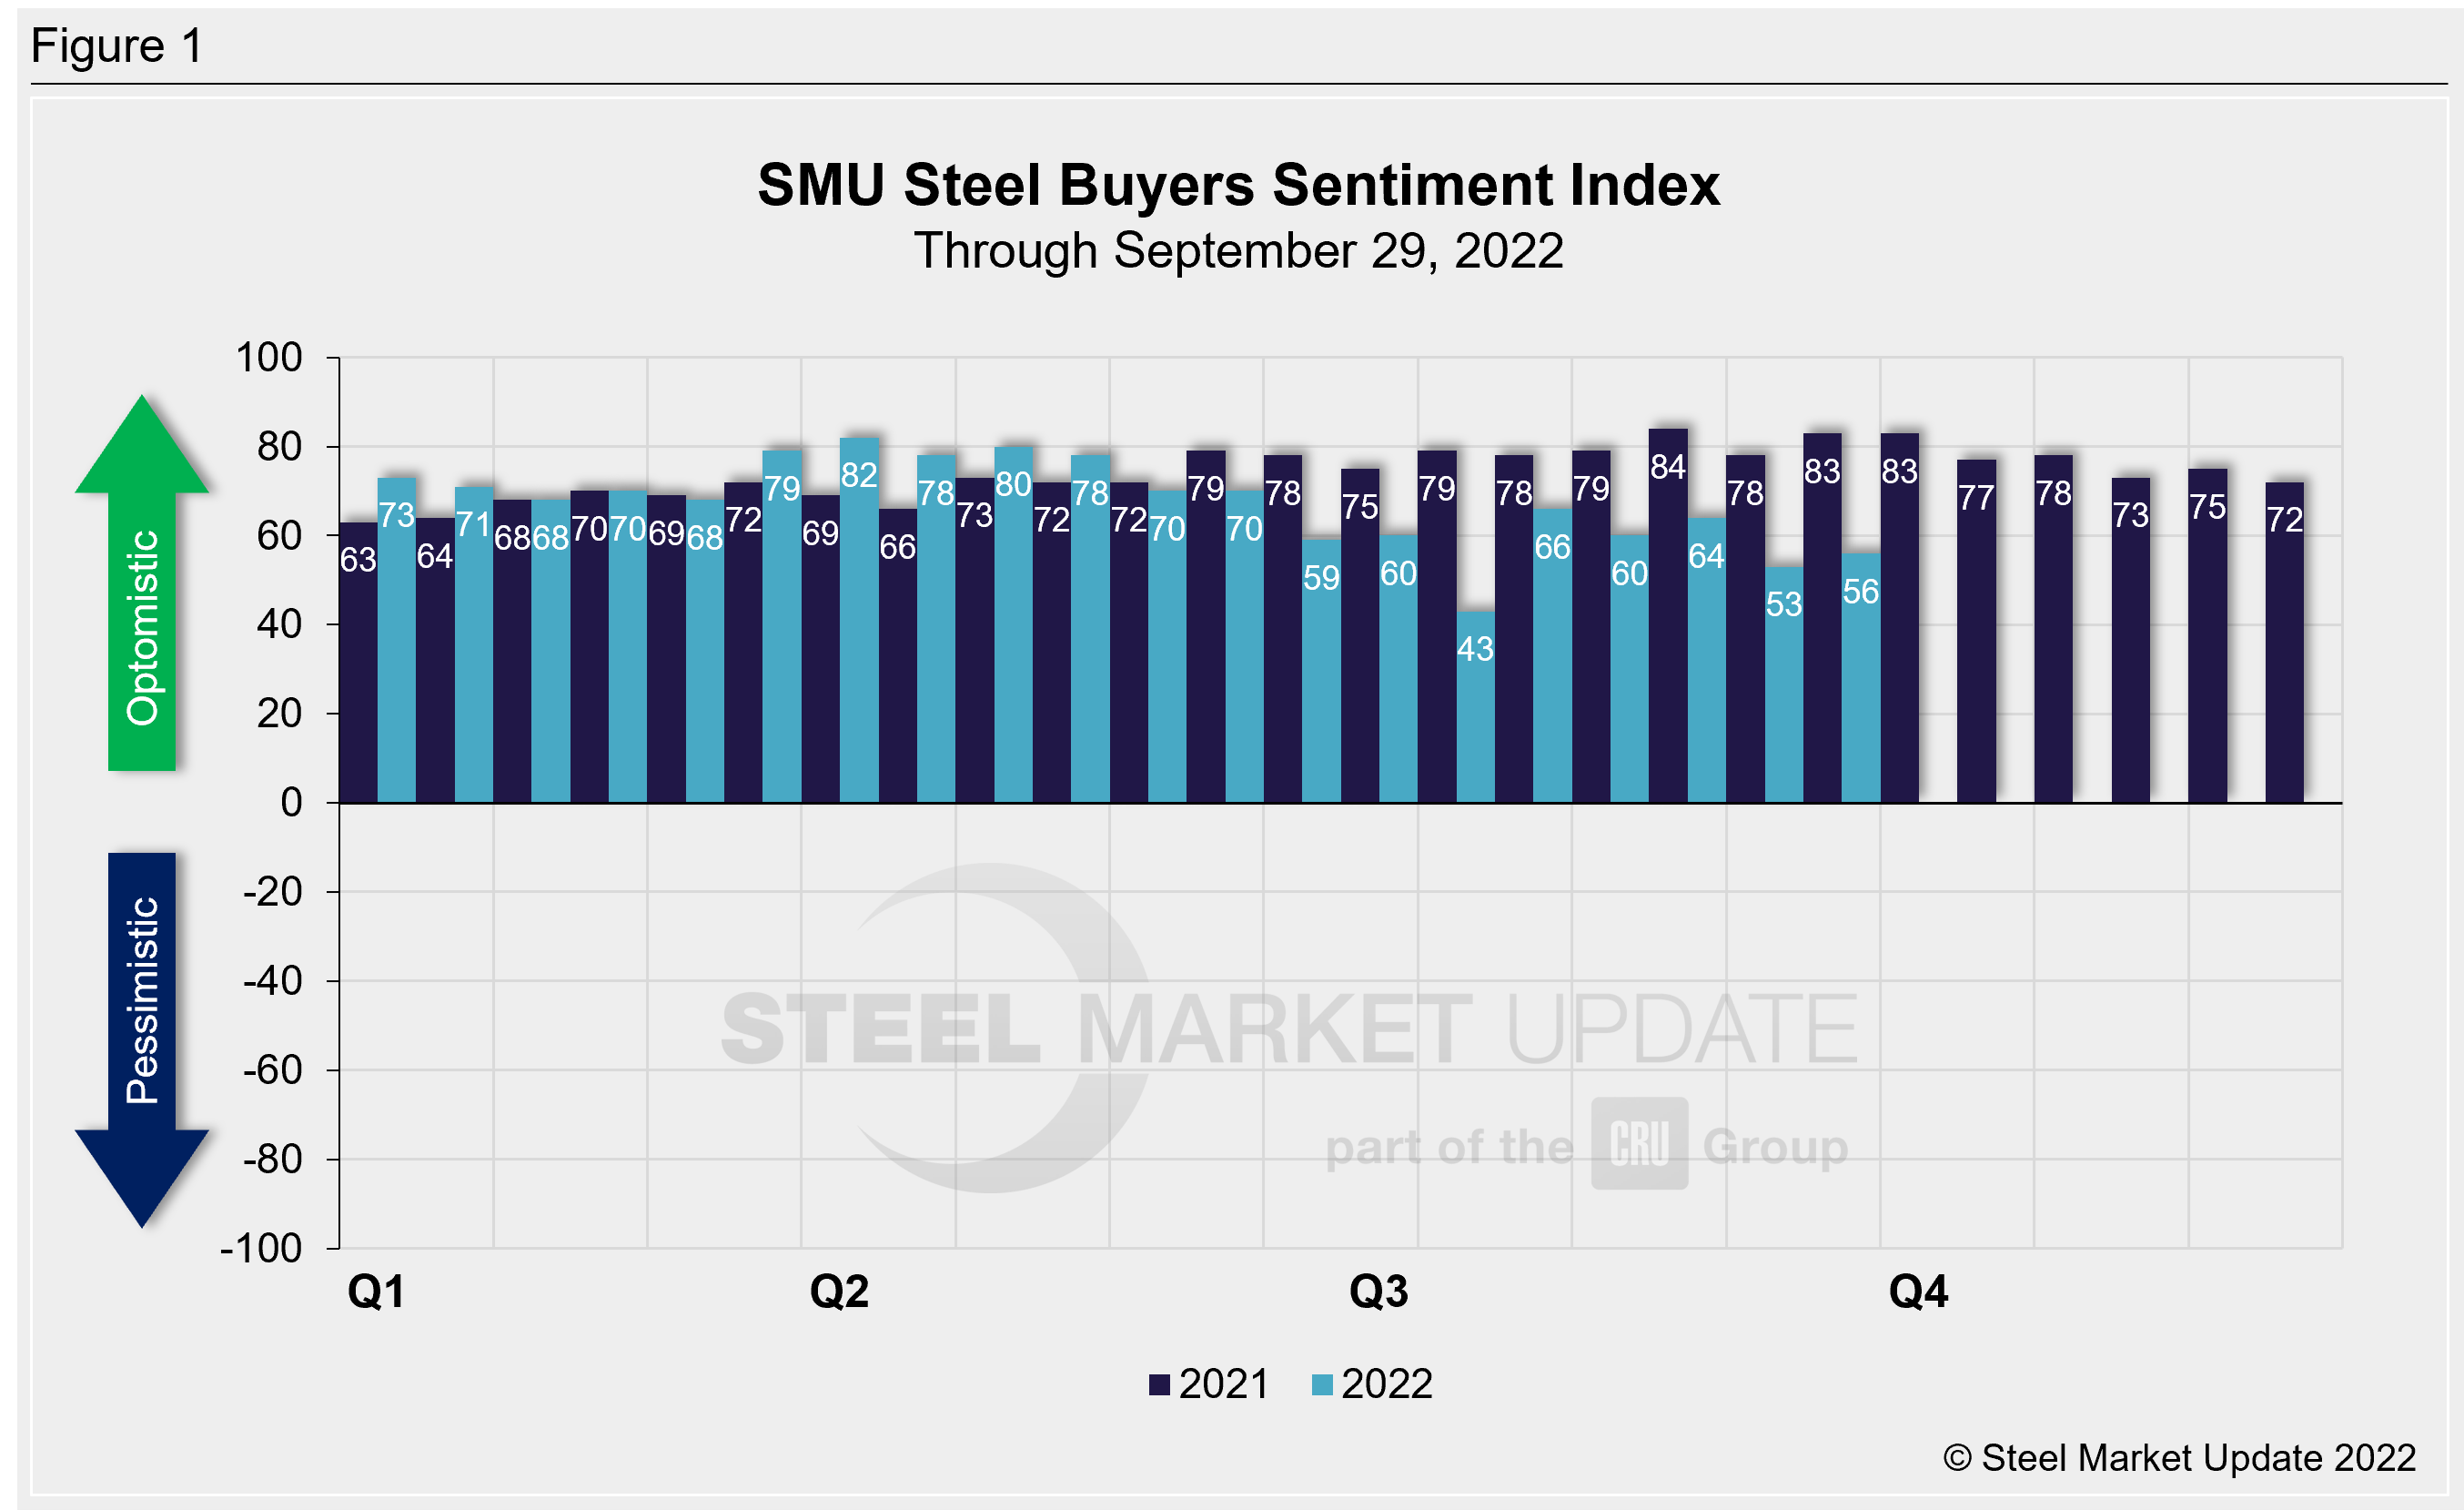
SMU’s Buyers Sentiment Index rose to +56 through the end of last week, up three points from our previous market check, but down eight points compared to one month ago (Figure 1). Recall that Buyers Sentiment has bounced around in recent months. Sentiment slipped to +43 in mid-July, the lowest level seen since August 2020, before rebounding in early August. Our Buyers Sentiment Index peaked at +82 in March of this year.
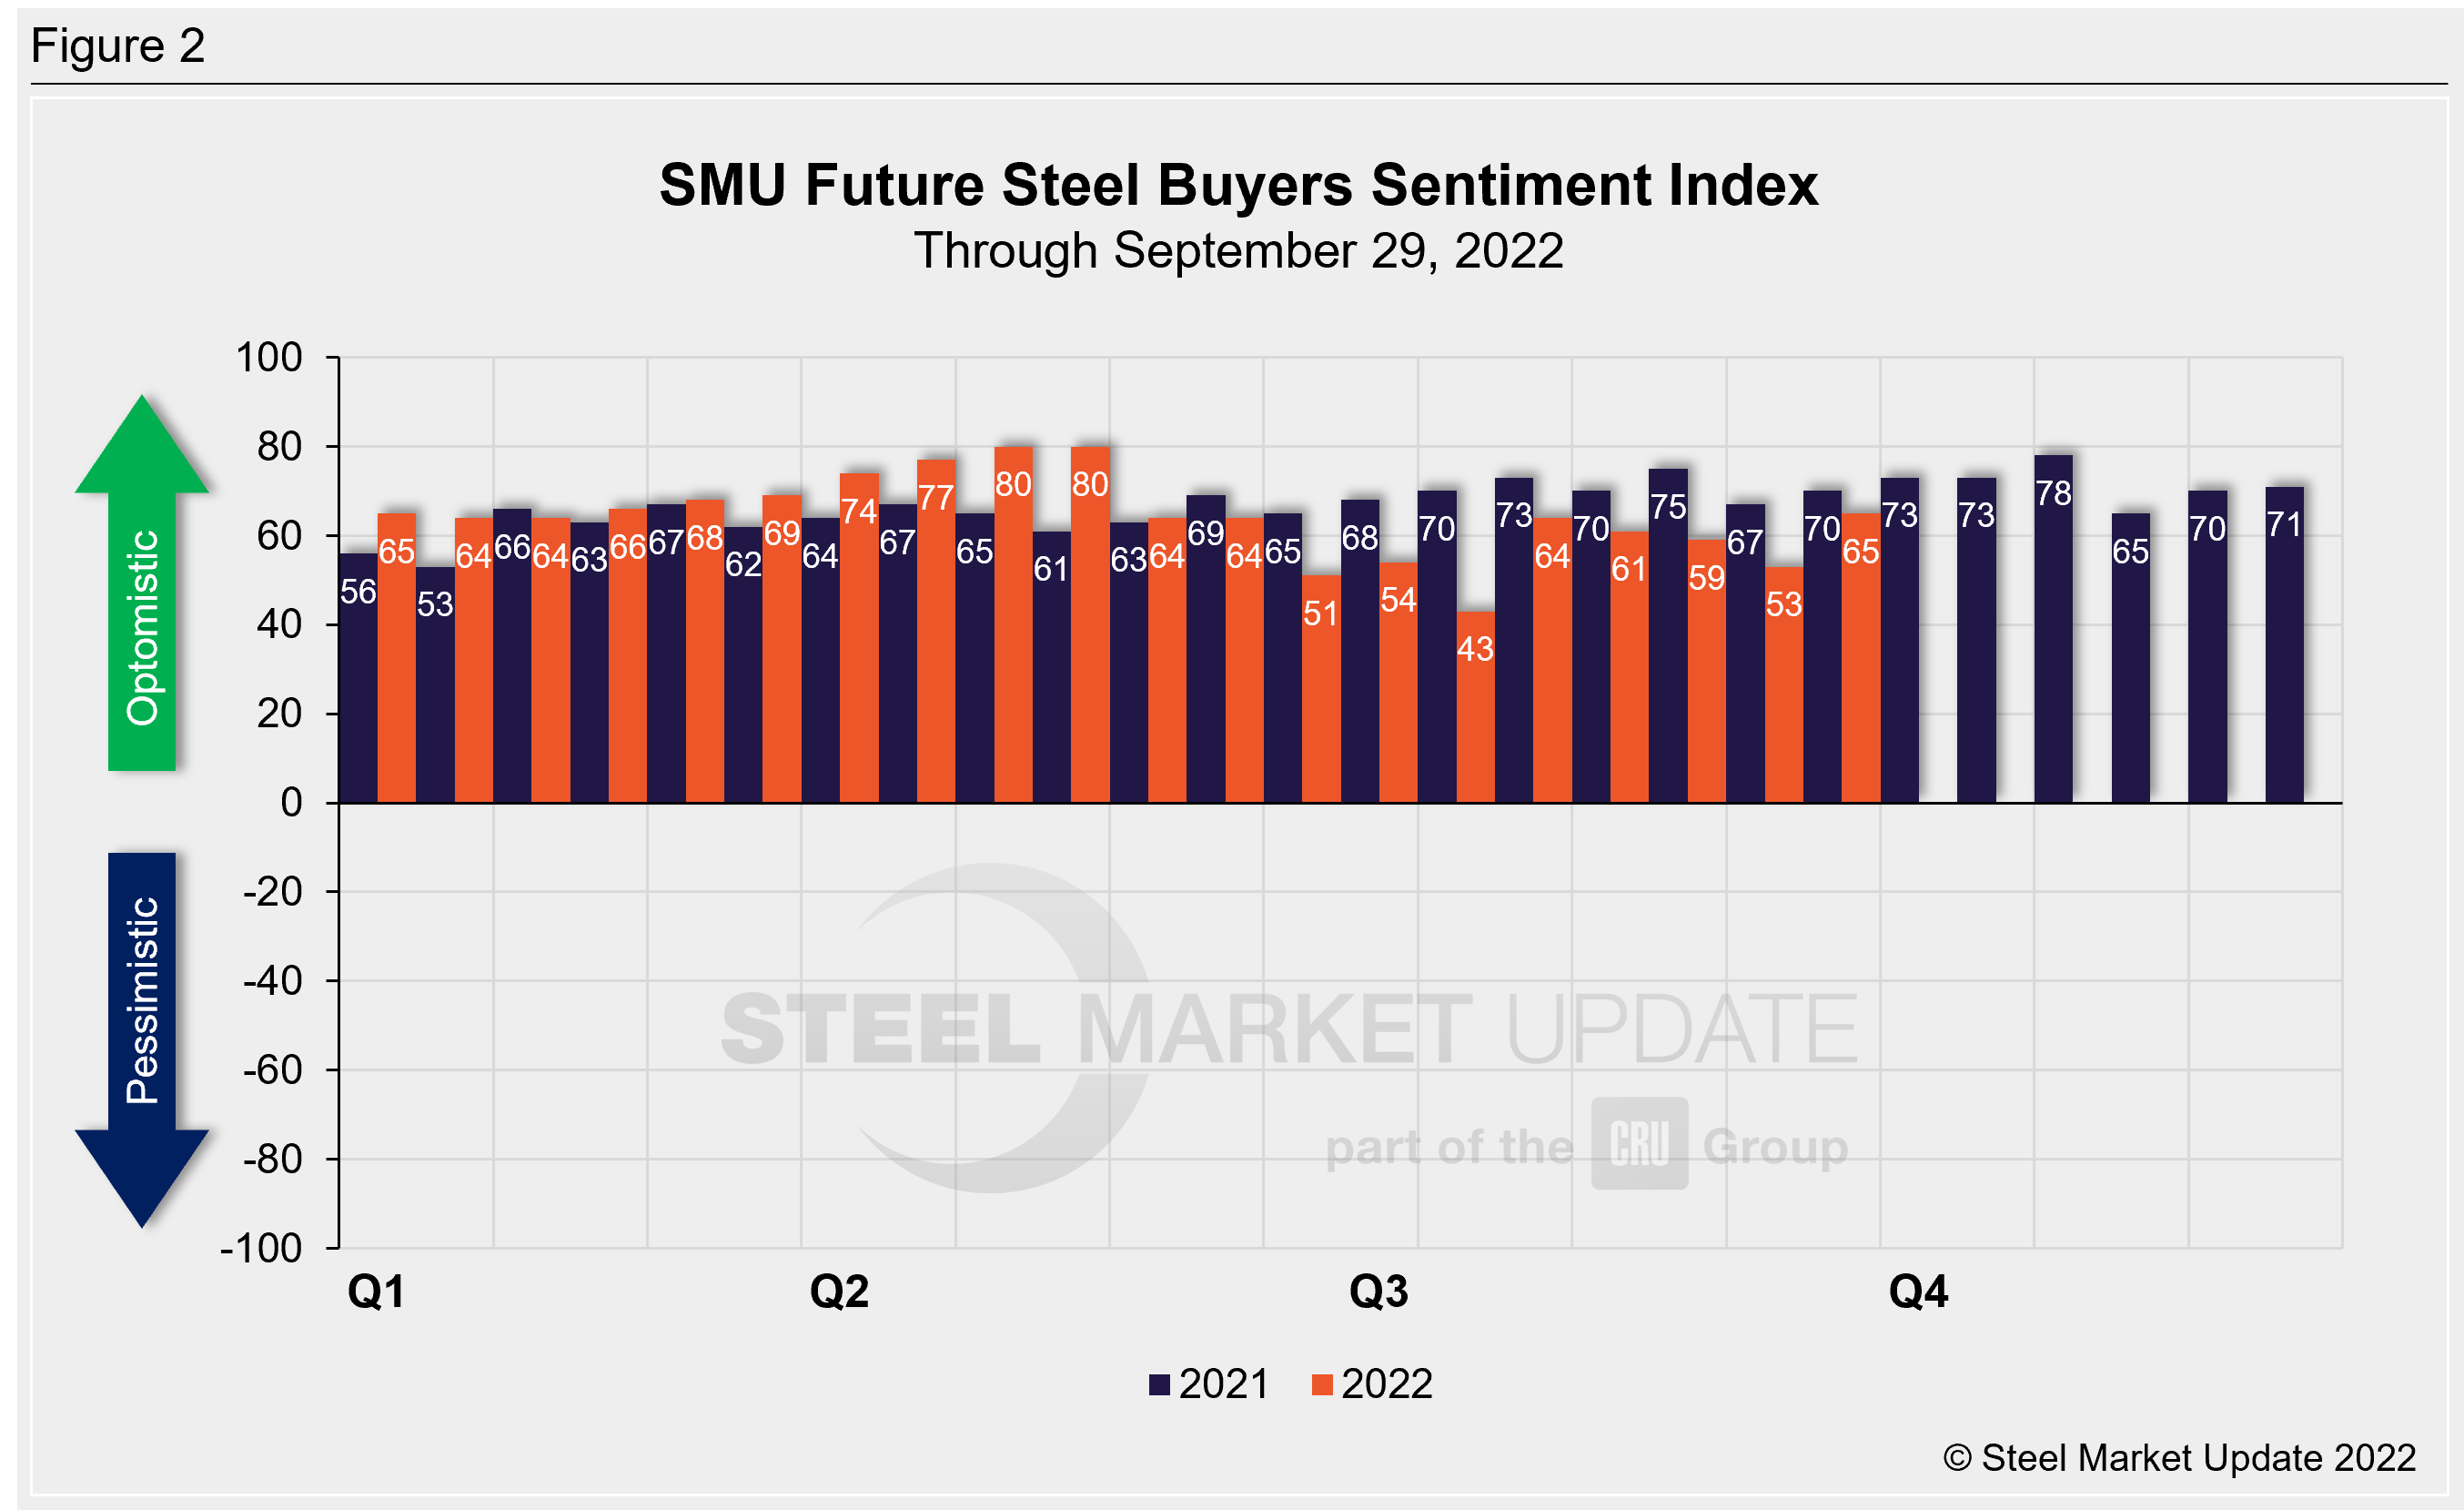
SMU’s Future Buyers Sentiment Index rose twelve points compared to our previous survey. Future Buyers Sentiment, which measures buyers’ feelings about business conditions three to six months in the future, now stands at +65, up six points from levels one month prior (Figure 2). In mid-July, our Future Sentiment Index had fallen to near a two-year low at +43. Like current sentiment, Future Sentiment also bounced back in early August. Earlier this year, we saw the highest Future Sentiment readings in our 13.5-year history: late April and early May both registered +80.
Recall that when steel prices were peaking a little over one year ago, Current Sentiment had soared to an all-time high of +84, while Future Sentiment hit a 2021 peak two months later at +78. The lowest levels over the past decade both occurred in April 2020, at -8 and +10 respectively.
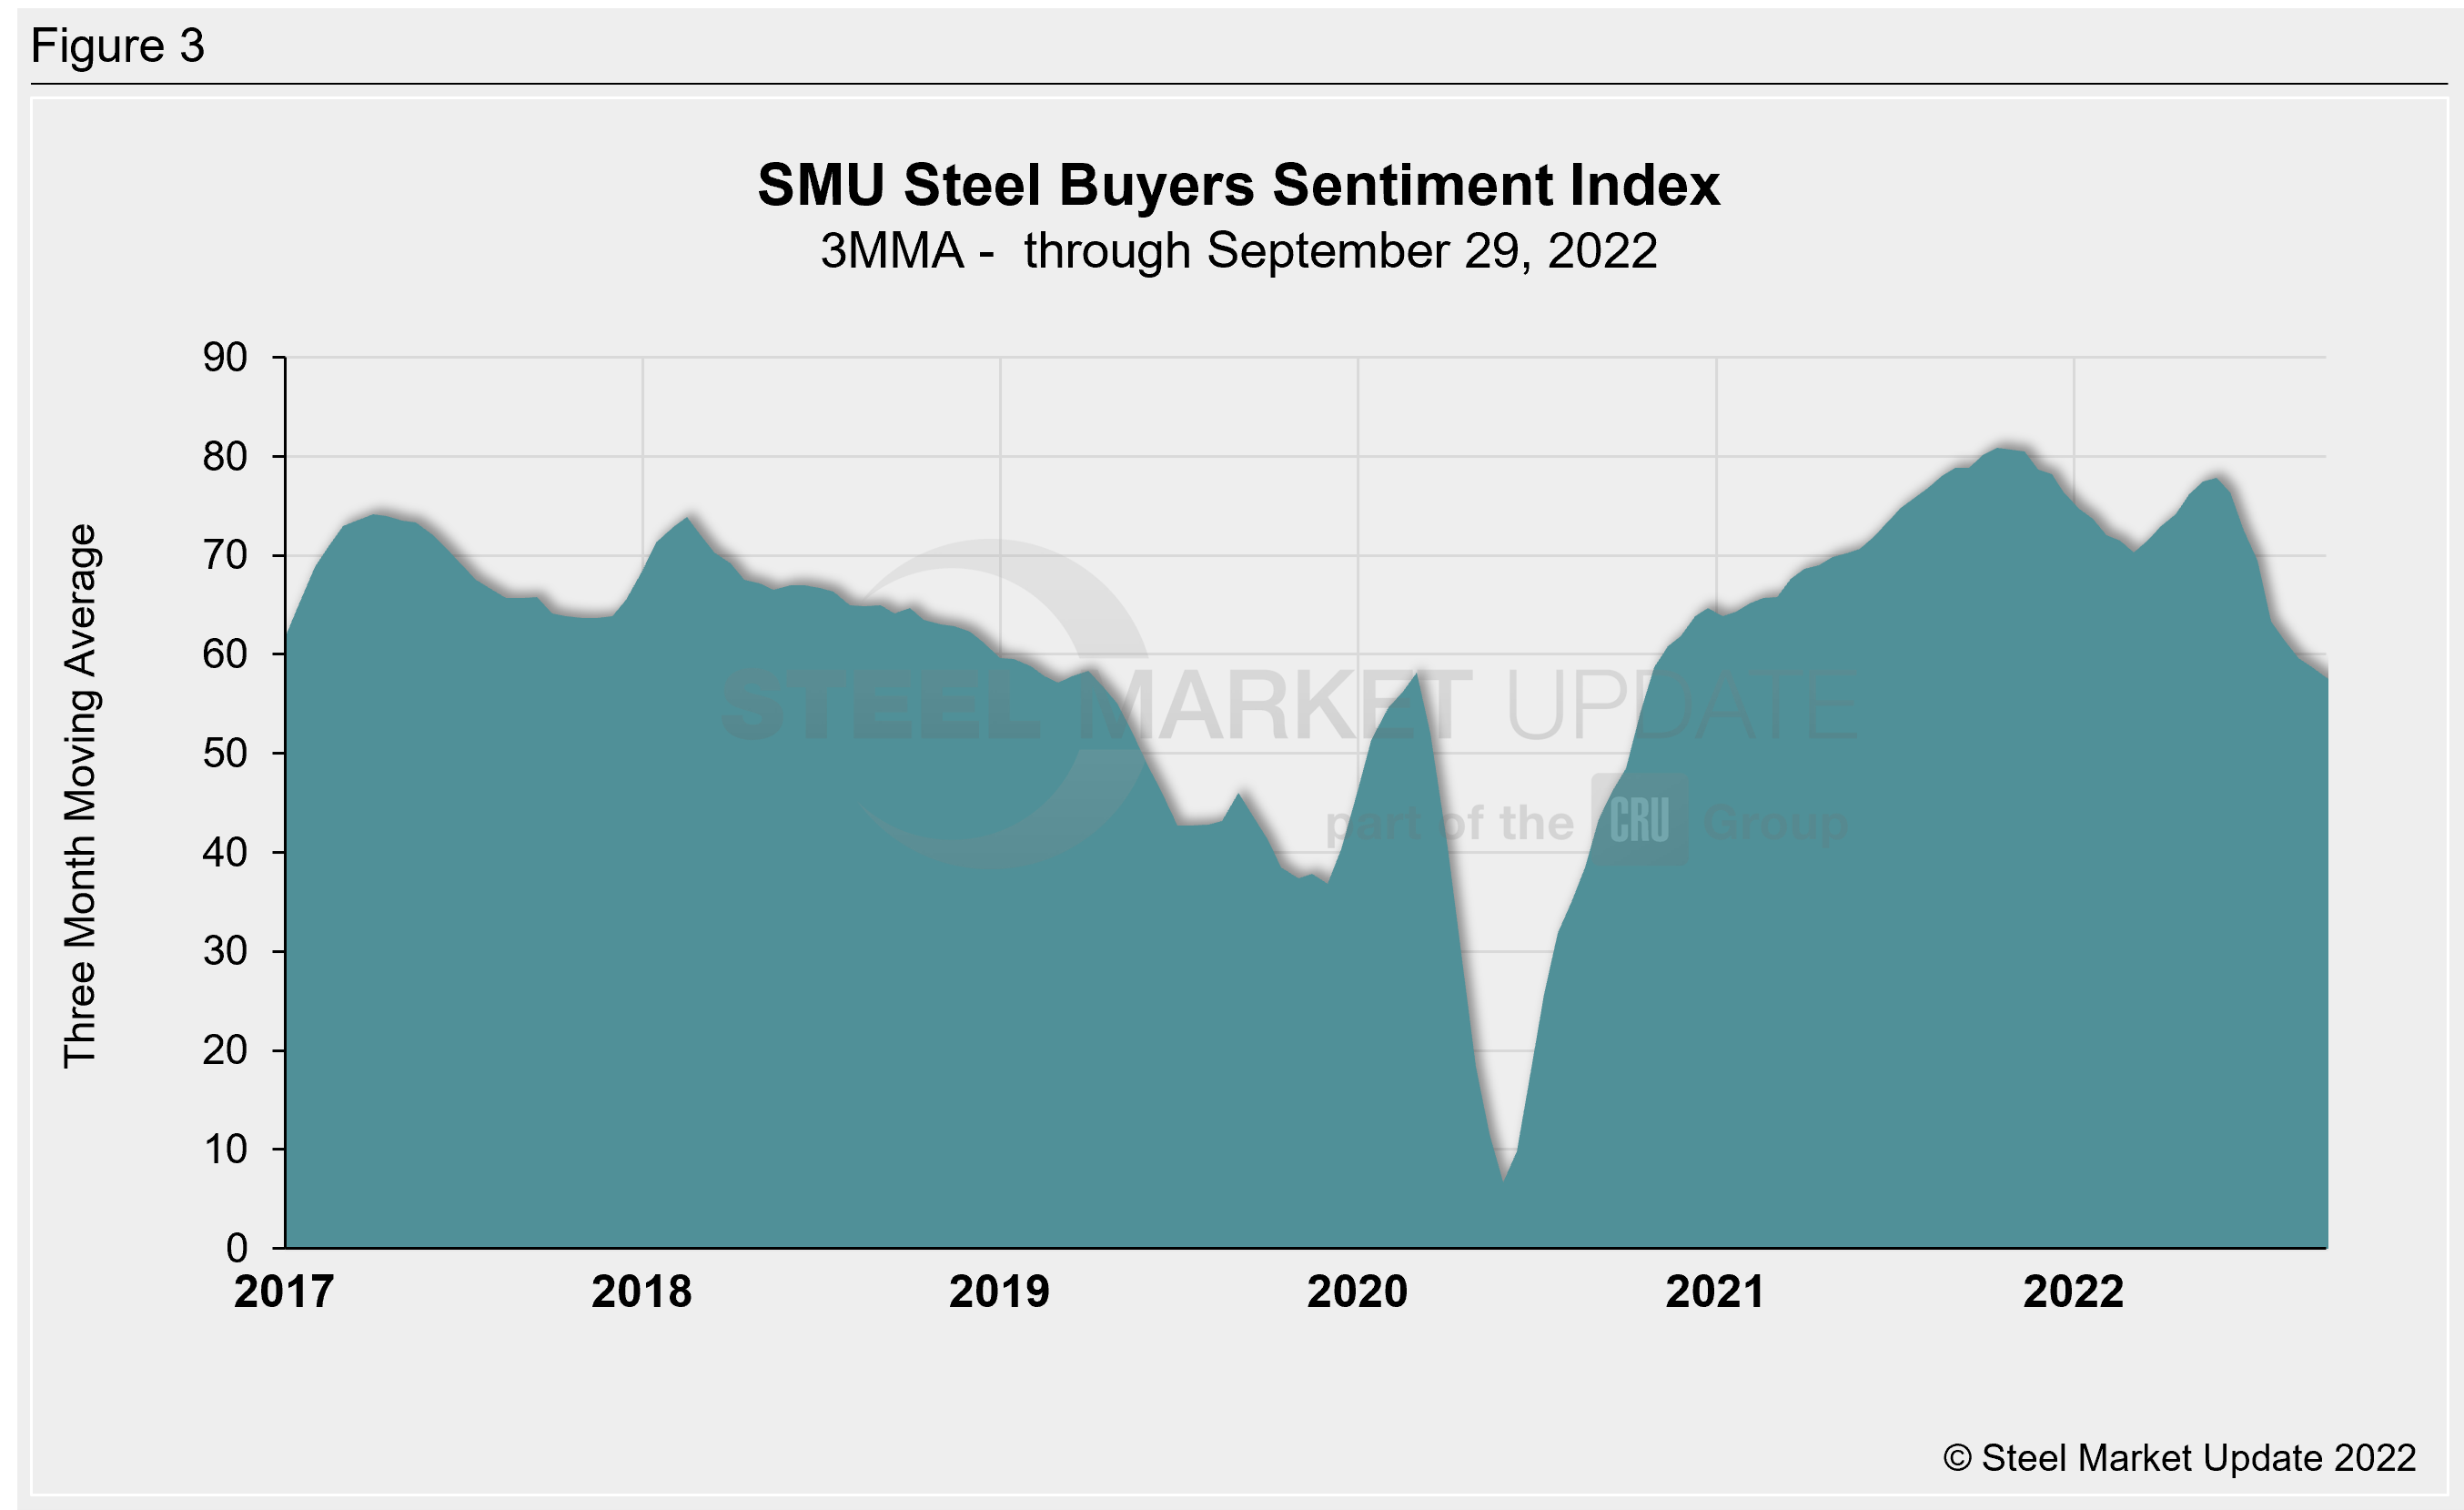
Measured as a three-month moving average, the Current Sentiment 3MMA decreased two-thirds of a point to +57.00 last week, nearly a two-point decline compared to one month earlier (Figure 3). This reading is the lowest since mid-October 2020, when it was +54.17. Four months ago, the Current Sentiment 3MMA peaked at +77.83, the highest level since December 2021.
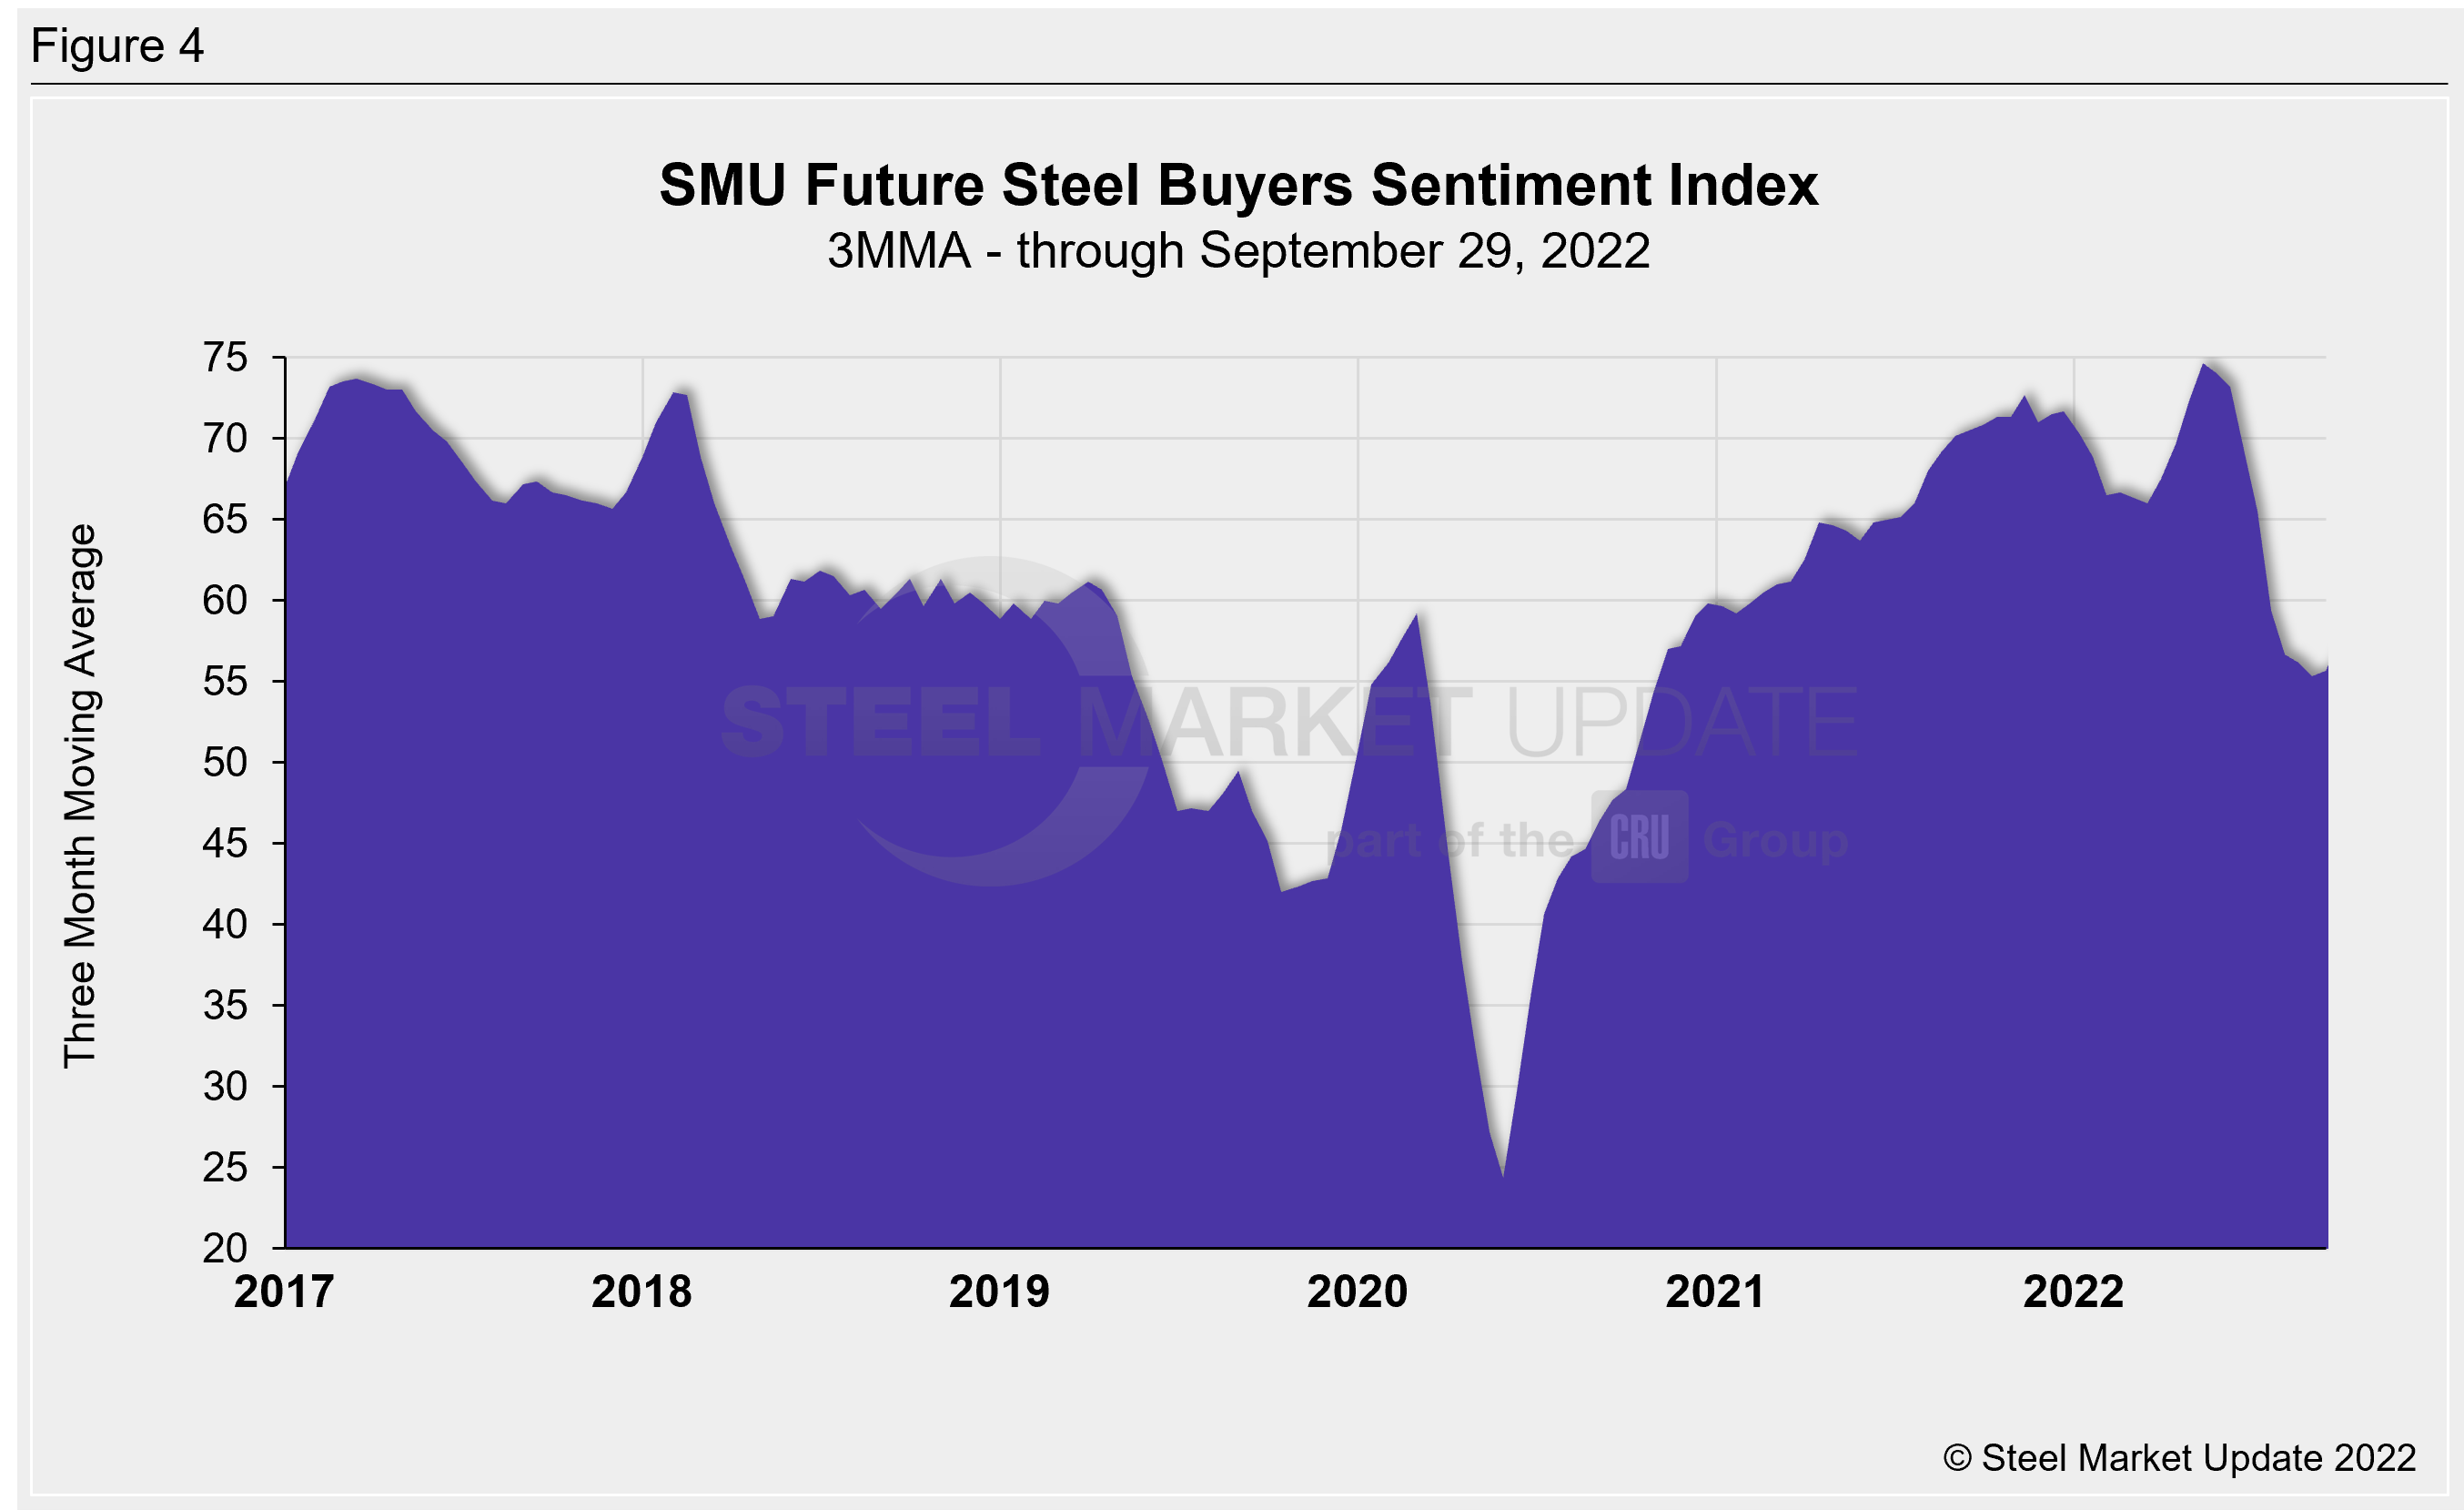
The Future Sentiment 3MMA rose almost two points this week to +57.50, more than two points higher than levels one month prior (Figure 4). The early September reading of +55.33 was the lowest seen since October 2020, when it was +54.50. Like the Current Sentiment 3MMA, the Future Sentiment 3MMA had reached a record high of +74.67 in May, surpassing the previous record of +73.67 set in March 2017.
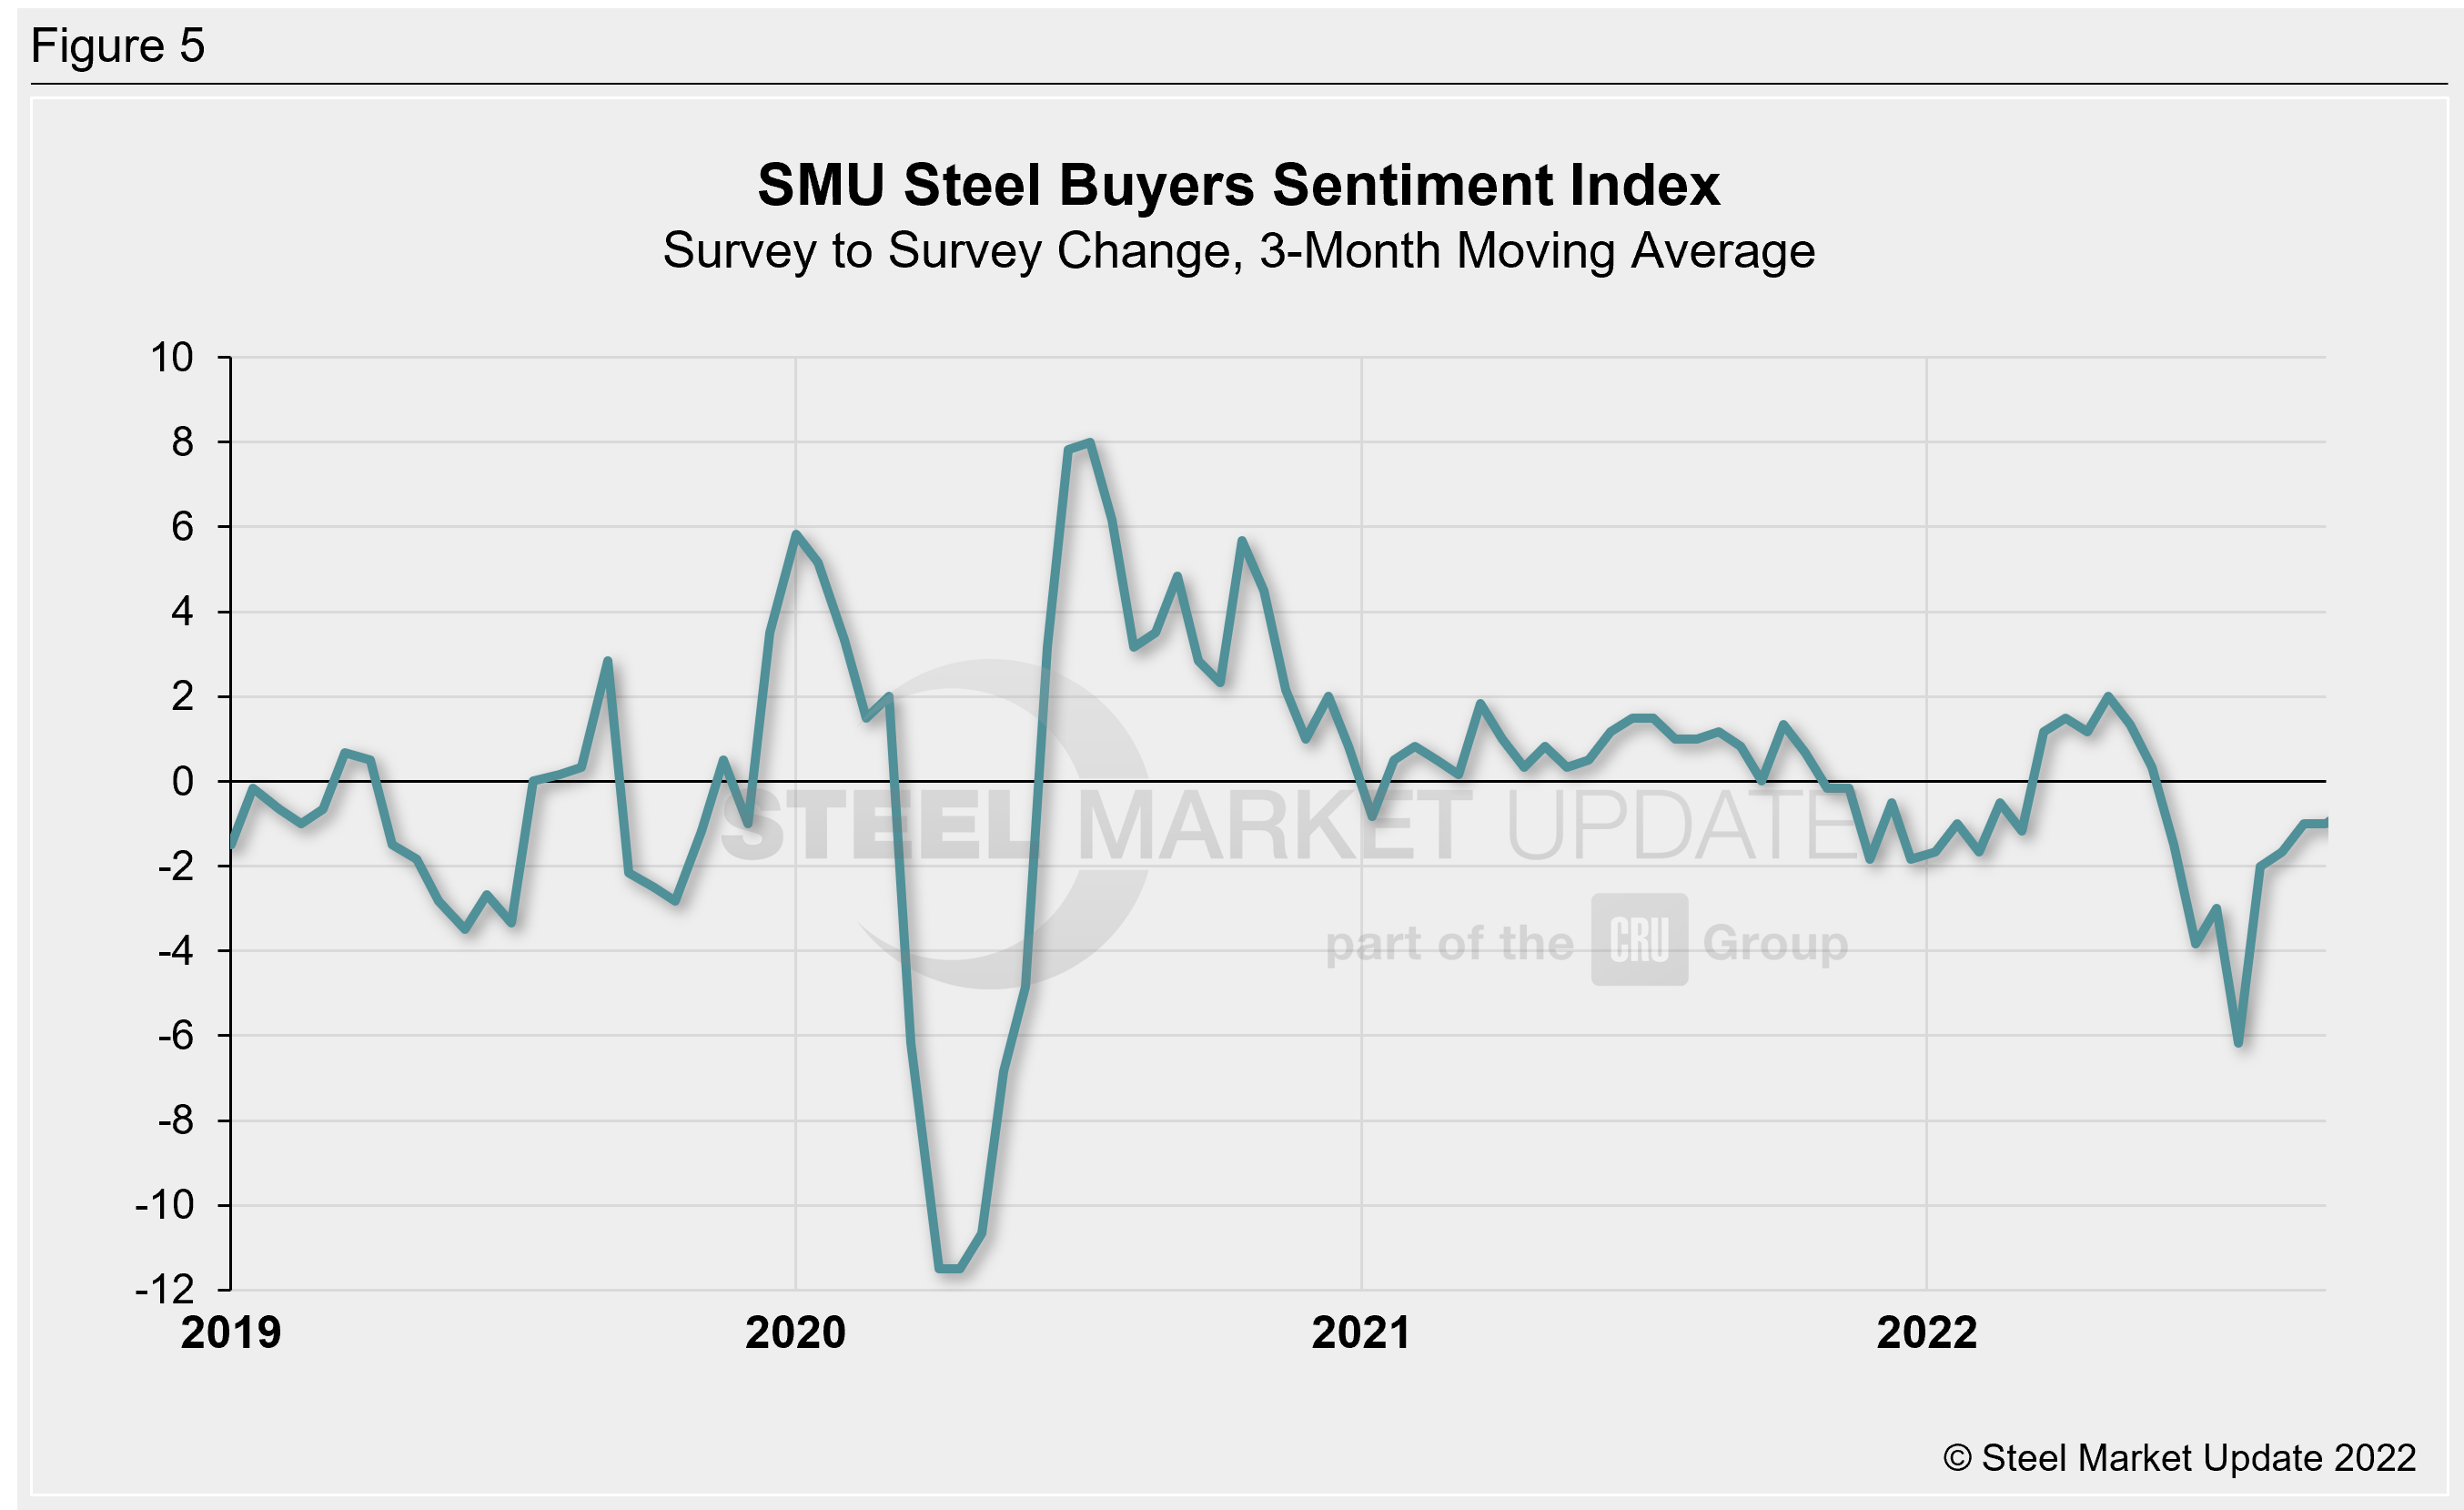
One helpful way to measure changes in Sentiment is to graph the survey-to-survey change in the Current Sentiment Index to measure the magnitude of Sentiment movements (Figure 5). On a 3MMA basis, the survey-to-survey change through last week is down one point compared to mid-September. We have seen negative growth rates with each reading since May. In late July we saw a six-point decline, which was the largest change seen since April 2020. Between November 2020 and June 2022, the survey-to-survey change in our 3MMA Sentiment readings was relatively stable, never exceeding two points. In late June of this year, it began to exceed that range and did so through July.
What SMU Survey Respondents Had to Say
“I am always optimistic. But I am not confident in how the market will be in the next few months.”
“Continue with strong order book and bare inventory.”
“Price deterioration is killing the market.”
“We will be successful where we can.”
“Inflation has put extreme pressure on disposable income, and hence sluggish sales.”
“Hard to know that timing but expect prices will recover some. Unless we go into some worldwide recession driven by increased wars and trade issues.”
“It is just going to be a light few months.”
“Still working through expensive inventory at depressed prices.”
“It’s a cyclical industry. It will get better.”
“The OEM side is remaining strong. It is just a difficult world the closer you get to distribution and real SSC work.”
“I see no sudden shifts of demand that will change the near-term projections.”
“Unrealistic expectations by prospective employees have made staffing a small business unviable.”
“We have a strong backlog through the year.”
“Still losing money on most inventory and stock.”
About the SMU Steel Buyers Sentiment Index
SMU Steel Buyers Sentiment Index is a measurement of the current attitude of buyers and sellers of flat-rolled steel products in North America regarding how they feel about their company’s opportunity for success in today’s market. It is a proprietary product developed by Steel Market Update for the North American steel industry. Tracking steel buyers’ sentiment is helpful in predicting their future behavior.
Positive readings run from +10 to +100. A positive reading means the meter on the right-hand side of our home page will fall in the green area indicating optimistic sentiment. Negative readings run from -10 to -100. They result in the meter on our homepage trending into the red, indicating pessimistic sentiment. A reading of “0” (+/- 10) indicates a neutral sentiment (or slightly optimistic or pessimistic), which is most likely an indicator of a shift occurring in the marketplace. Sentiment is measured via Steel Market Update surveys that are conducted twice per month. We display the meter on our home page.
We send invitations to participate in our survey to more than 700 North American companies. Approximately 45% of respondents are service centers/distributors, 30% are manufacturers, and the remainder are steel mills, trading companies or toll processors involved in the steel business.
Click here to view an interactive graphic of the SMU Steel Buyers Sentiment Index or the SMU Future Steel Buyers Sentiment Index.
By Brett Linton, Brett@SteelMarketUpdate.com


