

Market Data

November 2, 2022
Steel Demand Index Pointing Lower, Prices and Lead Times to Follow
Written by David Schollaert
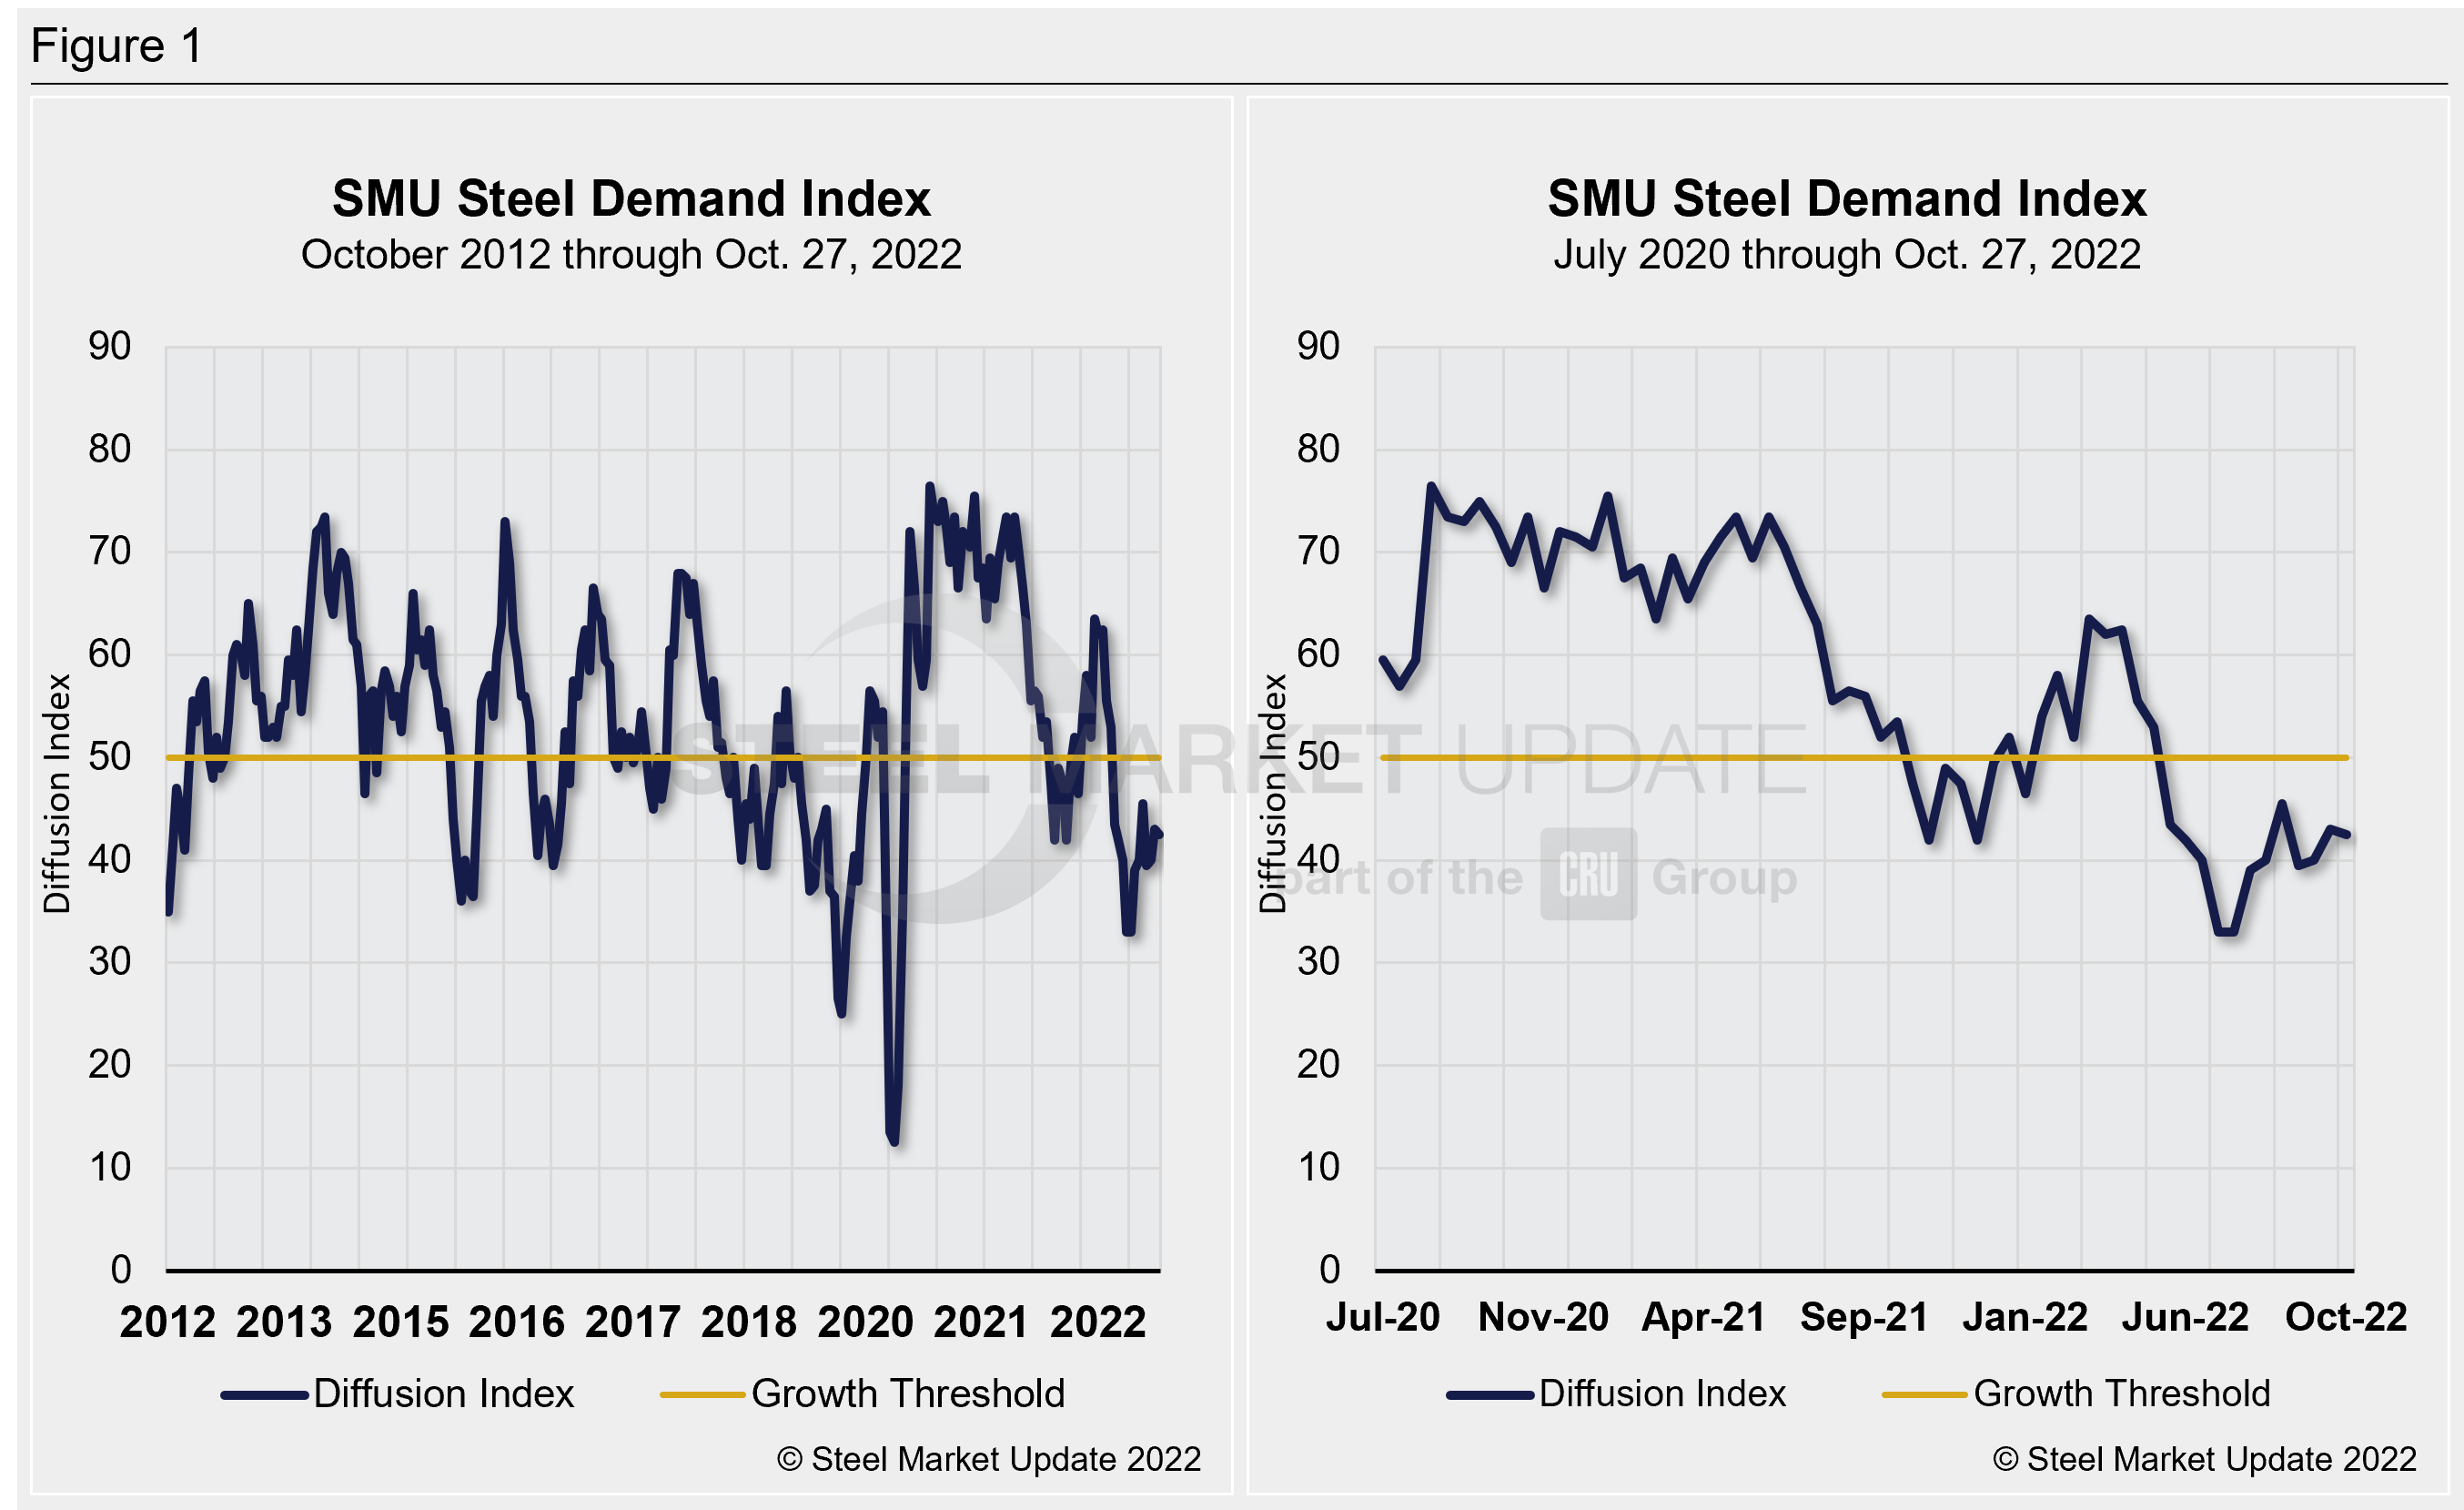
Apparent demand for flat-rolled steel in the US edged down slightly in SMU’s latest analysis of demand and lead time dynamics. Despite the slight decline in the latter half of October, the month’s SMU Steel Demand Index closed out roughly 2.5 points above September’s reading but remained in contracting territory for the sixth straight month — the second-longest streak in our data’s history.
Since falling 9.5 points in late May — the sharpest decline since the onset of the pandemic — the Steel Demand Index has been unable to get anywhere near growth territory, let alone the neutral mark of 50.
The latest demand index registered 42.5 through Oct. 27, down from a reading of 43 on Oct. 13 but still nearly 10 points above the recent low of 33 back in late July. (SMU sends out full surveys to the market every two weeks.) The ongoing ebb and flow in the index — it hasn’t moved by more than five points since late August — might just be a short-lived lull as some indicators point to softer demand supported by the seasonal slowdown.
Not surprisingly, sentiment has been a little up and down of late, but data suggest it may be poised to decline again highlighted by easing lead times and waning prices.
SMU’s Steel Demand Index, which compares lead times and demand, is a diffusion index derived from our market surveys. This index continues to precede lead times, which is notable given that lead times are typically a leading indicator of steel price moves.
An index score above 50 indicates an increase in demand and a score below 50 indicates a decrease. Detailed side-by-side in Figure 1 are both the historical views and the latest Steel Demand Index.
Underlying pressure has slowed spot sourcing, with buyers telling SMU that apart from contract and project-specific buys, most are on the sidelines and focused on managing inventories. And while prices are expected to decline further, many note it will just devalue inventories rather than generate business.
And other competing factors are also still at play. There’s still a lack of economic clarity, and even a surprisingly higher GDP grade for Q3 is unlikely to quell concerns. US manufacturing activity in October grew at its slowest pace since May 2020, and the housing market saw a sharp slowdown as home builder confidence plunged for a tenth straight month in October, driven by rising interest rates and continued weakening housing demand. And by all accounts, the Fed is gearing up for another sizable interest rate hike to further cool the economy.
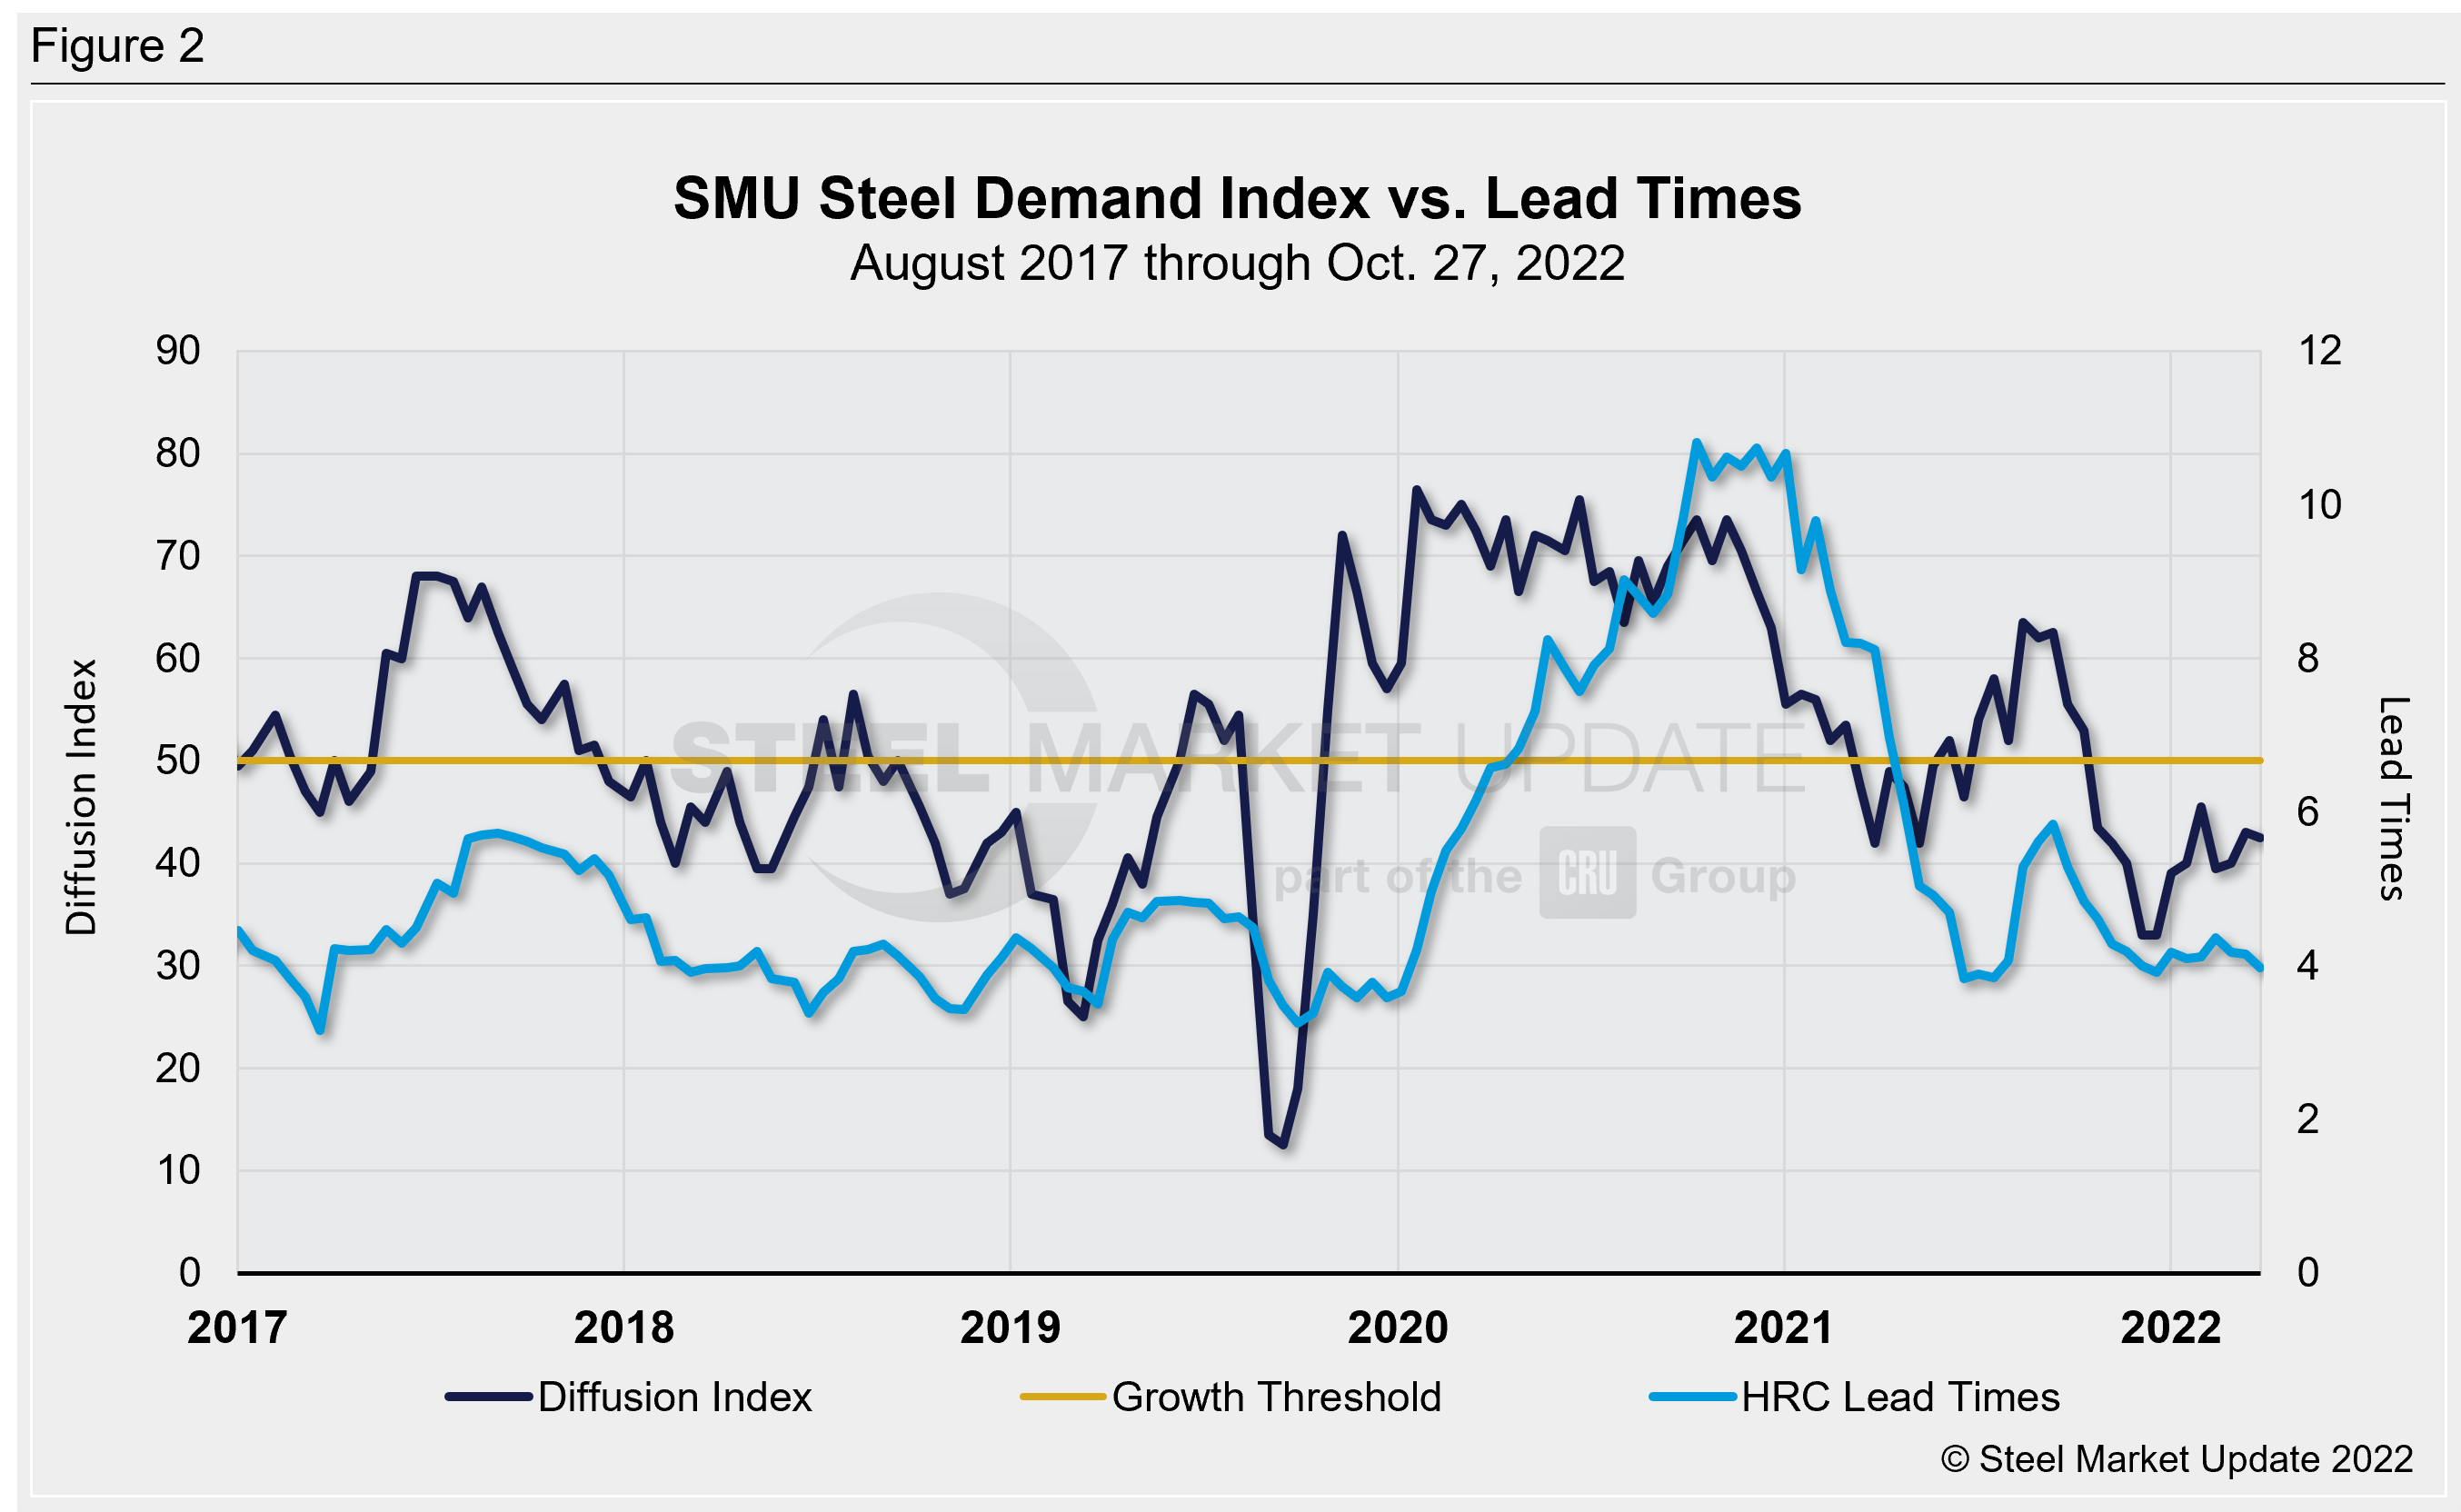
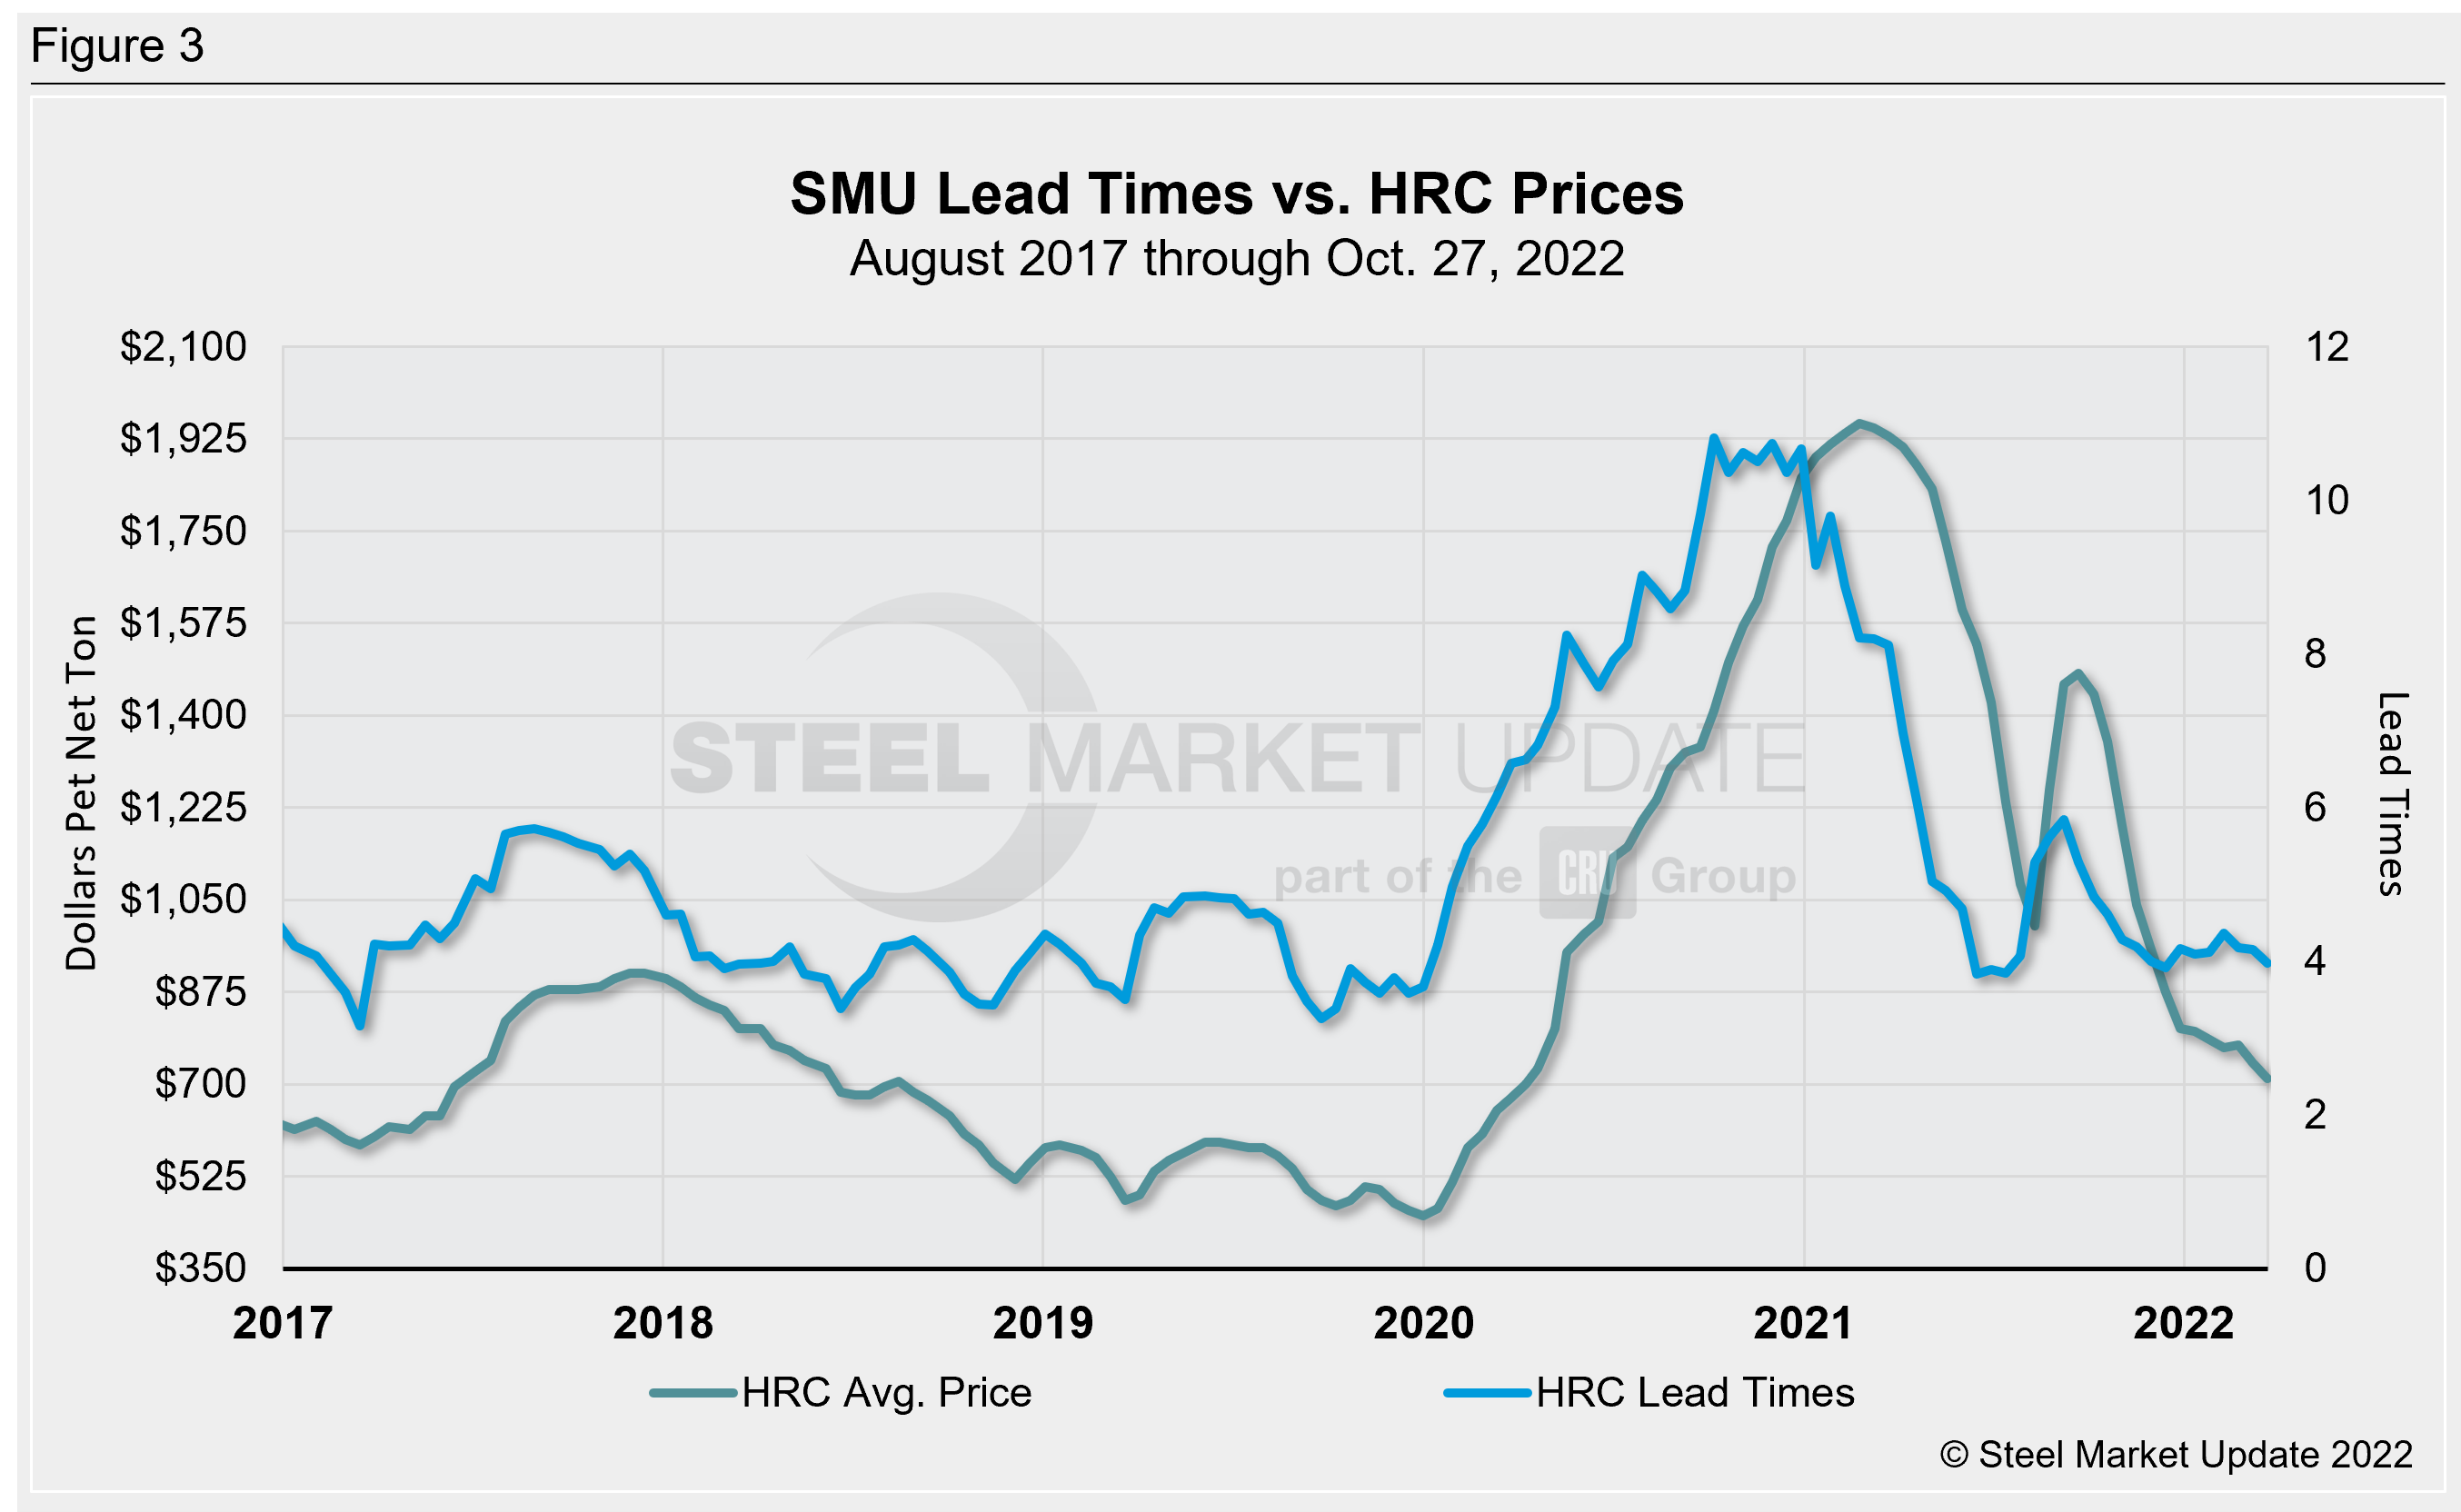
SMU’s demand diffusion index has rarely remained in a holding pattern for long, and for nearly a decade has consistently preceded steel mill lead times (Figure 2 features the past five years). Historically, SMU’s lead times have also been a leading indicator for flat-rolled steel prices, and HRC prices in particular (Figure 3 features the past five years).
SMU’s average HRC price now stands at $685 per ton ($34.25 per cwt), according to our latest check of the market on Nov. 1. Our overall average is down $25 per ton week-on-week.
Our hot rolled lead times average is now sub-four weeks, at 3.97 weeks based on our latest report on Oct. 27. The marginal decrease is inching its way toward 2022’s low of ~3.8 weeks seen in late January and February, but lead times remain significantly higher than the record low in our ~11-year data history, which was 2.8 weeks in October 2016.
The takeaway: Since mills began reporting declining demand, supported by idlings and outages being pulled forward, prices have continued to ease and buying has been curbed as much as possible. These shifting markers underscore the current indecisive sentiment, nearly two-thirds of respondents continue to report static sentiment, likely a precursor to more declines as underlying downward pressure remains.
Note: Demand, lead times and prices are based on the average data from manufacturers and steel service centers who participate in SMU market trends analysis surveys. Our demand and lead times do not predict prices but are leading indicators of overall market dynamics and potential pricing dynamics. Look to your mill rep for actual lead times and prices.
By David Schollaert, David@SteelMarketUpdate.com


