Prices

November 3, 2022
Hot Rolled Futures: Anyone See a Bottom?
Written by Michael D'Angelo
Editor’s note: SMU Contributor Michael D’Angelo is a researcher and trader at Marex. In his role, Mike performs fundamental and quantitative analysis, which directly leads to actionable trading/risk management strategies across the base, precious, and ferrous metals derivative spaces. Prior to joining Marex, Mike received a BA in economics with a minor in finance from Princeton University. Mike can be reached at mdangelo@marex.com for comments/questions.
CRU’s weekly Midwest HRC index got clobbered, falling to $687/ton on Nov. 2, down $48 (-6.53%) from the prior week — the largest percentage move since June 15. This is the first time the index has come in below $700 since December 2020.
The market’s expectation seems to be that prices will stabilize somewhere near $600, which would be a whopping 70% decline from the peak but still higher than where prices were pre-pandemic. Some larger deals are already being done near $600. If there weren’t some maintenance outages, which are common this time of year, alleviating the decline, we might already be in the low $600s. Some sellers are optimistic that a bottom is nearby or even here, but they have been saying that for about four months now.
Producer margins continue to suffer. Leading US steel producer Cleveland-Cliffs’ shares fell 8% last Tuesday after implied earnings were said to be a massive miss — implied Q4 earnings would be $150–200 million compared to the streets’ $687 million forecast. Cliffs cited higher input costs and maintenance activities, lower sales and lower steel prices.
Weak demand and continually elevated energy costs have caused the spreads between HRC and raw material inputs to narrow significantly throughout the second half of 2022. The spreads seem to be at low points since 2020 in both the EU and US.
Northern Europe HRC prices fell by about $25/ton last week and are now trading at about an $80 discount to US prices. Trading volumes remain muted and buyers continue to exhibit a “wait and see” mentality. Mills are still overstocked and last week some even reported selling some tonnage below the cost of production.
Global steel demand is set to drop about 2.2% in 2022, according to the World Steel Association, which revised its April forecast for a small increase.
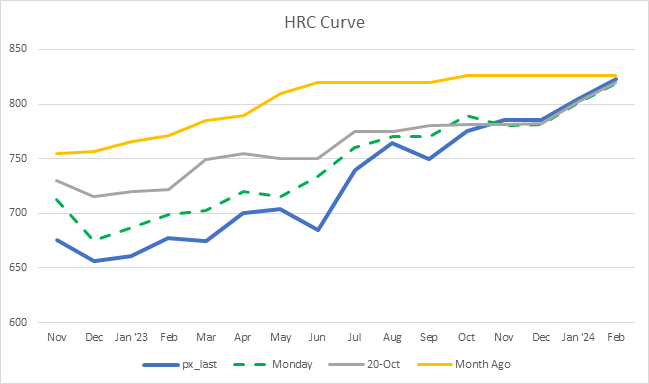
CME forward curve took another beating this week and is still in contango with Dec. ’23 valued at a $125 premium to Dec. ’22. Month-over-month, Dec. ’22 is down about $100.
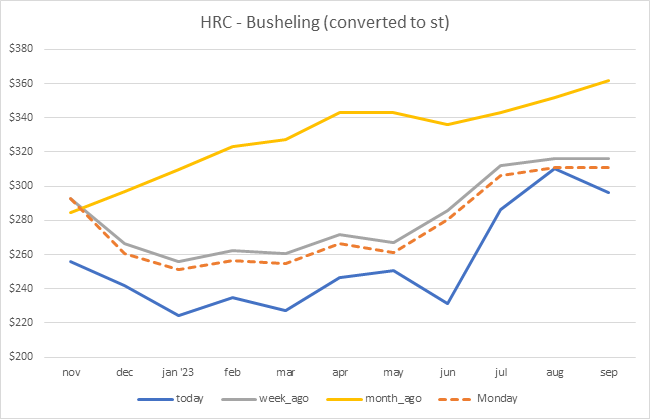
Busheling has actually been pretty stable over the past week with Nov. and Dec. ’22 unchanged, which has caused the HRC minus busheling spread to narrow, suggesting a reduction in mill profit margins. The spread is expected to fall about $30 more through January, but liquidity is thin in the busheling contracts averaging about 50 lots for November and December and 20 lots for January 2023.
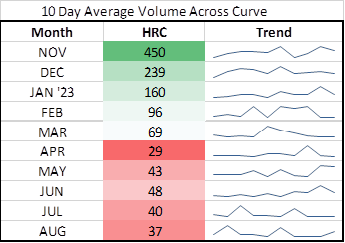
Above are the average trading volumes for each HRC contract; liquidity has been decent in the front three months.
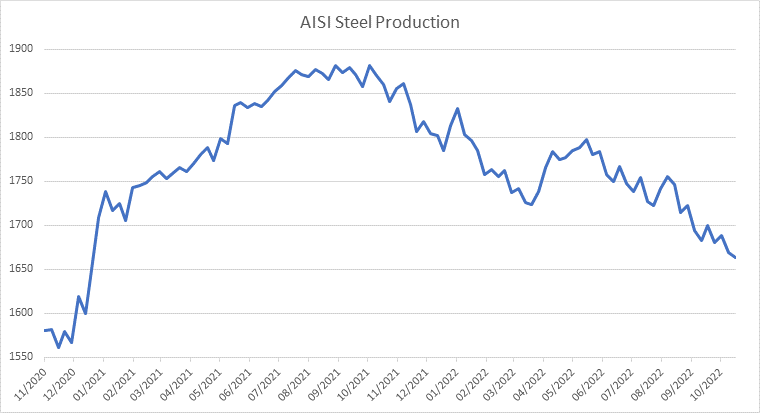
Weekly US steel production, reported by the American Iron and Steel Institute (AISI), fell by 6,000 tons to 1.663 million tons during the week ending Oct. 29 — the lowest level since January 2021. The US steel capacity utilization rate fell to 74.5% from 74.8%.
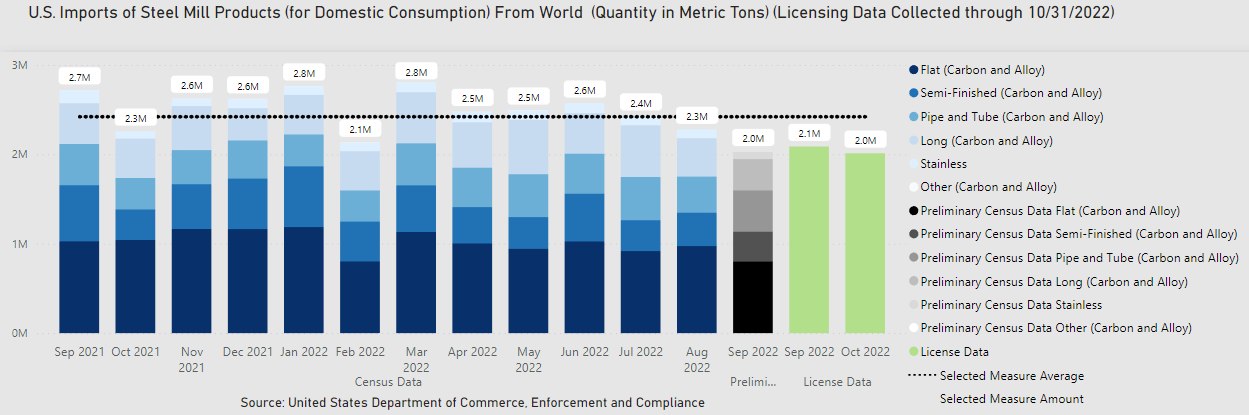
Based on licensing data, imports for October were projected to be 2 million metric tons for the month. Imports have been trending down since June due to sluggish demand and ample domestic supply.
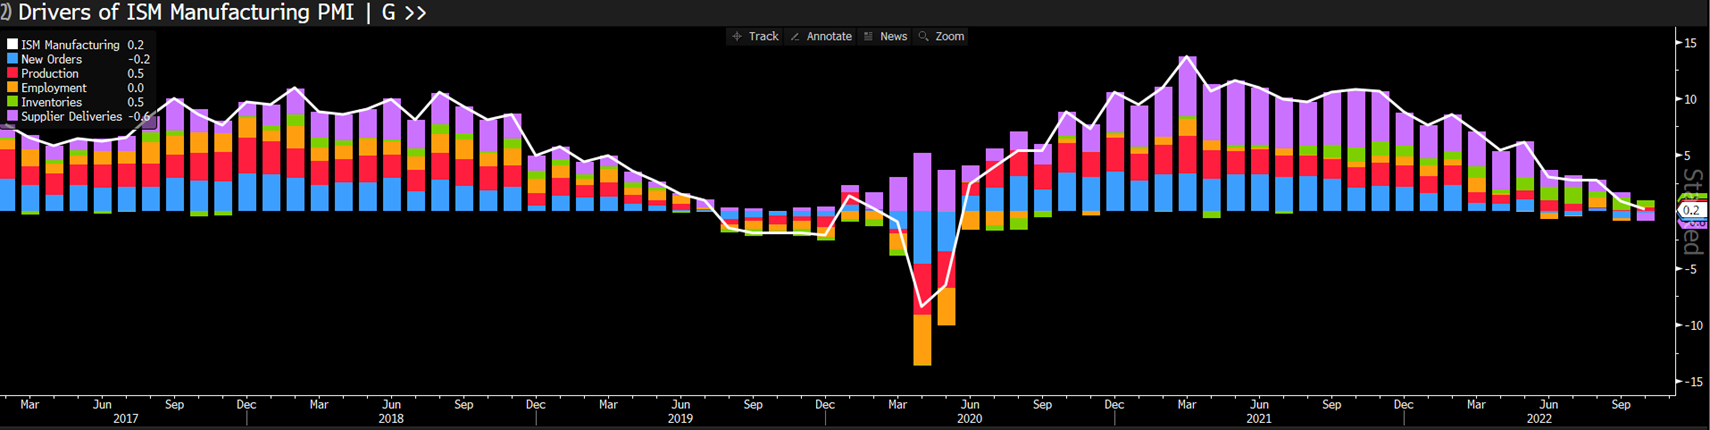
On the economic data front (see below), GDP beat expectations last week, as did personal consumption, construction spending, and Wards Total Vehicle Sales. ISM Manufacturing came in at 50.2, a slight expansion, however the metric has been in a persistent downward trend since March 2021.
The Fed funds rate was raised by 75 bps to 3.75–4%. Powell signaled that the pace of rate hikes could decelerate but the terminal rate at the conclusion of the hikes could be higher than previously anticipated, which the markets did not like.
Recent Economic Data
- Oct. 25 – Conf. Board Consumer Confidence: 102.5 (Est. 105.9)
- Oct. 26 – Wholesale Inventories MoM: 0.8% (Est. 1.0%)
- Oct. 27 – GDP Annualized QoQ: 2.6% (Est. 2.4%)
- Oct. 27 – Personal Consumption: 1.4% (Est. 1.0%)
- Oct. 27 – Durable Goods Orders: 0.4% (Est. 0.6%)
- Oct. 31 – Dallas Fed Manufacturing Activity: -19.4 (Est. -17.4)
- Nov. 1 – Construction Spending MoM: 0.2% (Est. -0.6%)
- Nov. 1 – ISM Manufacturing: 50.2 (Est. 50.0)
- Nov. 1 – Wards Total Vehicle Sales: 14.90m (Est. 14.50m)
- Nov. 2 – FOMC Rate Decision: +75 bps (Est. +75 bps)
- Nov. 3 – Factory Orders, Durable Goods Orders
- Nov. 4 – Unemployment Rate
By Michael D’Angelo, Marex, mdangelo@marex.com