

Market Data

November 11, 2022
September Shipments and Supply of Steel Products Analysis
Written by David Schollaert
Total US mill shipments of steel products were down in September, falling to their lowest total year-to-date (YTD). Mill shipments have been fluctuating up and down all year with little consistency. September’s shipments totaled 7.58 million tons, a 7.2% decline from August’s 8.18 million tons, and the lowest total since February 2021. Apparent supply also saw a month-on-month (MoM) decline in September, down 8% versus the prior month.
This analysis is based on steel mill shipment data from the American Iron and Steel Institute (AISI) and import-export data from the US Department of Commerce (DOC). The analysis summarizes total steel supply by product from 2009 through September 2022 and year-on-year (YoY) changes.
The supply/demand differential remains in place with supply still well ahead of demand, even though both declined in September. Apparent supply (domestic shipments plus imports) in September was just about 6.4% above domestic shipments totals, while export totals were down nearly 11% over the same period. Imports were also lower MoM, down 12.8% in September and sliding for the third straight month.
Domestic mill utilization averaged 77.2% through September, down 1.5 percentage points from August’s 78.7% and down 9.3% versus the same year-ago period.
Prices began sliding in May once raw material availability adjusted to the war in Ukraine. The declines accelerated into September as supply steadily outpaced demand.
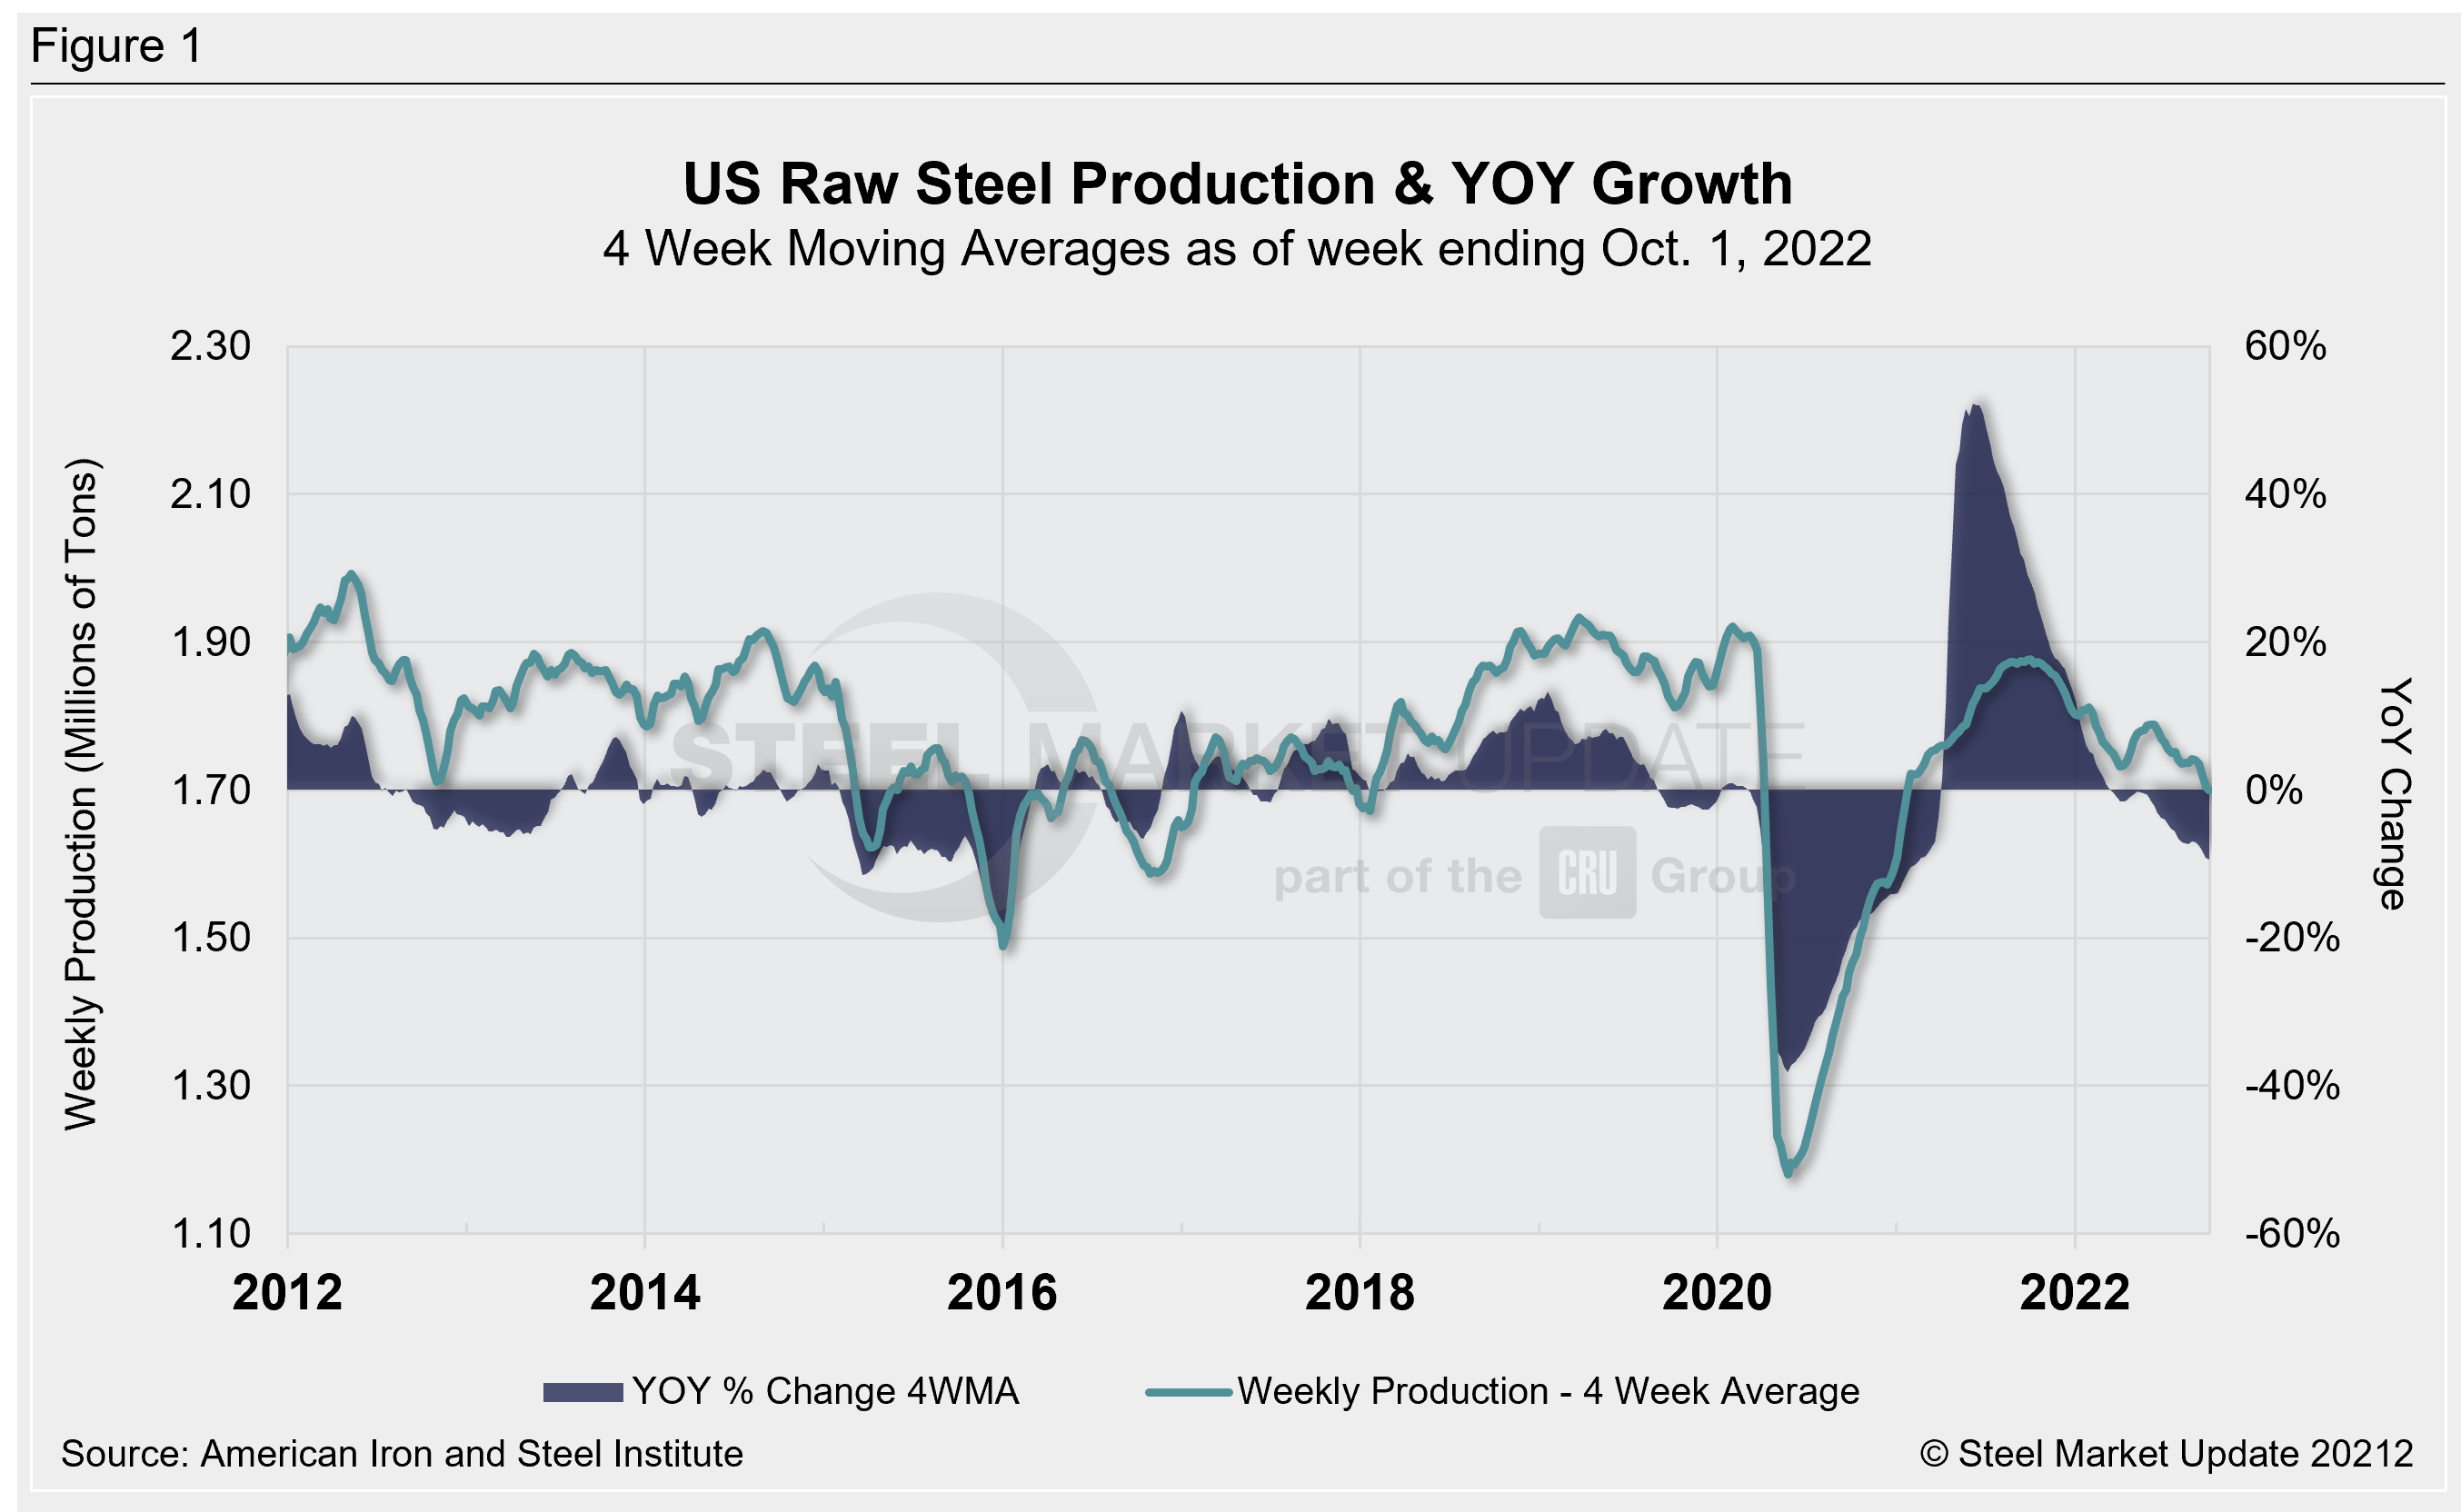
SMU’s benchmark hot-rolled coil price declined by roughly $20 per net ton ($1 per cwt) in September. It peaked at $1,480 per ton during the week of April 19 and has been declining since. HRC prices closed out in September at an average of $765 per ton FOB mill, east of the Rockies on Sept. 27. Prices declined throughout the month, though at a slower pace than in months past. That trend has continued through to mid-November.
According to SMU’s latest check of the market on Nov. 8, the price for HRC is $655 per ton on average. Raw steel production, shown below in Figure 1, is based on weekly data from the AISI. It is displayed here as four-week moving averages through Oct. 1.
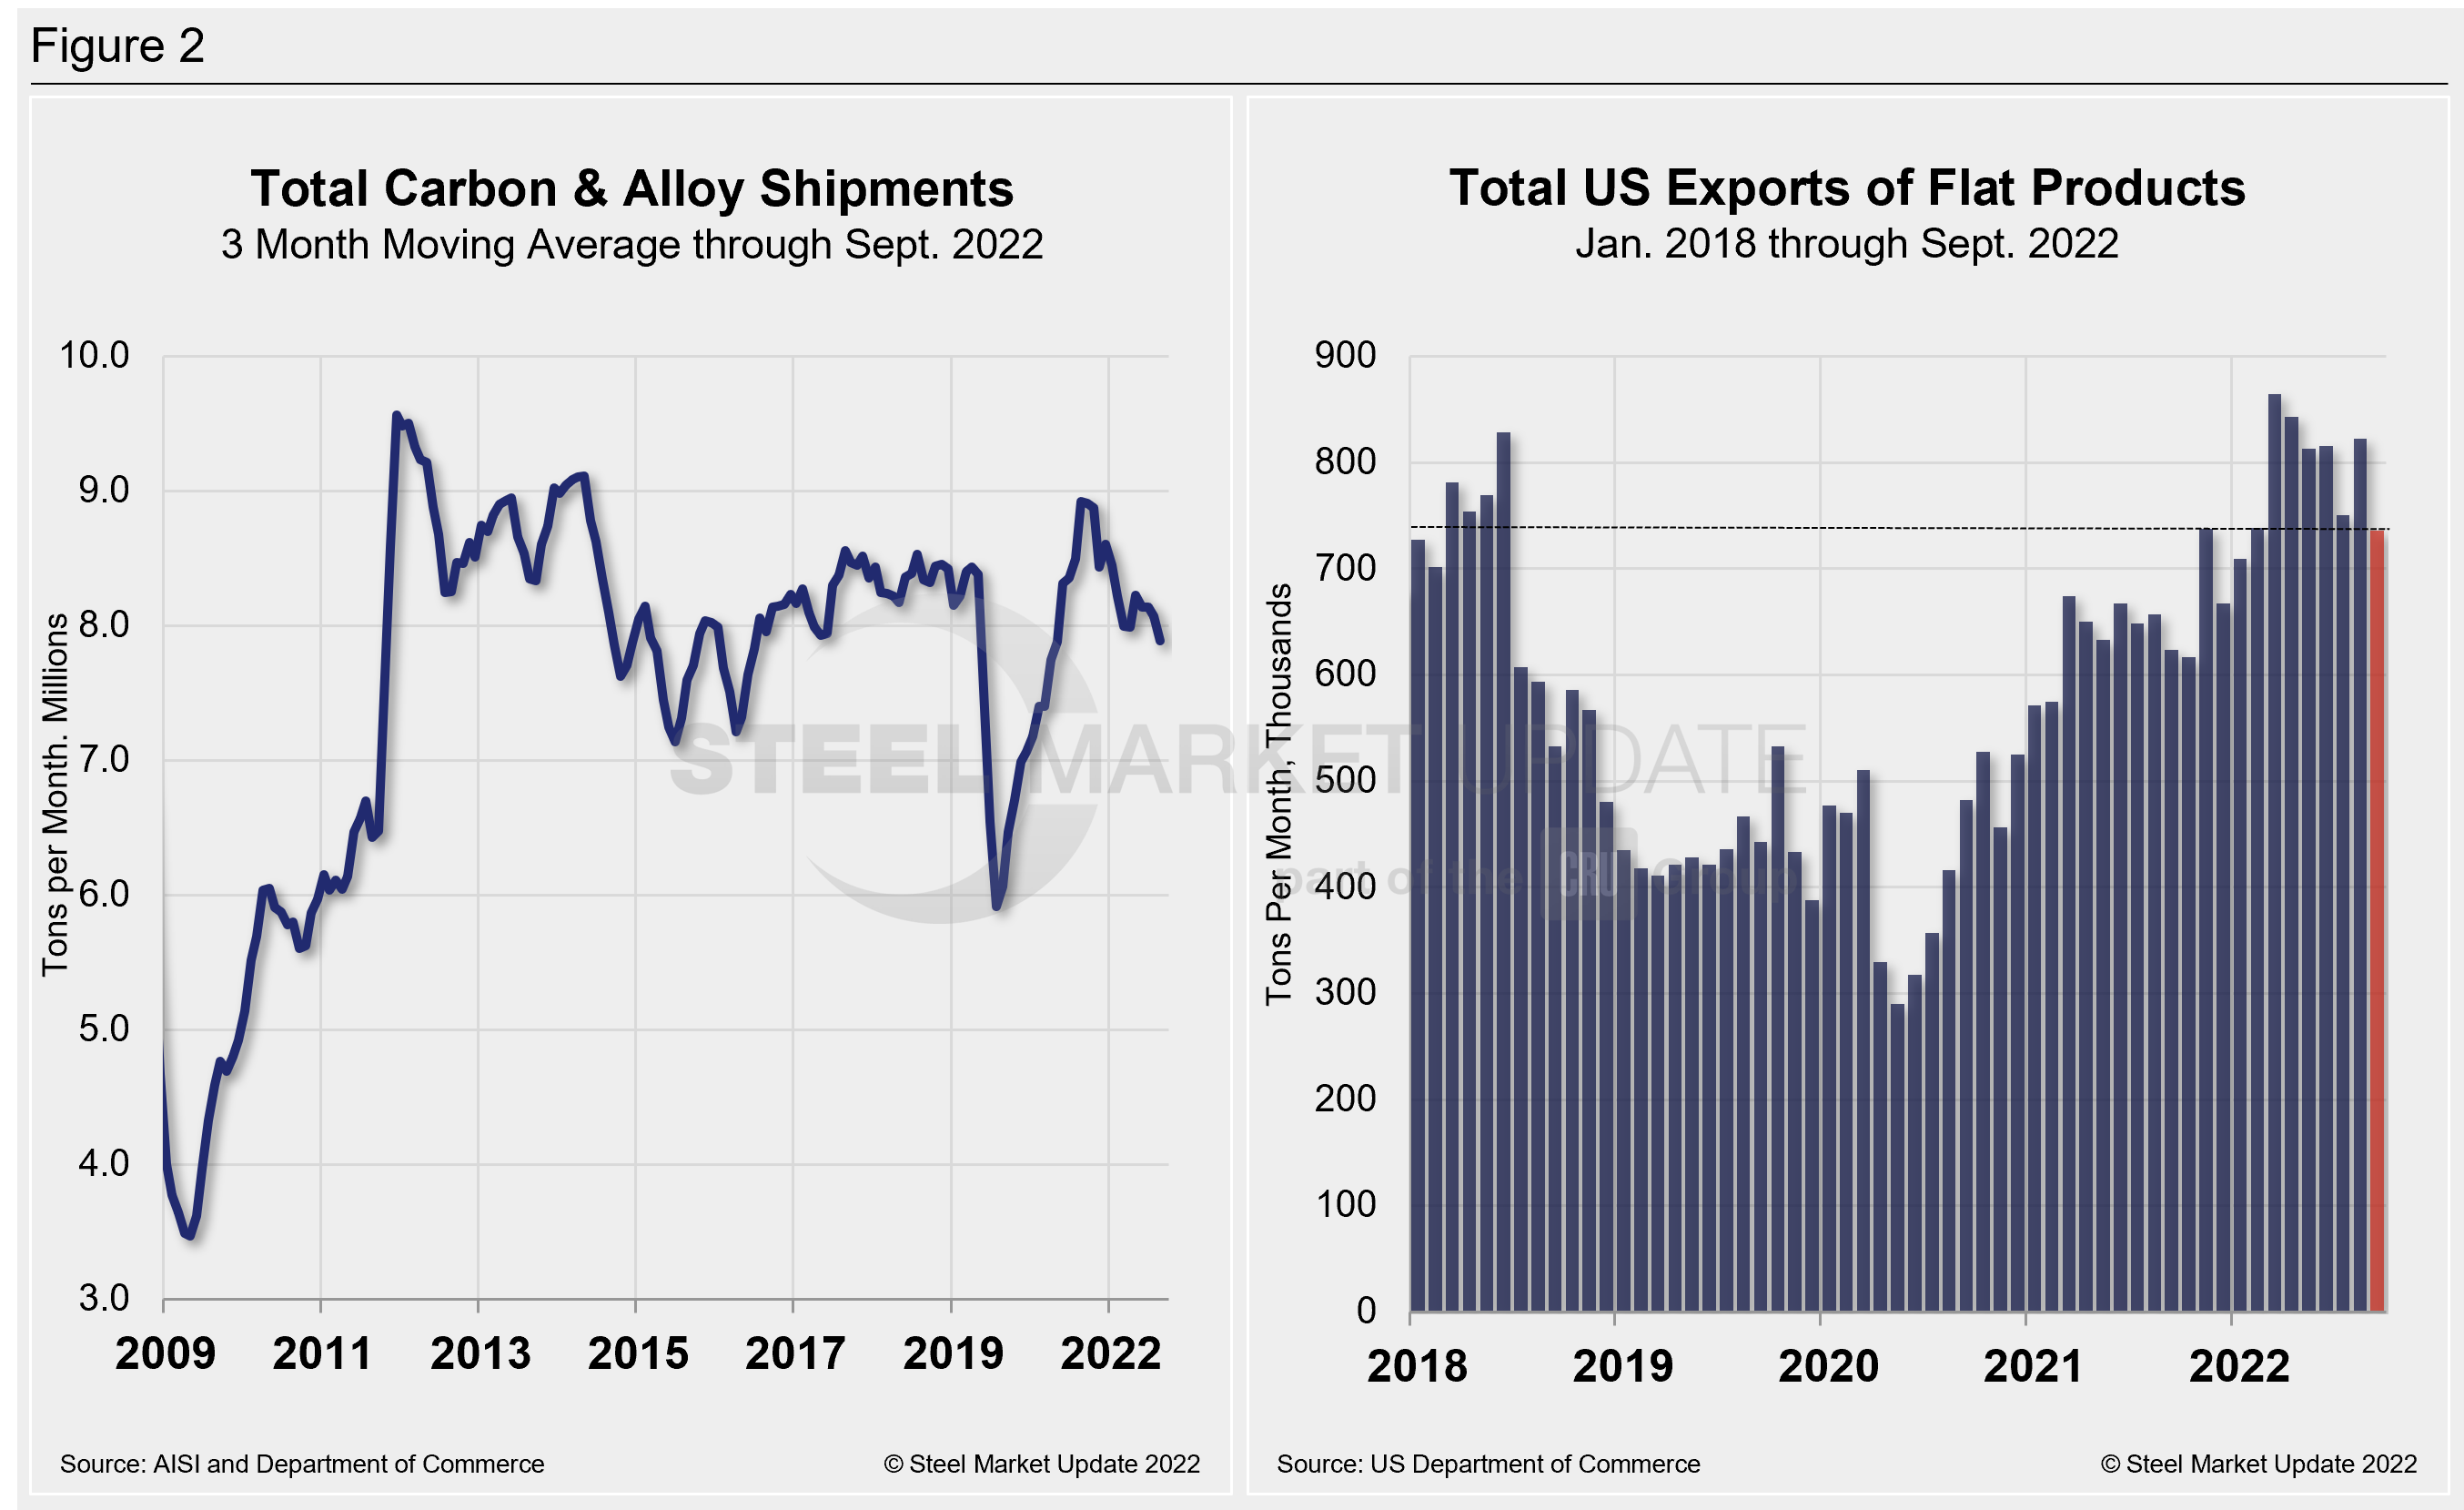
Monthly shipment data for all rolled steel products and exports are noted in Figure 2. Measured as a three-month moving average (3MMA) of the monthly data, September’s total was 7.89 million tons, down 2.3% versus 8.13 million tons in August. Monthly shipments have increased only once monthly YTD for the 3MMA analysis. Shipments were down 11.4% in September versus the year prior when shipments were 8.91 million tons. The recovery from Covid-related shutdowns two years ago was meaningful. September’s shipments, however, were just 7.4% above the Covid-induced lows of September 2020. And they are nearly 8% below the same pre-pandemic period in 2019.
All rolled product exports totaled 735,516 tons in September, down 10.6% MoM but 18% higher versus the same year-ago period. September’s total is the third-lowest mark for the year.
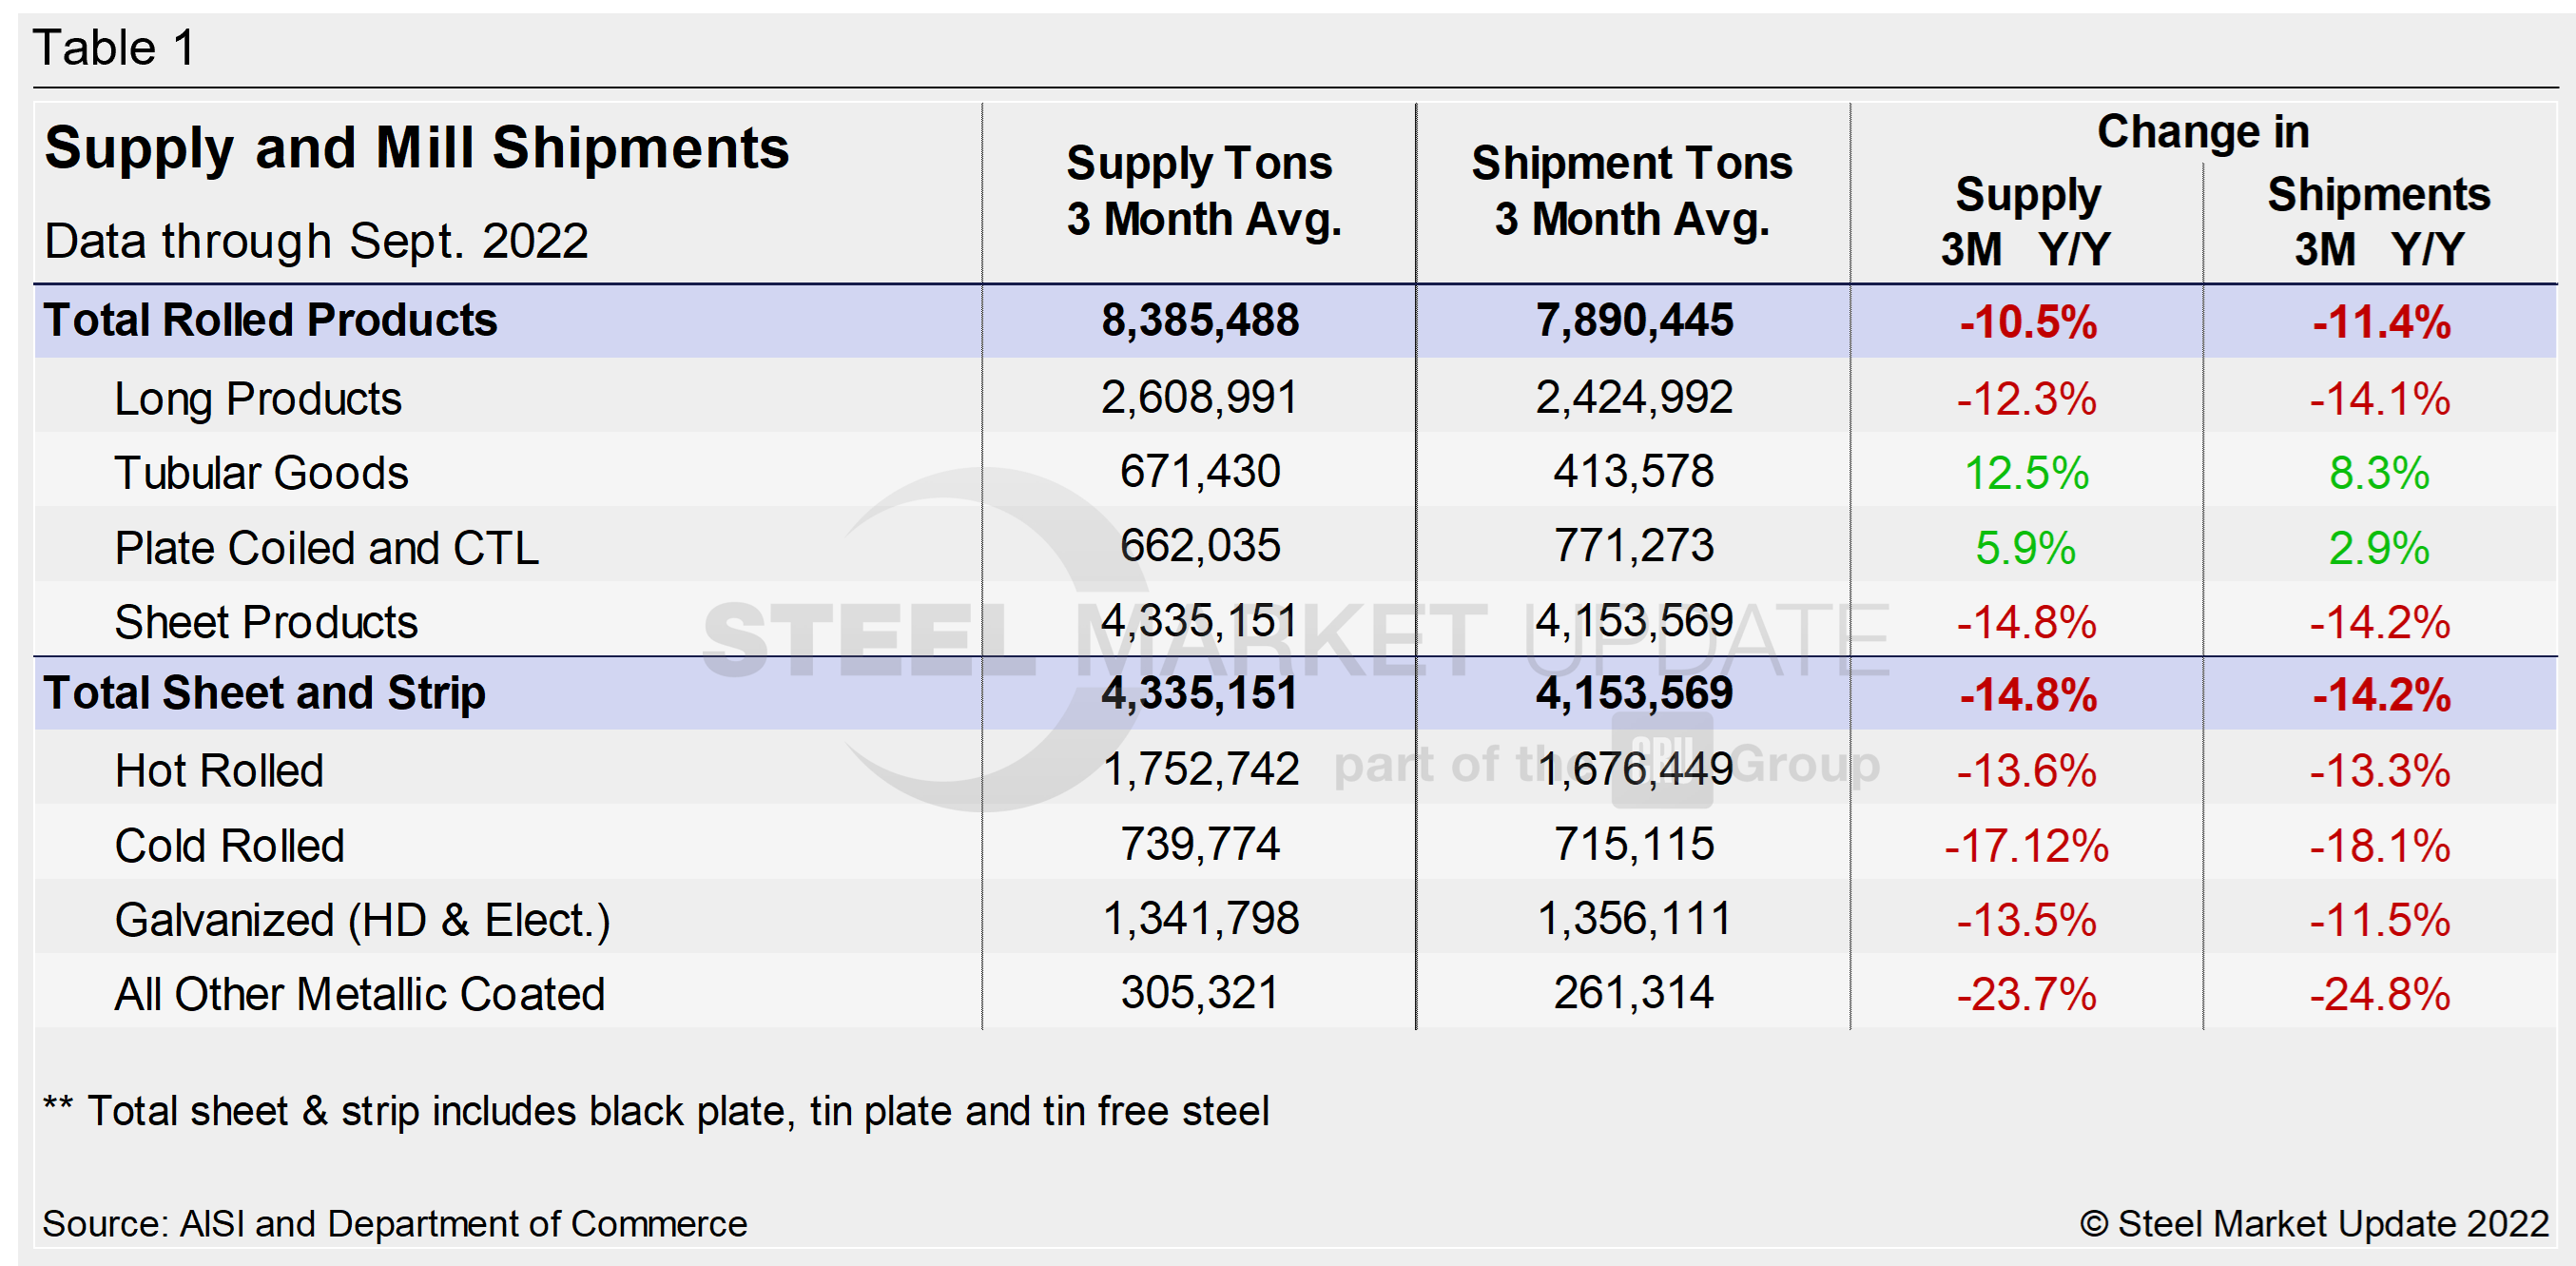
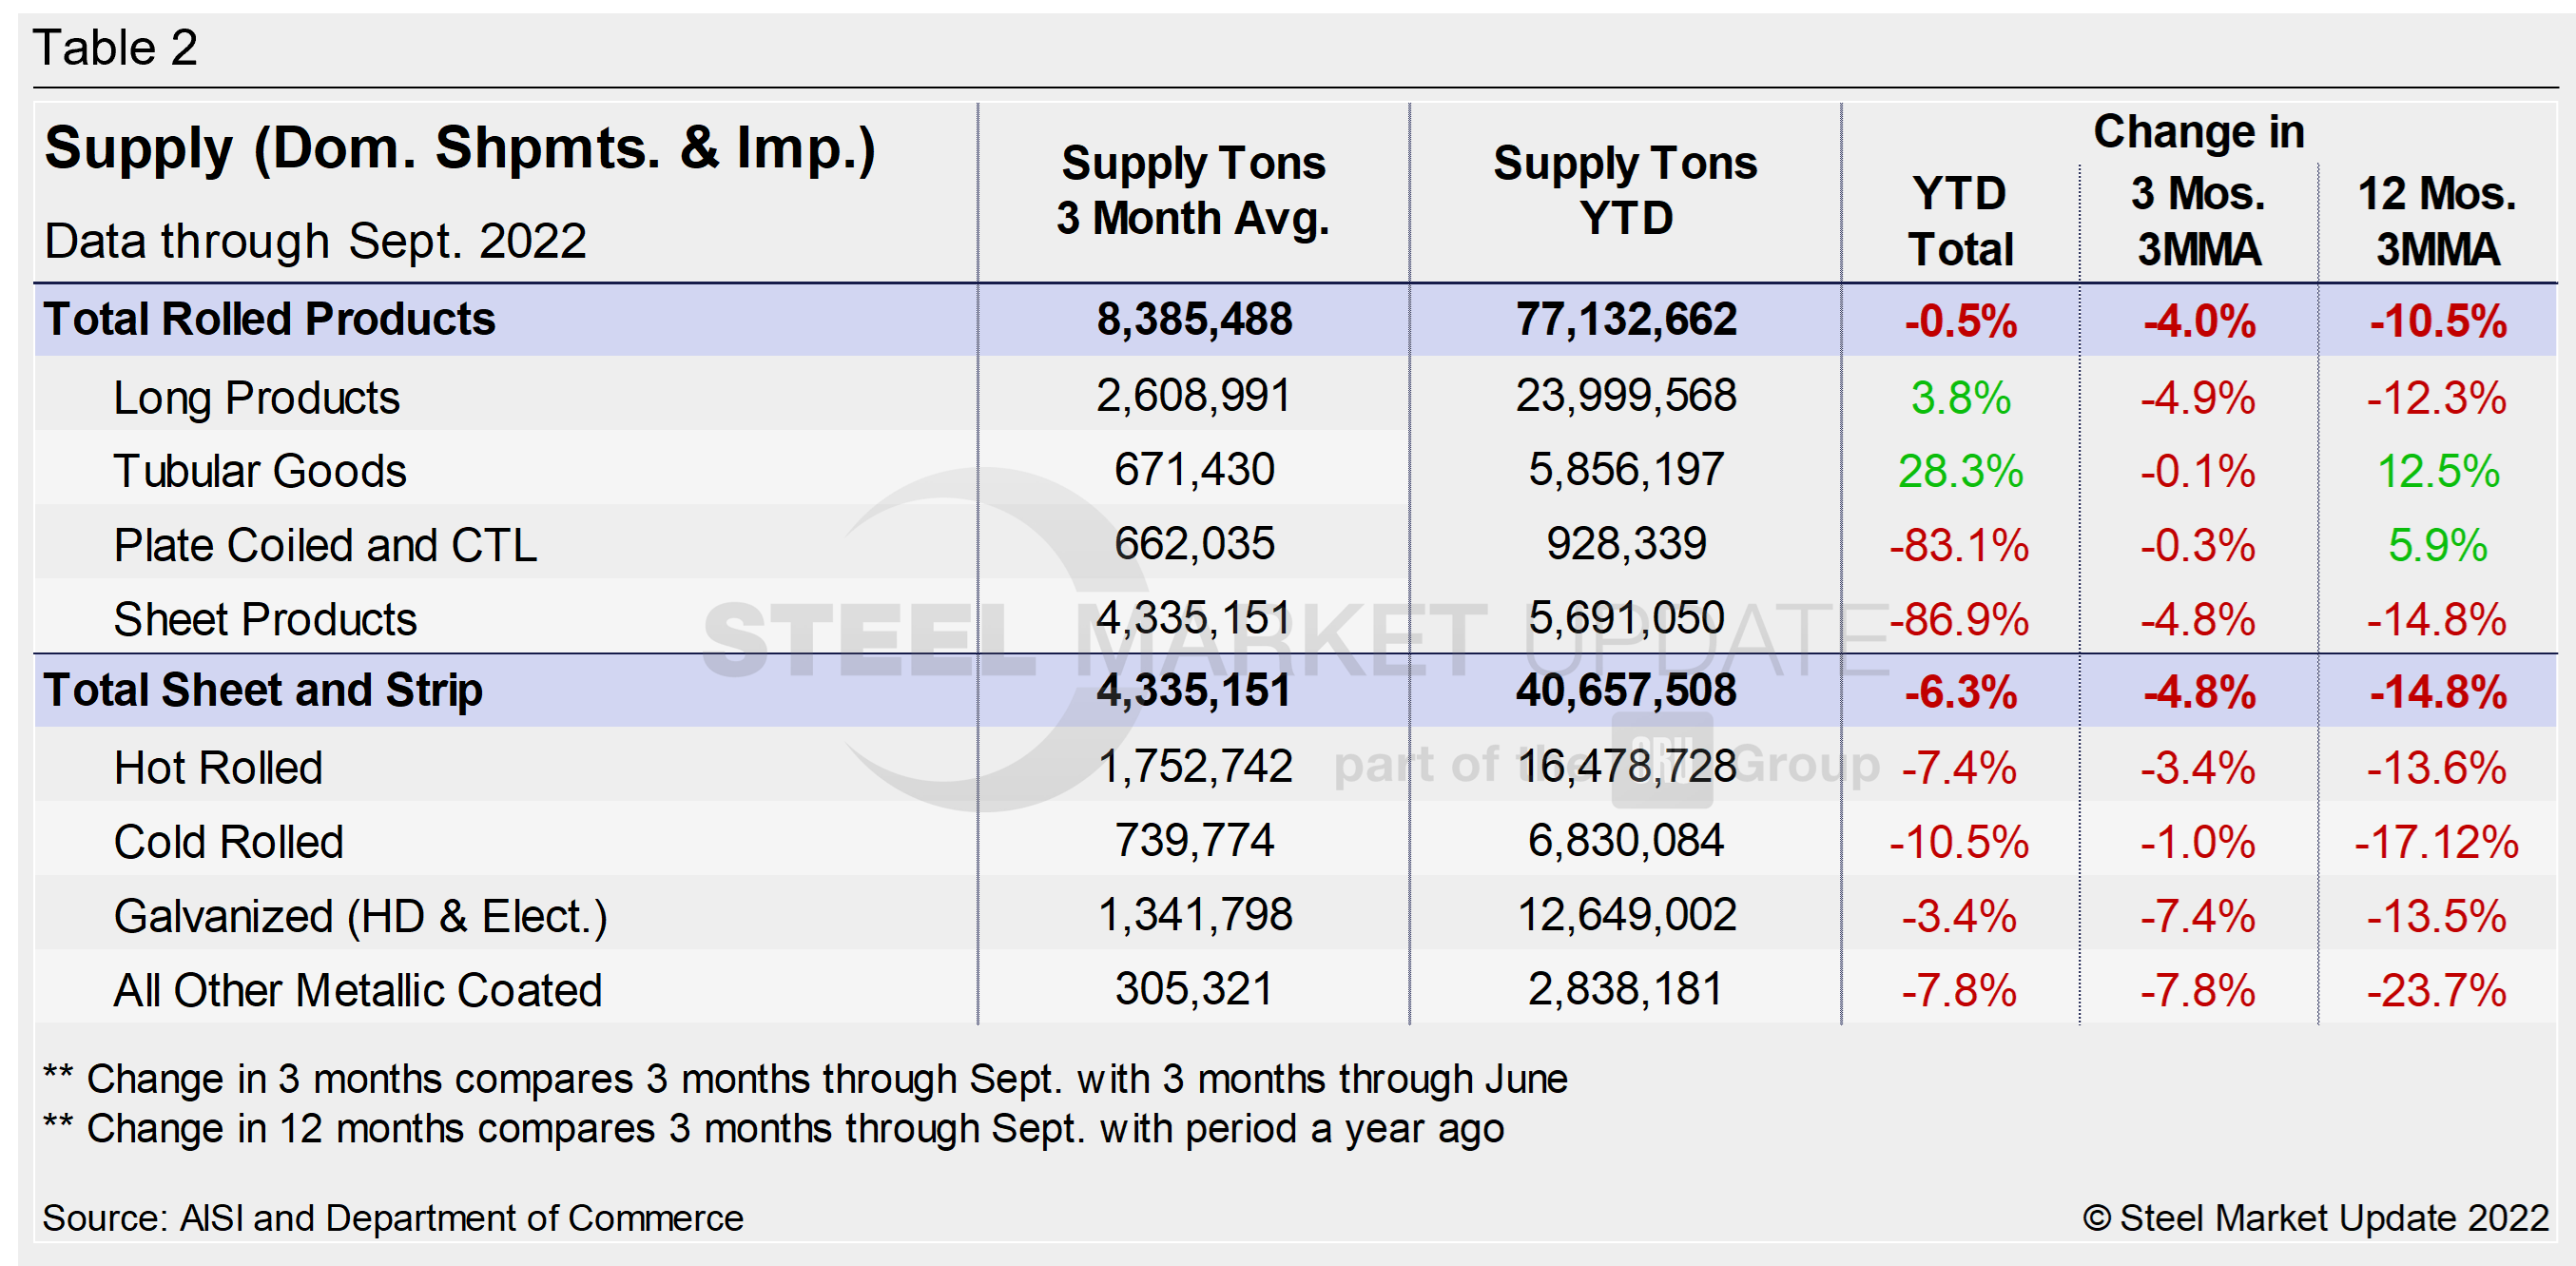
Shipment and supply details for all product groups and individual sheet products are noted in Table 1. Domestic supply (shipments and imports) is shown in Table 2. Total supply (a proxy for market demand) as a 3MMA was down YoY in September, and well behind the 37.5% growth seen the year prior when the market was rebounding from Covid shutdowns.
Apparent supply is defined as domestic mill shipments to domestic locations plus imports. Mill shipments were down more than 11% and a far cry from the 32.8% growth seen during the year-ago period in the same 3MMA comparison. The bright spots are tubular goods and plate products.
Total sheet and strip apparent supply is down YTD (Table 2) compared to 2021 and is similarly lower over the past three months. Total rolled product apparent supply is notably down over the past 12 months on a 3MMA basis, but it is up marginally over the same year-ago period. Note that YoY comparisons have seasonality removed.
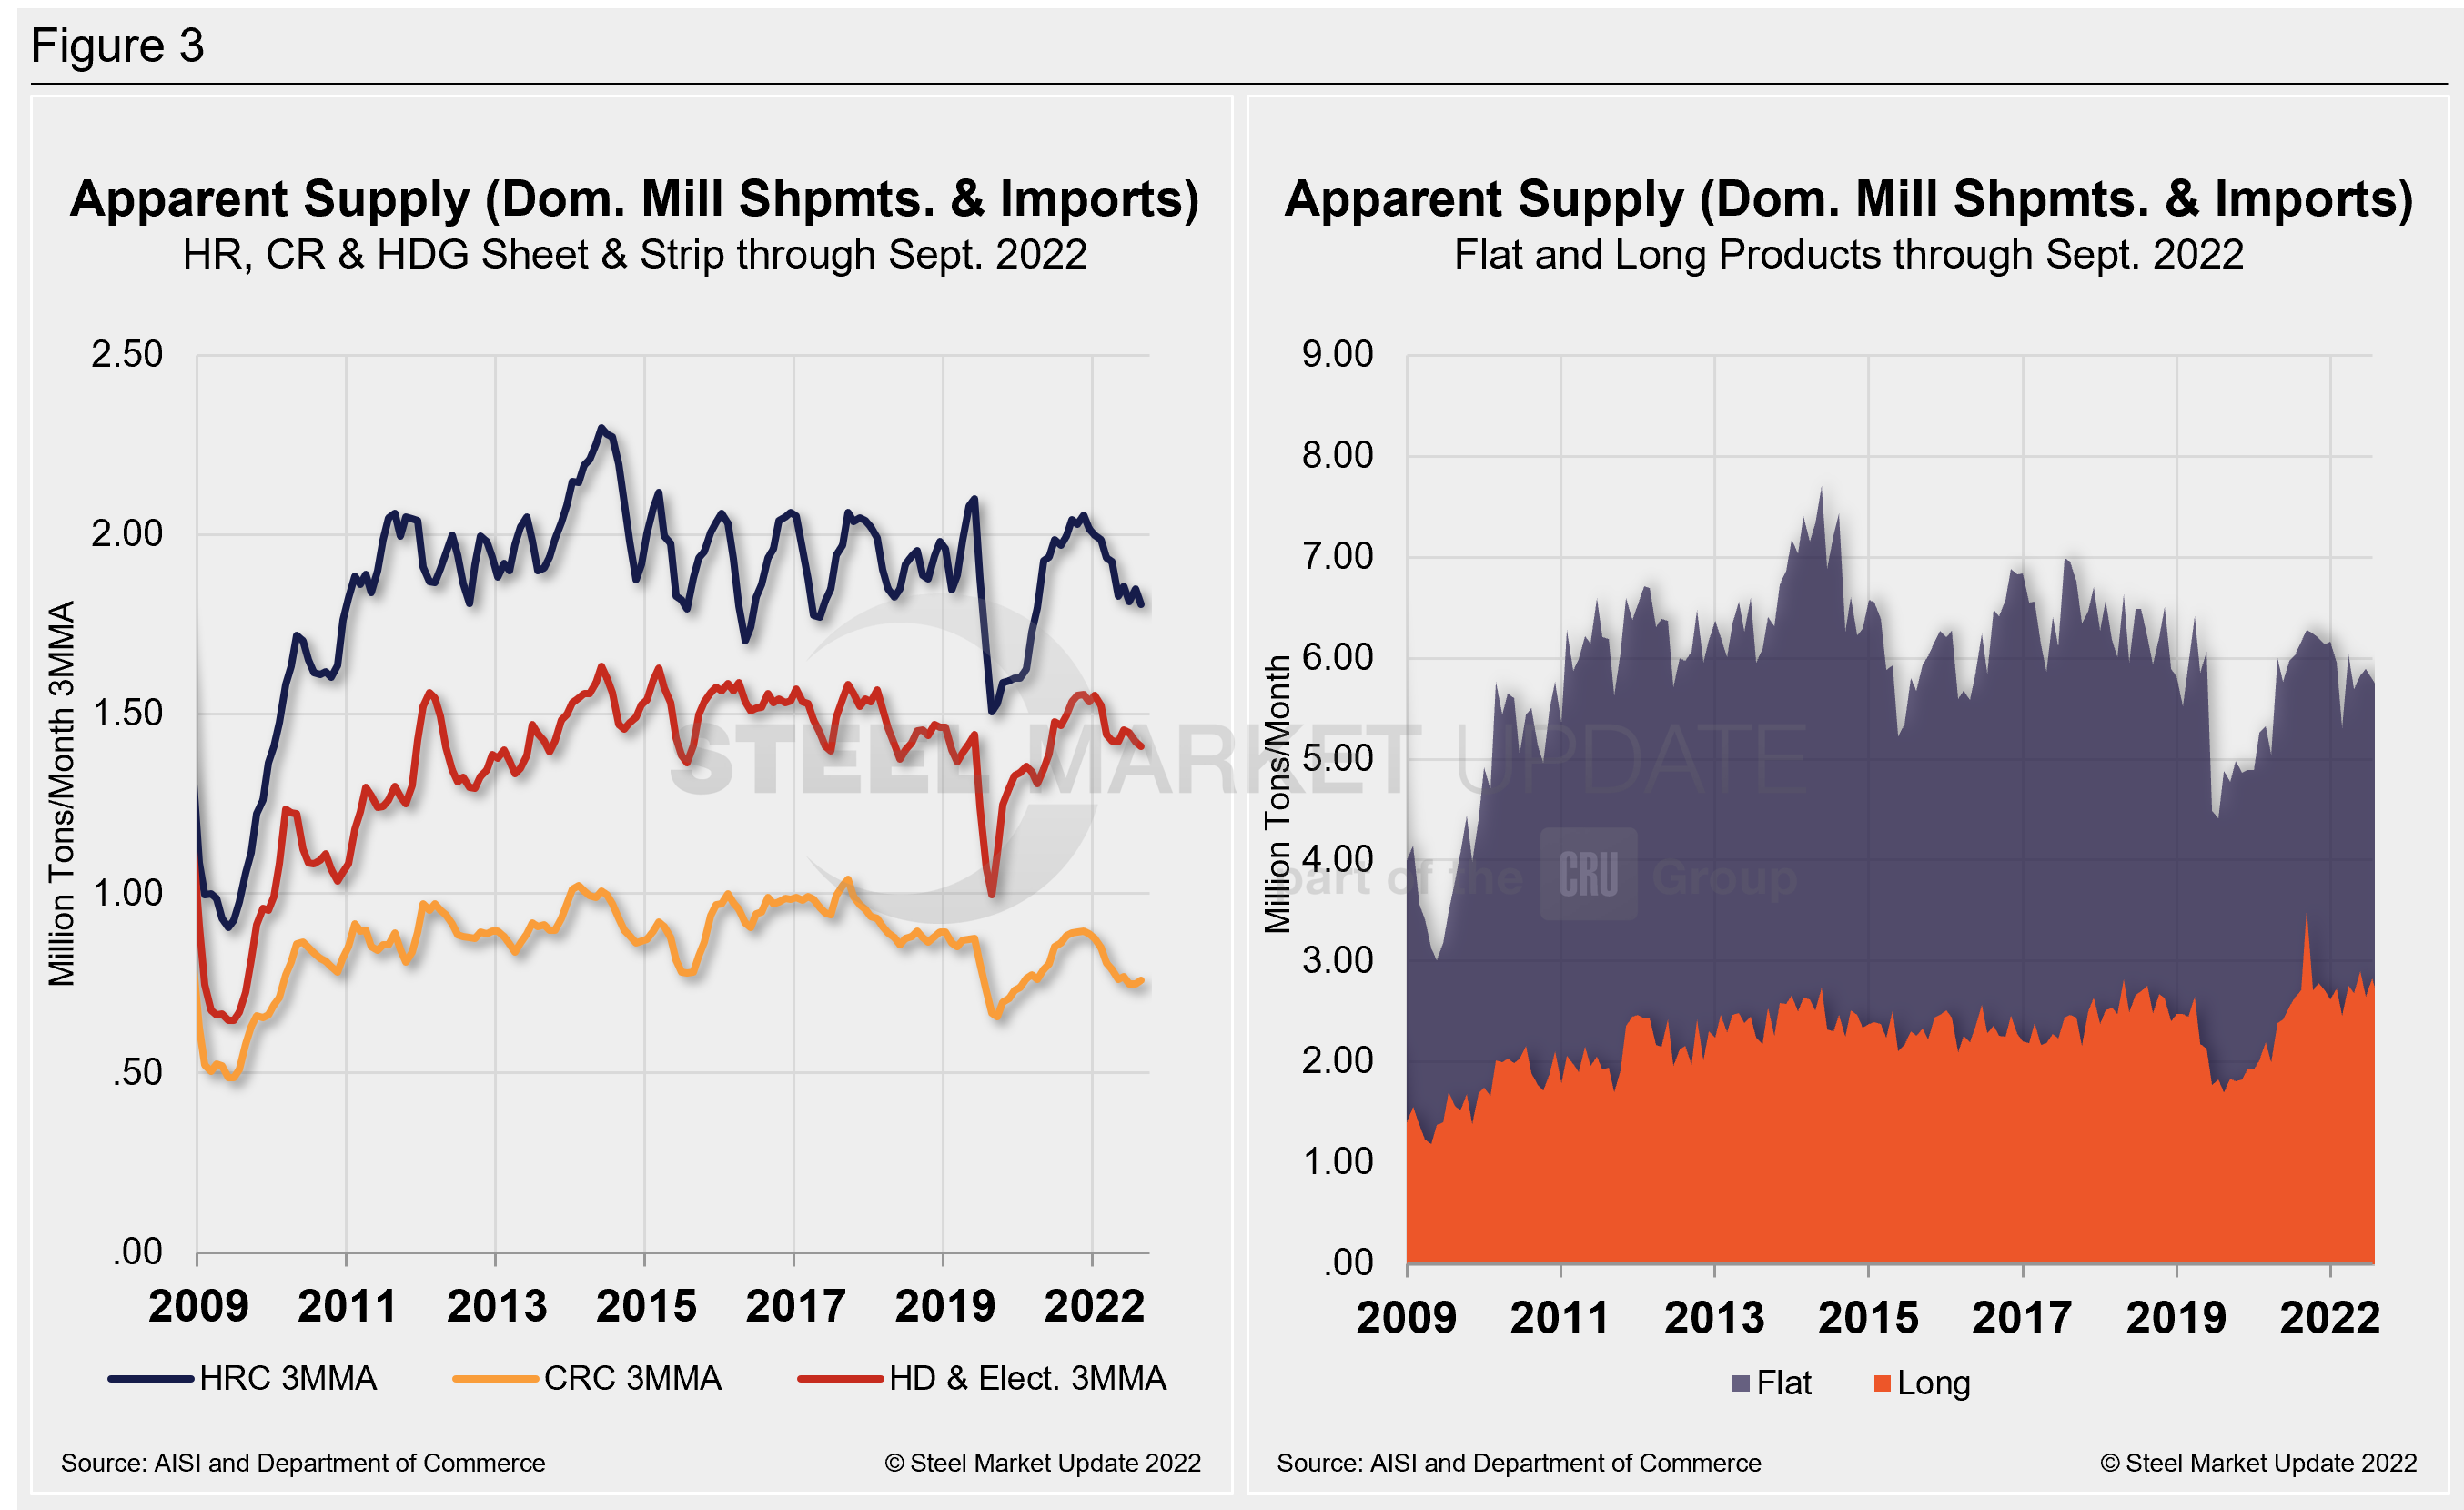
The supply picture for HRC, CRC, and HDG since January 2009 as three-month moving averages versus the long-term comparison between flat and long products is shown side-by-side in Figure 3. On the left chart, all three sheet products are displayed. They had experienced some improvement since mid-2020 but have now been trending downward through September. When compared to the same pre-pandemic period in 2019, all three are down. Supplies of cold rolled have seen the largest percentage decline (-17.1%), followed by hot rolled (-11.5%), and galvanized (hot dipped and electrolytic; -8.4%), from the same pre-pandemic period in 2019. In the right chart, note that these are monthly numbers (not 3MMAs), which show the trend difference between long and flat products including plate.
By David Schollaert, David@SteelMarketUpdate.com


