

Market Data

November 11, 2022
SMU Buyers Sentiment Index Steady, Future 3MMA Up
Written by Brett Linton
Steel Market Update’s (SMU) Steel Buyers Sentiment Index remained roughly steady this week, as it has seen since mid-September. Our Future Buyers Sentiment Index inched down three points but remains in line with levels recorded in late September. Buyers Sentiment peaked earlier this year. It has trended downward since May but nonetheless remains in positive territory. Buyers continue to express concerns about profitability, high-priced inventory, and weakening demand.
SMU’s Buyers Sentiment Index measures how steel buyers feel about their company’s ability to be successful in today’s market, as well as three to six months down the road. We poll steel buyers about sentiment every other week and have historical data going back to 2008.
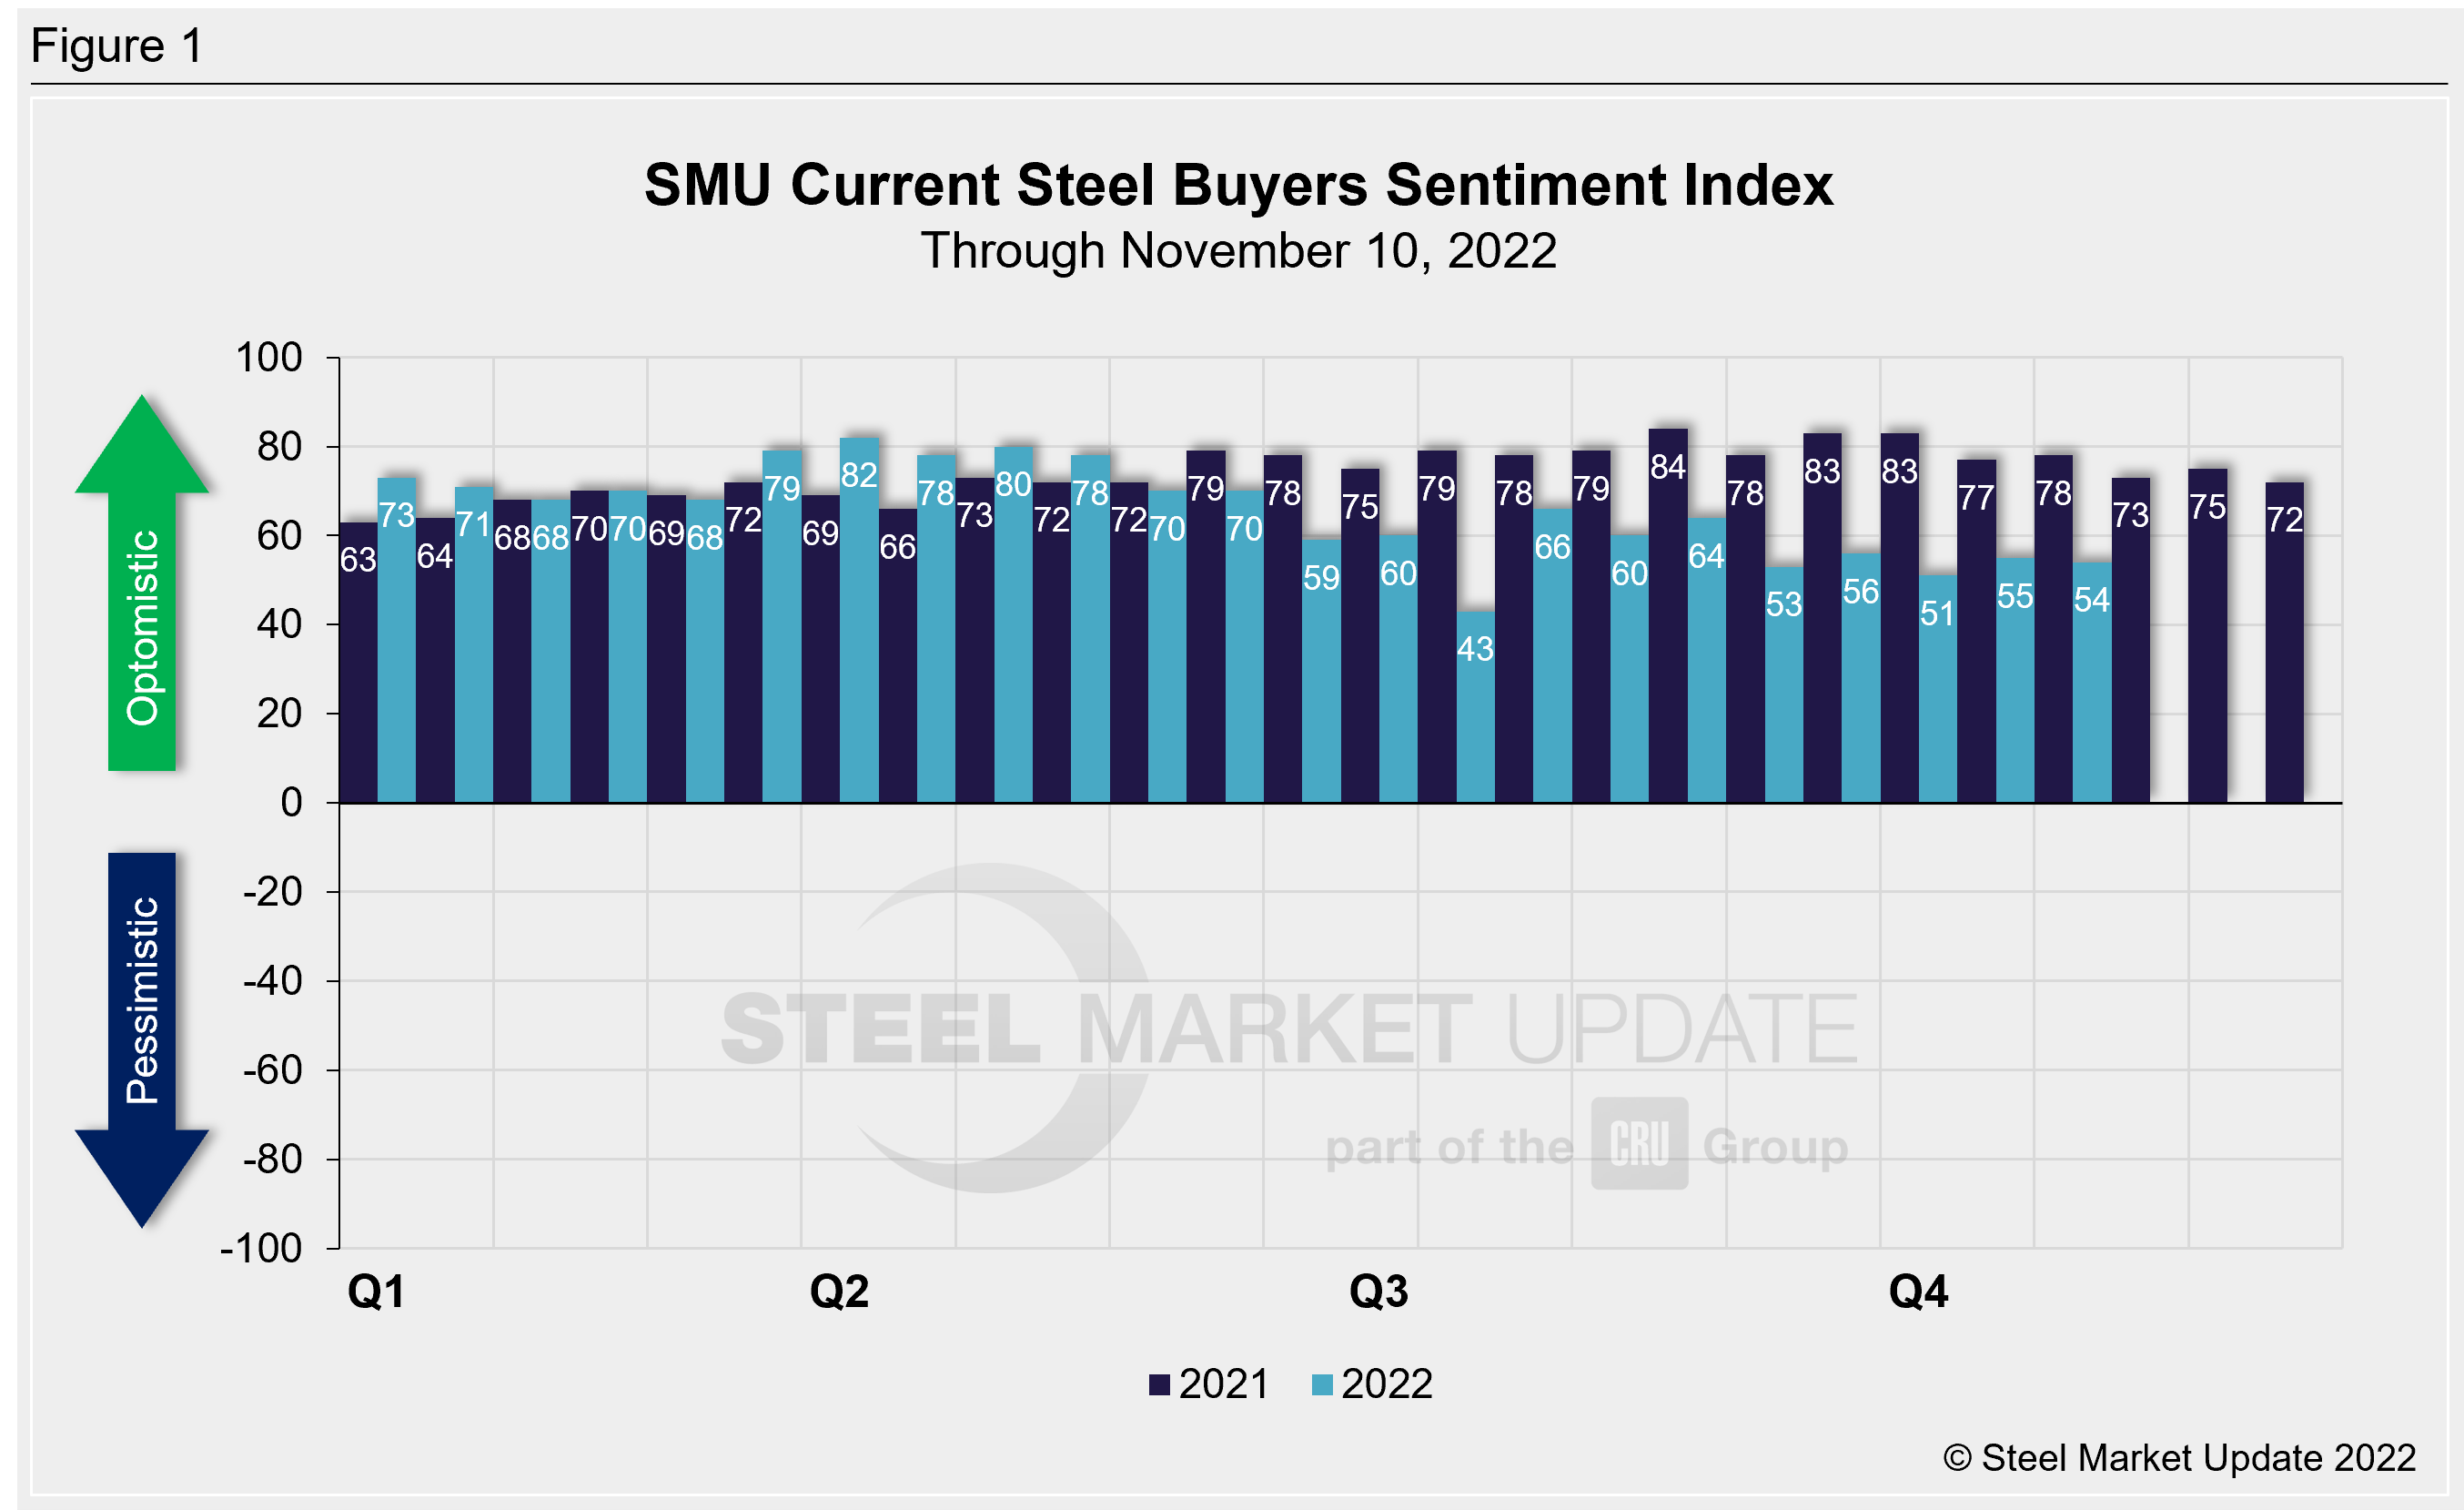
SMU’s Current Buyers Sentiment Index declined one point to +54 through but is up three points compared to our market check one month ago (Figure 1). Current Buyers Sentiment continues to bounce around the mid/low +50s. Sentiment briefly slipped to a two-year low of +43 in mid-July, down from a peak of +82 in March.
SMU’s Future Buyers Sentiment Index declined slightly compared to our previous survey, down three points to +66. Future Sentiment measures buyers’ feelings about business conditions three to six months in the future. Future sentiment is up five points compared to levels one month ago and is now at the second highest level recorded since May (Figure 2). Future Sentiment has fluctuated between +53 and +69 over the last quarter. Back in mid-July, Future Sentiment fell to a nearly two-year low of +43. Earlier this year, we saw the highest Future Sentiment readings in our 13.5-year history: late April and early May both registered +80.
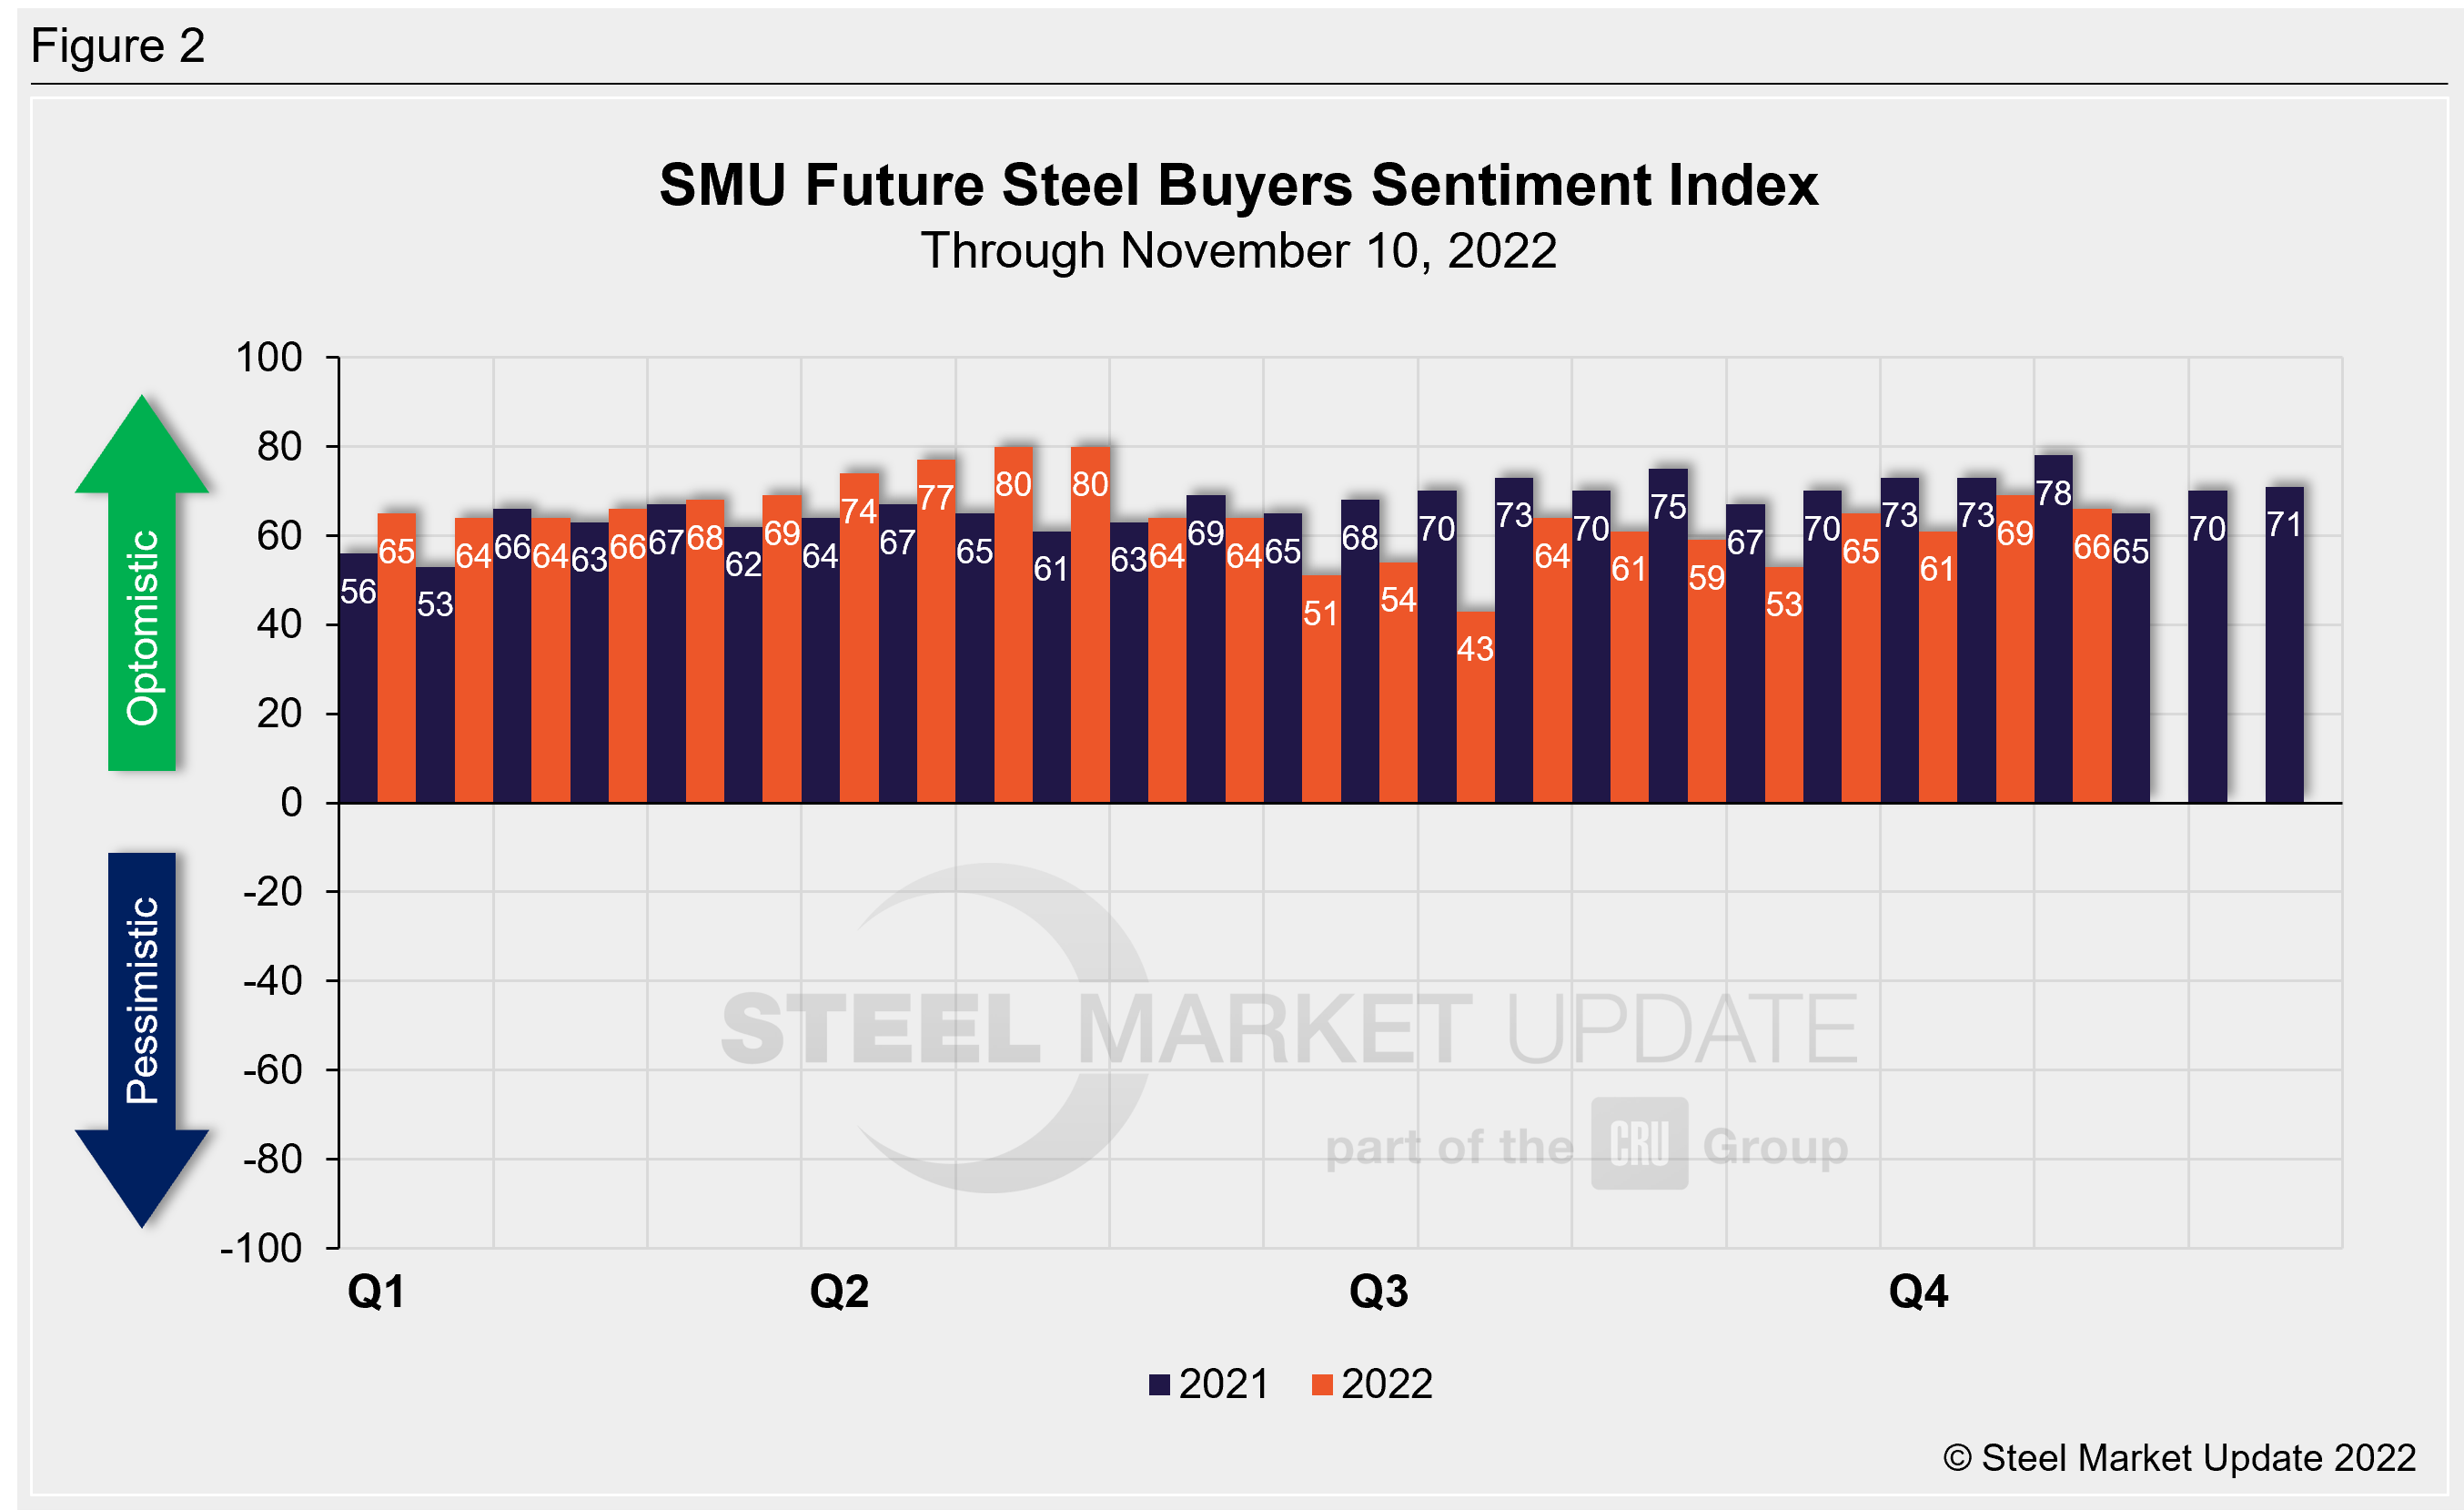
Recall that as steel prices peaked in September 2021, Current Sentiment reached an all-time high of +84. Future Sentiment peaked two months later at +78. The lowest levels over the past decade both occurred in April 2020, at -8 and +10 respectively.
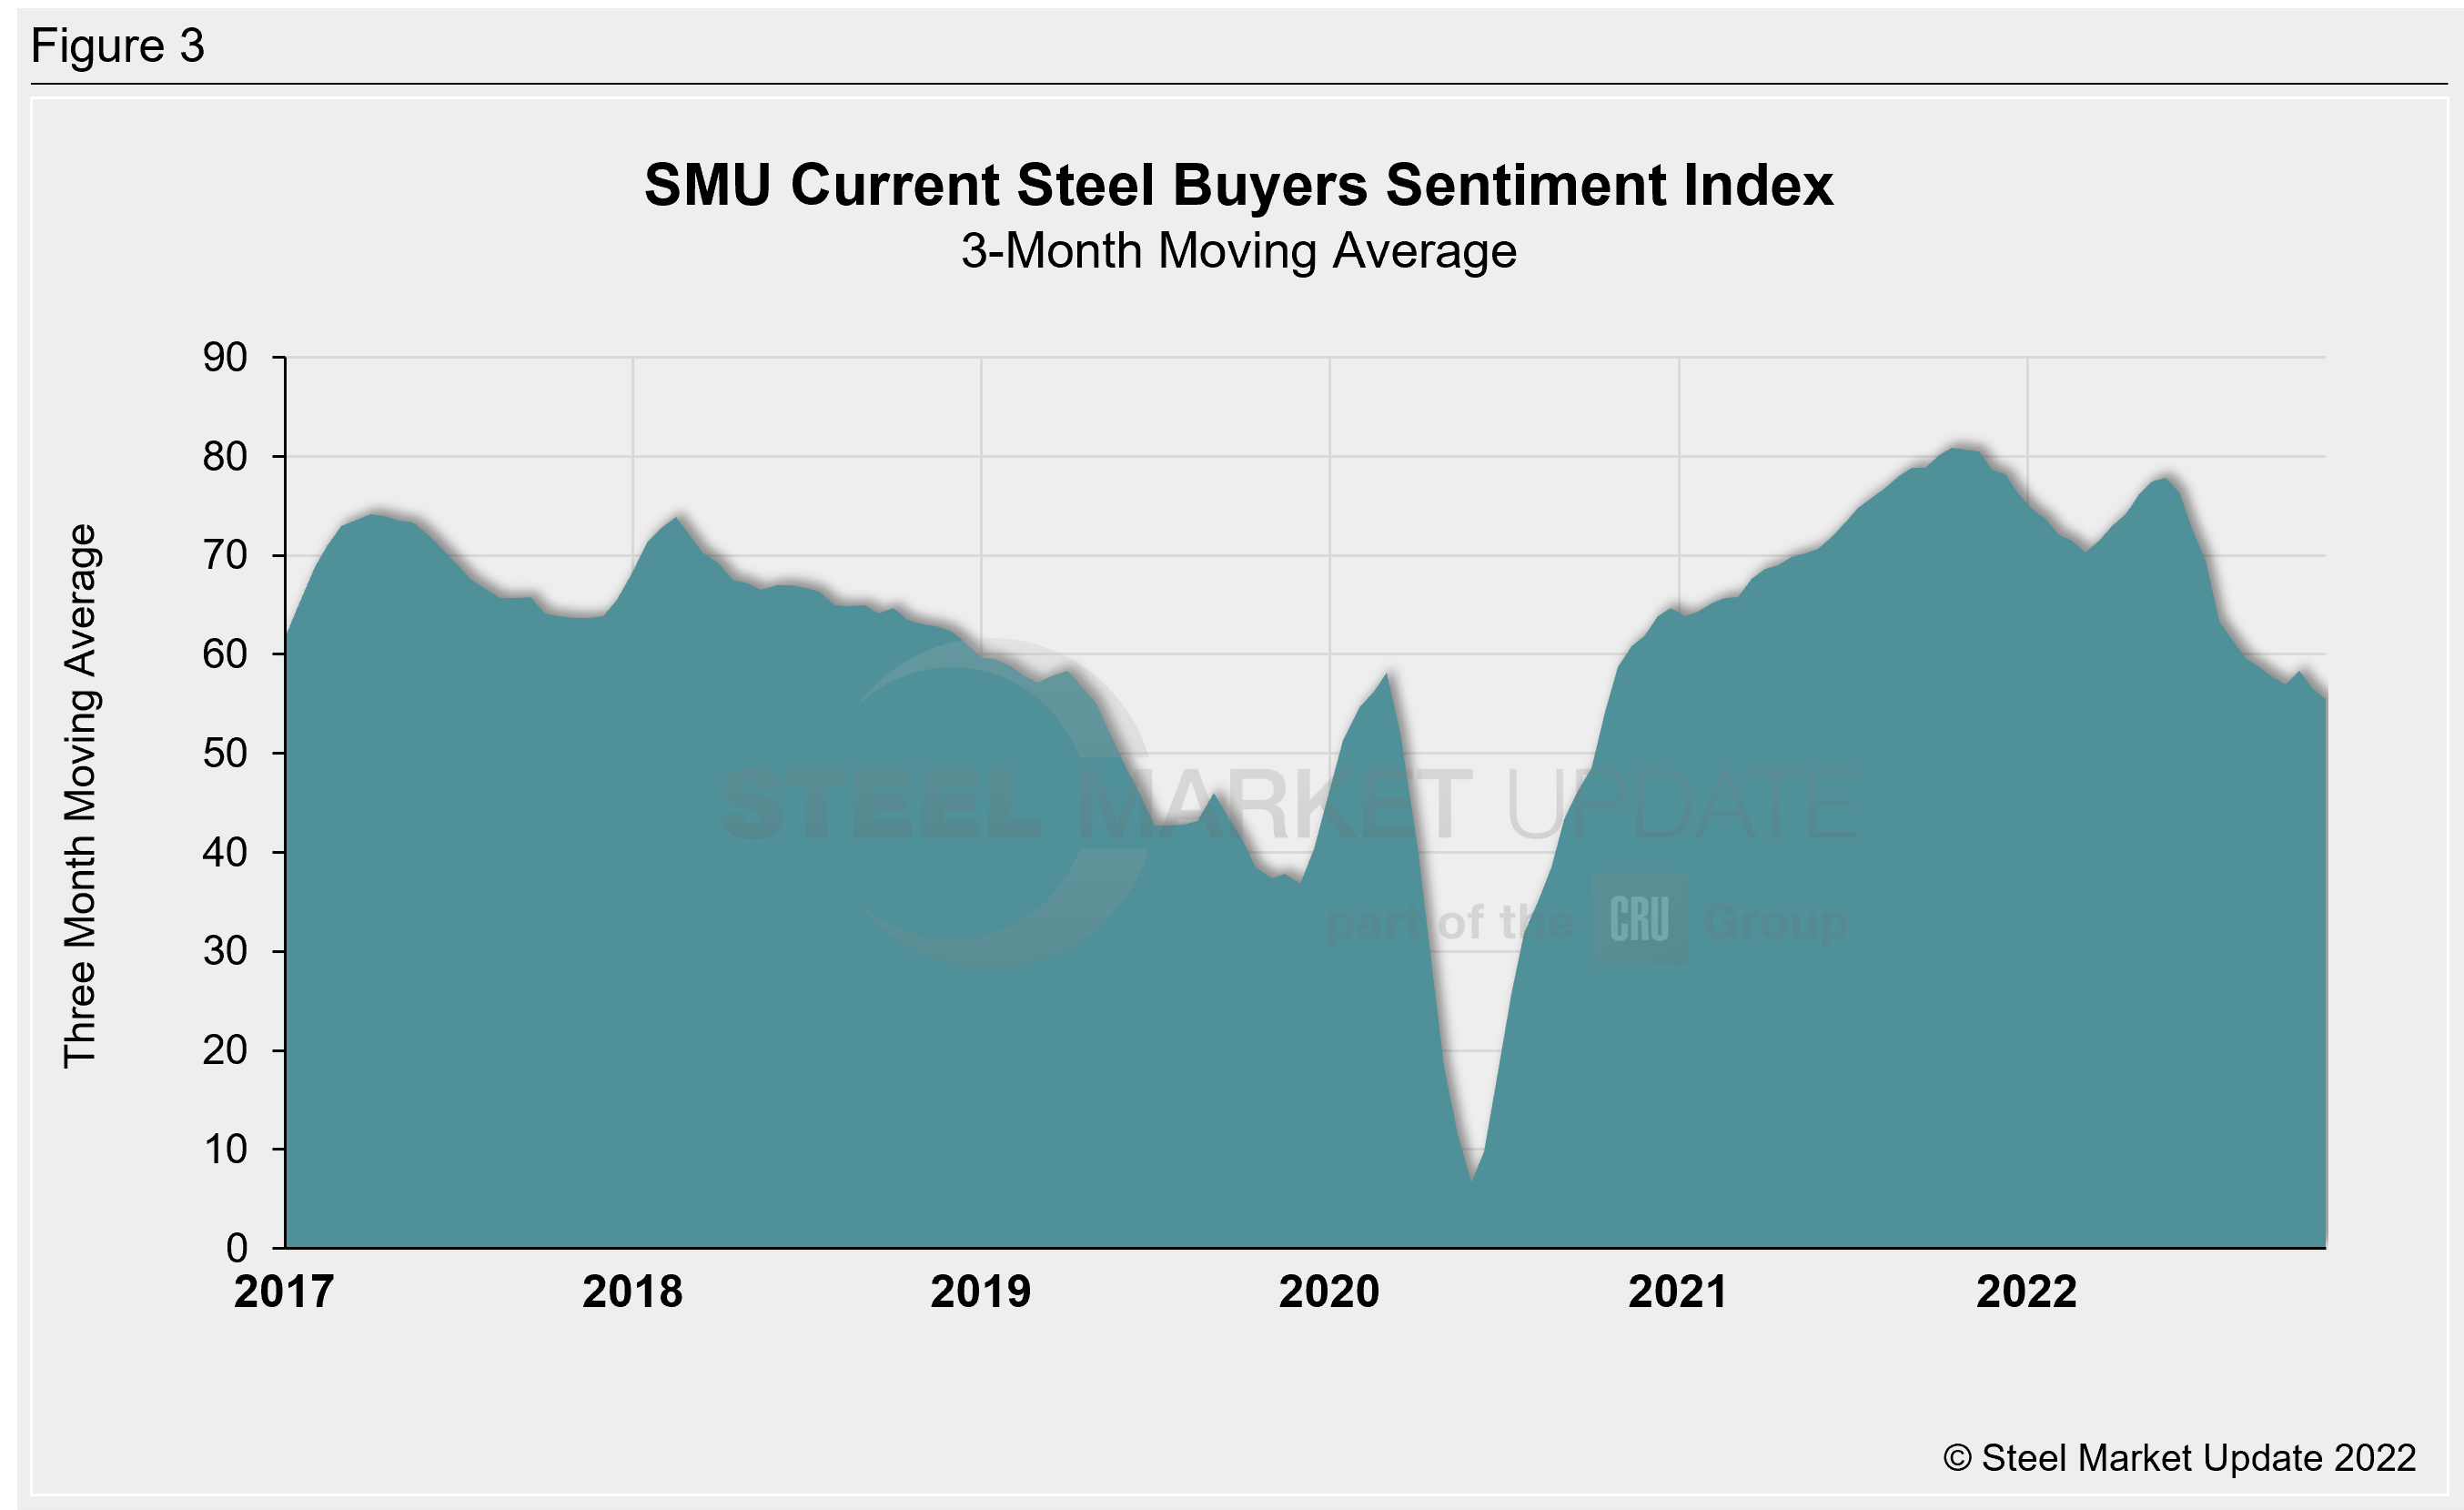
Measured as a three-month moving average, the Current Sentiment 3MMA declined to +55.50 this week. This measure has continued to trend downward, as it has since May (Figure 3). It is now the lowest since mid-October 2020, when it was +54.17. Nearly six months ago, the Current Sentiment 3MMA peaked at +77.83, the highest level since December 2021.
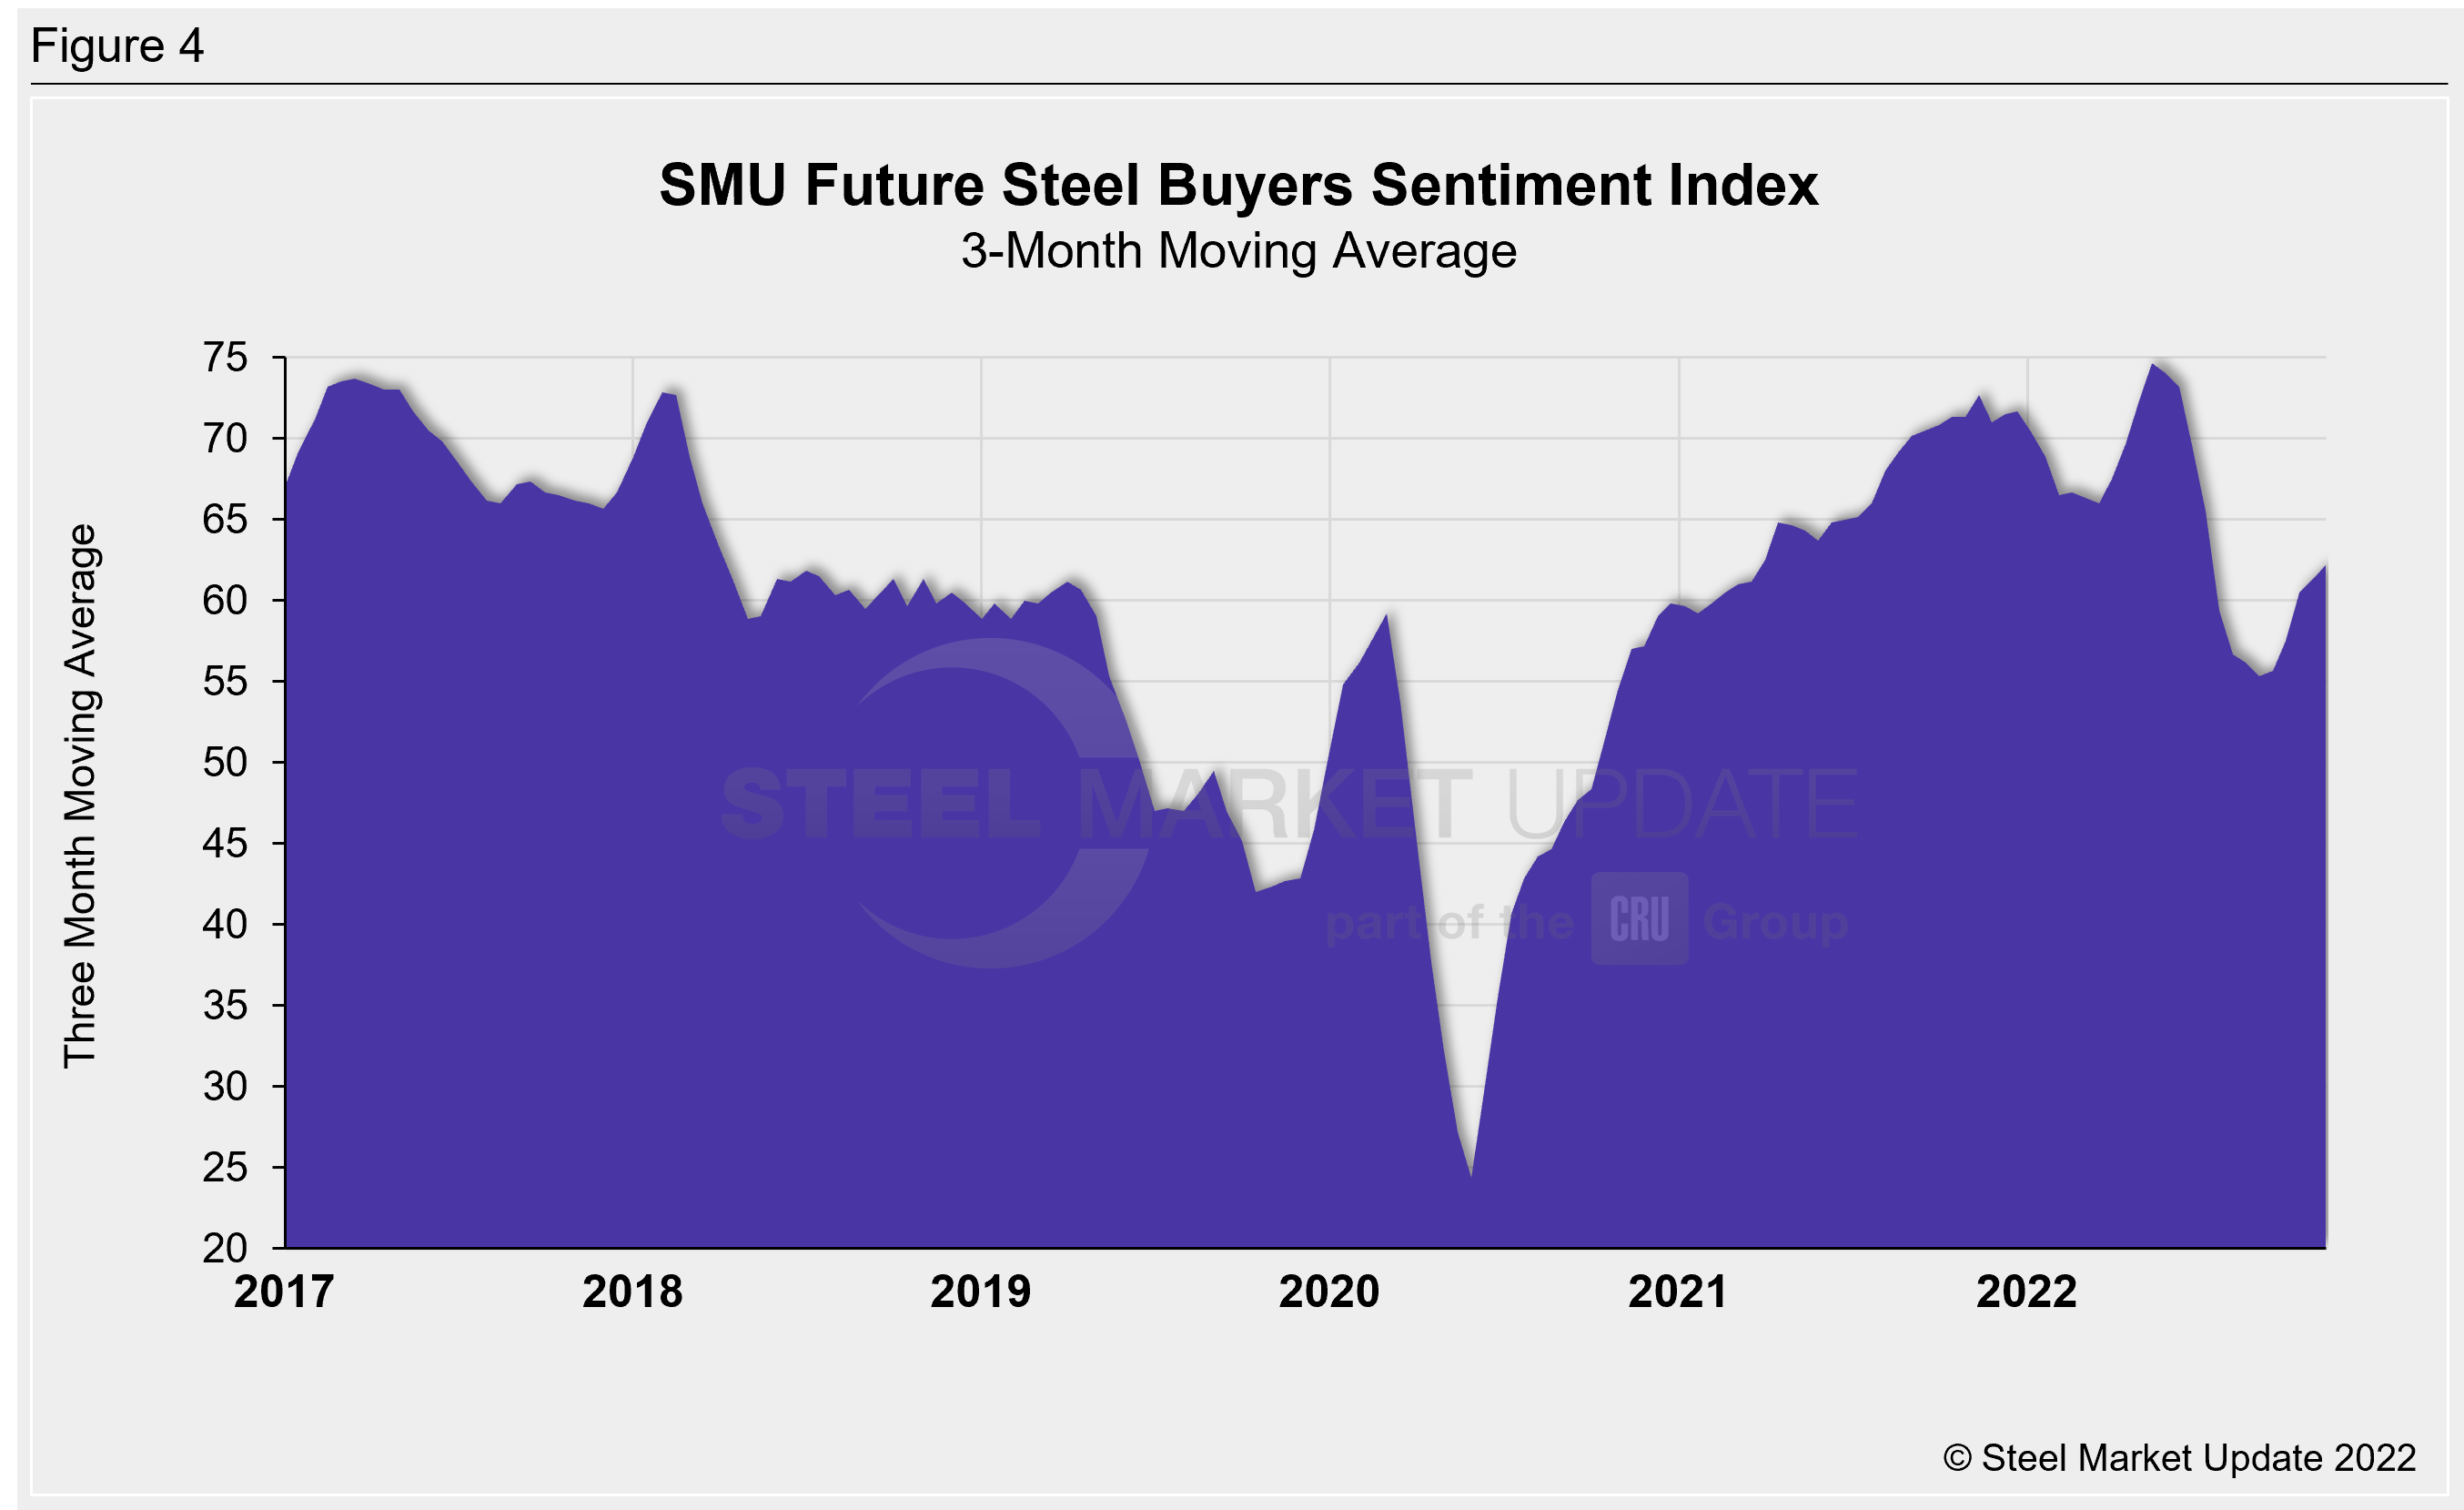
The Future Sentiment 3MMA increased again this week to +62.17, almost two points higher than one month prior (Figure 4). Unlike the Current Sentiment 3MMA, the Future 3MMA has shown signs of recovery over the last three surveys. The early September reading of +55.33 was the lowest seen since October 2020. The Future Sentiment 3MMA has risen in each survey since and is now at the highest level since early July. Recall that the Future Sentiment 3MMA had reached a record high of +74.67 in May, surpassing the previous record of +73.67 set in March 2017.
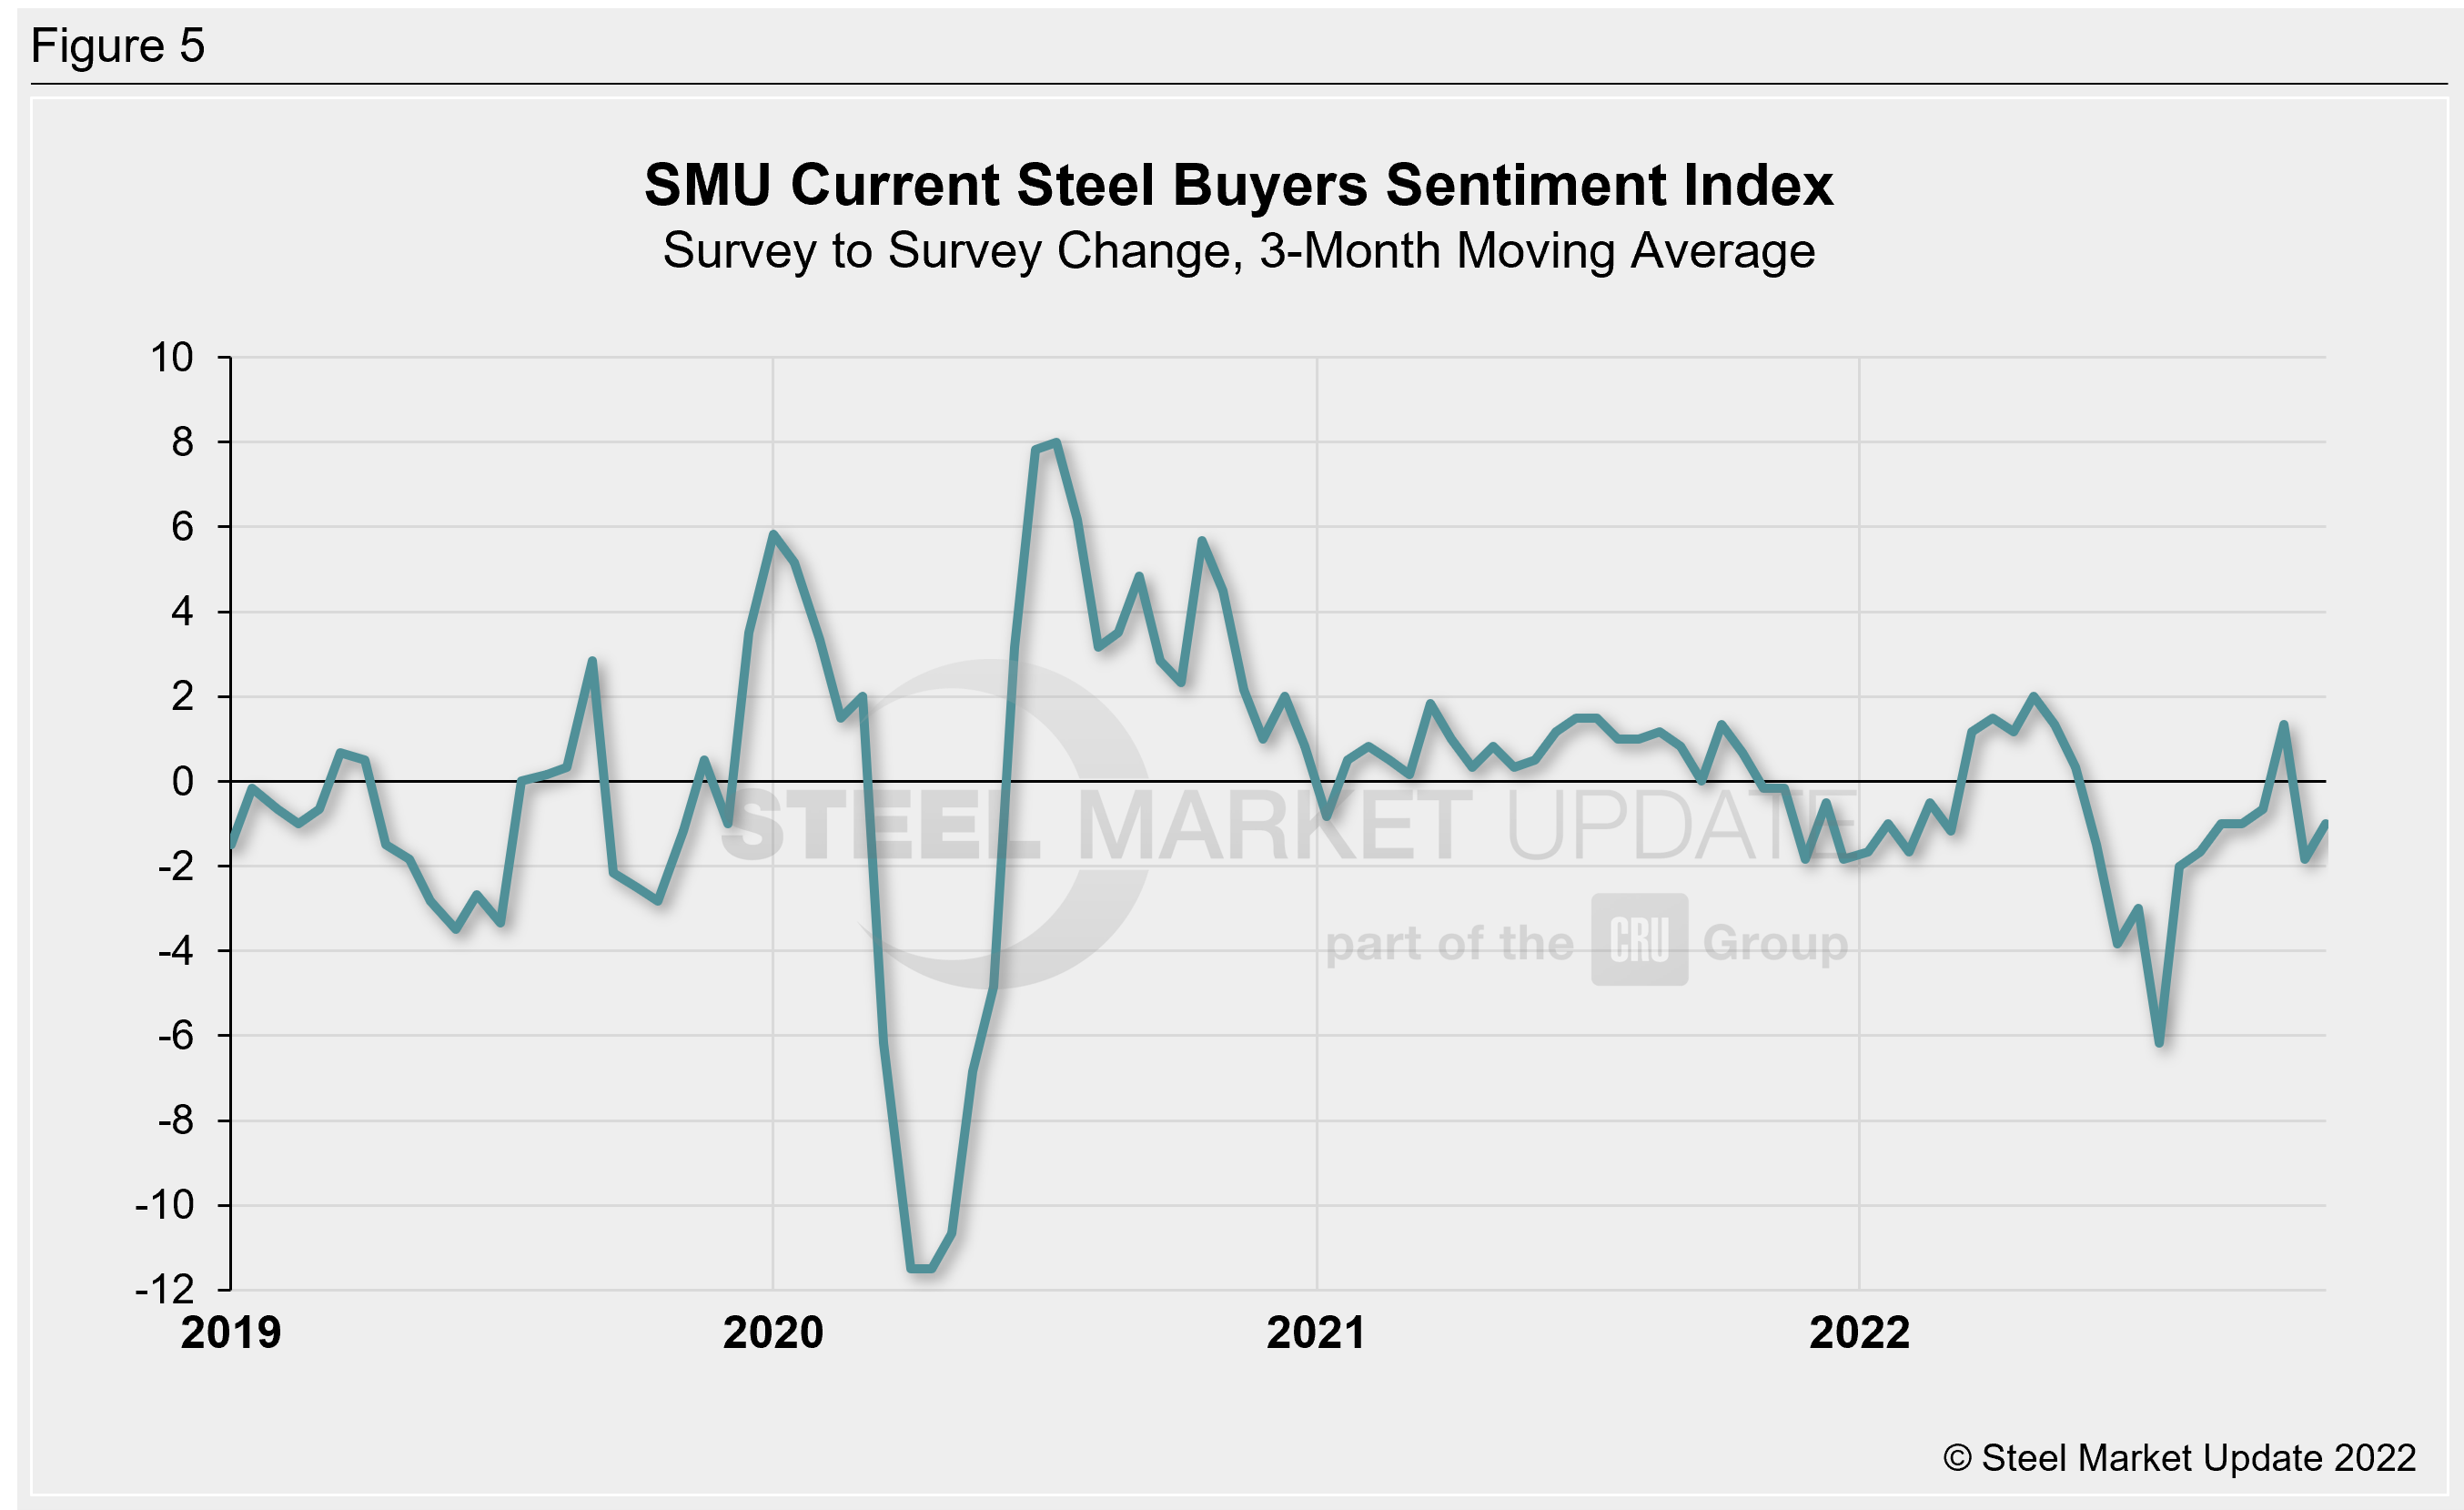
One helpful way to analyze the magnitude of Sentiment movements is to measure the survey-to-survey change in the Current Sentiment Index (Figure 5). On a 3MMA basis through the early November, the survey-to-survey change is down one point compared to two weeks prior. Other than mid-October, we have seen negative growth rates in every survey since early June. In late July, we saw a six-point decline, which was the largest change seen since April 2020. Between November 2020 and June 2022, the survey-to-survey change in our 3MMA Sentiment reading was relatively stable, never exceeding two points. In late June of this year, it began to exceed that range and did so through July.
What SMU Survey Respondents Had to Say:
“Typical seasonal slowdown but with added global recession worries.”
“Customers pushing out orders and too much expensive inventory.”
“Tons are strong, demand is there, despite prices and recession talk.”
“Backlogs still at record levels. We are shipping everything we can build as other components arrive.”
“Our inventory is in a good position, and we will look to lock up Q1 business.”
“It needs to correct sooner than later.”
“We continue to slow down.”
“Interest rates are very high, and the outlook is harmed with the election cycle.”
“December will be a bust.”
“We have a good backlog.”
About the SMU Steel Buyers Sentiment Index
The SMU Steel Buyers Sentiment Index is a measurement of the current attitude of buyers and sellers of flat-rolled steel products in North America regarding how they feel about their company’s opportunity for success in today’s market. It is a proprietary product developed by Steel Market Update for the North American steel industry. Tracking steel buyers’ sentiment is helpful in predicting their future behavior.
Positive readings run from +10 to +100. A positive reading means the meter on the right-hand side of our home page will fall in the green area indicating optimistic sentiment. Negative readings run from -10 to -100. They result in the meter on our homepage trending into the red, indicating pessimistic sentiment. A reading of “0” (+/- 10) indicates a neutral sentiment (or slightly optimistic or pessimistic), which is most likely an indicator of a shift occurring in the marketplace. Sentiment is measured via SMU surveys that are conducted twice per month.
We send invitations to participate in our survey to more than 700 North American companies. Approximately 45% of respondents are service centers/distributors, 30% are manufacturers, and the remainder are steel mills, trading companies or toll processors involved in the steel business.
Click here to view an interactive graphic of the SMU Steel Buyers Sentiment Index or the SMU Future Steel Buyers Sentiment Index.
By Brett Linton, Brett@SteelMarketUpdate.com


