

Market Data

November 23, 2022
China Drags Down Global Crude Steel Output in October
Written by David Schollaert
World crude steel production declined month-on-moth (MoM) in October, driven almost singlehandedly by lower Chinese output. Global production was still, however, up 1.1% versus the same period last year, according to World Steel Association (worldsteel) data.
October’s output lost ground when compared to September, down 2.9%, declining for the first time in three months. World crude steel production was estimated at 147.3 million metric tons last month.
October’s decline in crude steel production was driven by an 8.3% decrease in Chinese output, while the rest of the world saw production accelerate by 4.3% MoM. The rest of the world produced a total of 67.5 million metric tons, up from 64.7 million metric tons the month prior.
Last month’s global total was down 15.5%, or 27.1 million metric tons less than May 2021’s all-time high of 174.4 million metric tons. October’s MoM decline put output down 2.5%, or 3.8 million metric tons less than the pre-pandemic period of October 2019.
The US remained the fourth-largest crude steel producer in the world in October, accounting for 6.7 million metric tons, or 4.6%, of the global total. US production last month was up 1.5%, or 100,000 metric tons more than September’s total.
Shown below in Figure 1 is the annualized monthly global steel production on a three-month moving average (3MMA) basis as well as capacity utilization since January 2000. Also shown is the year-on-year (YoY) growth rate of global production on the same 3MMA basis since January 2013. Both are based on worldsteel data.
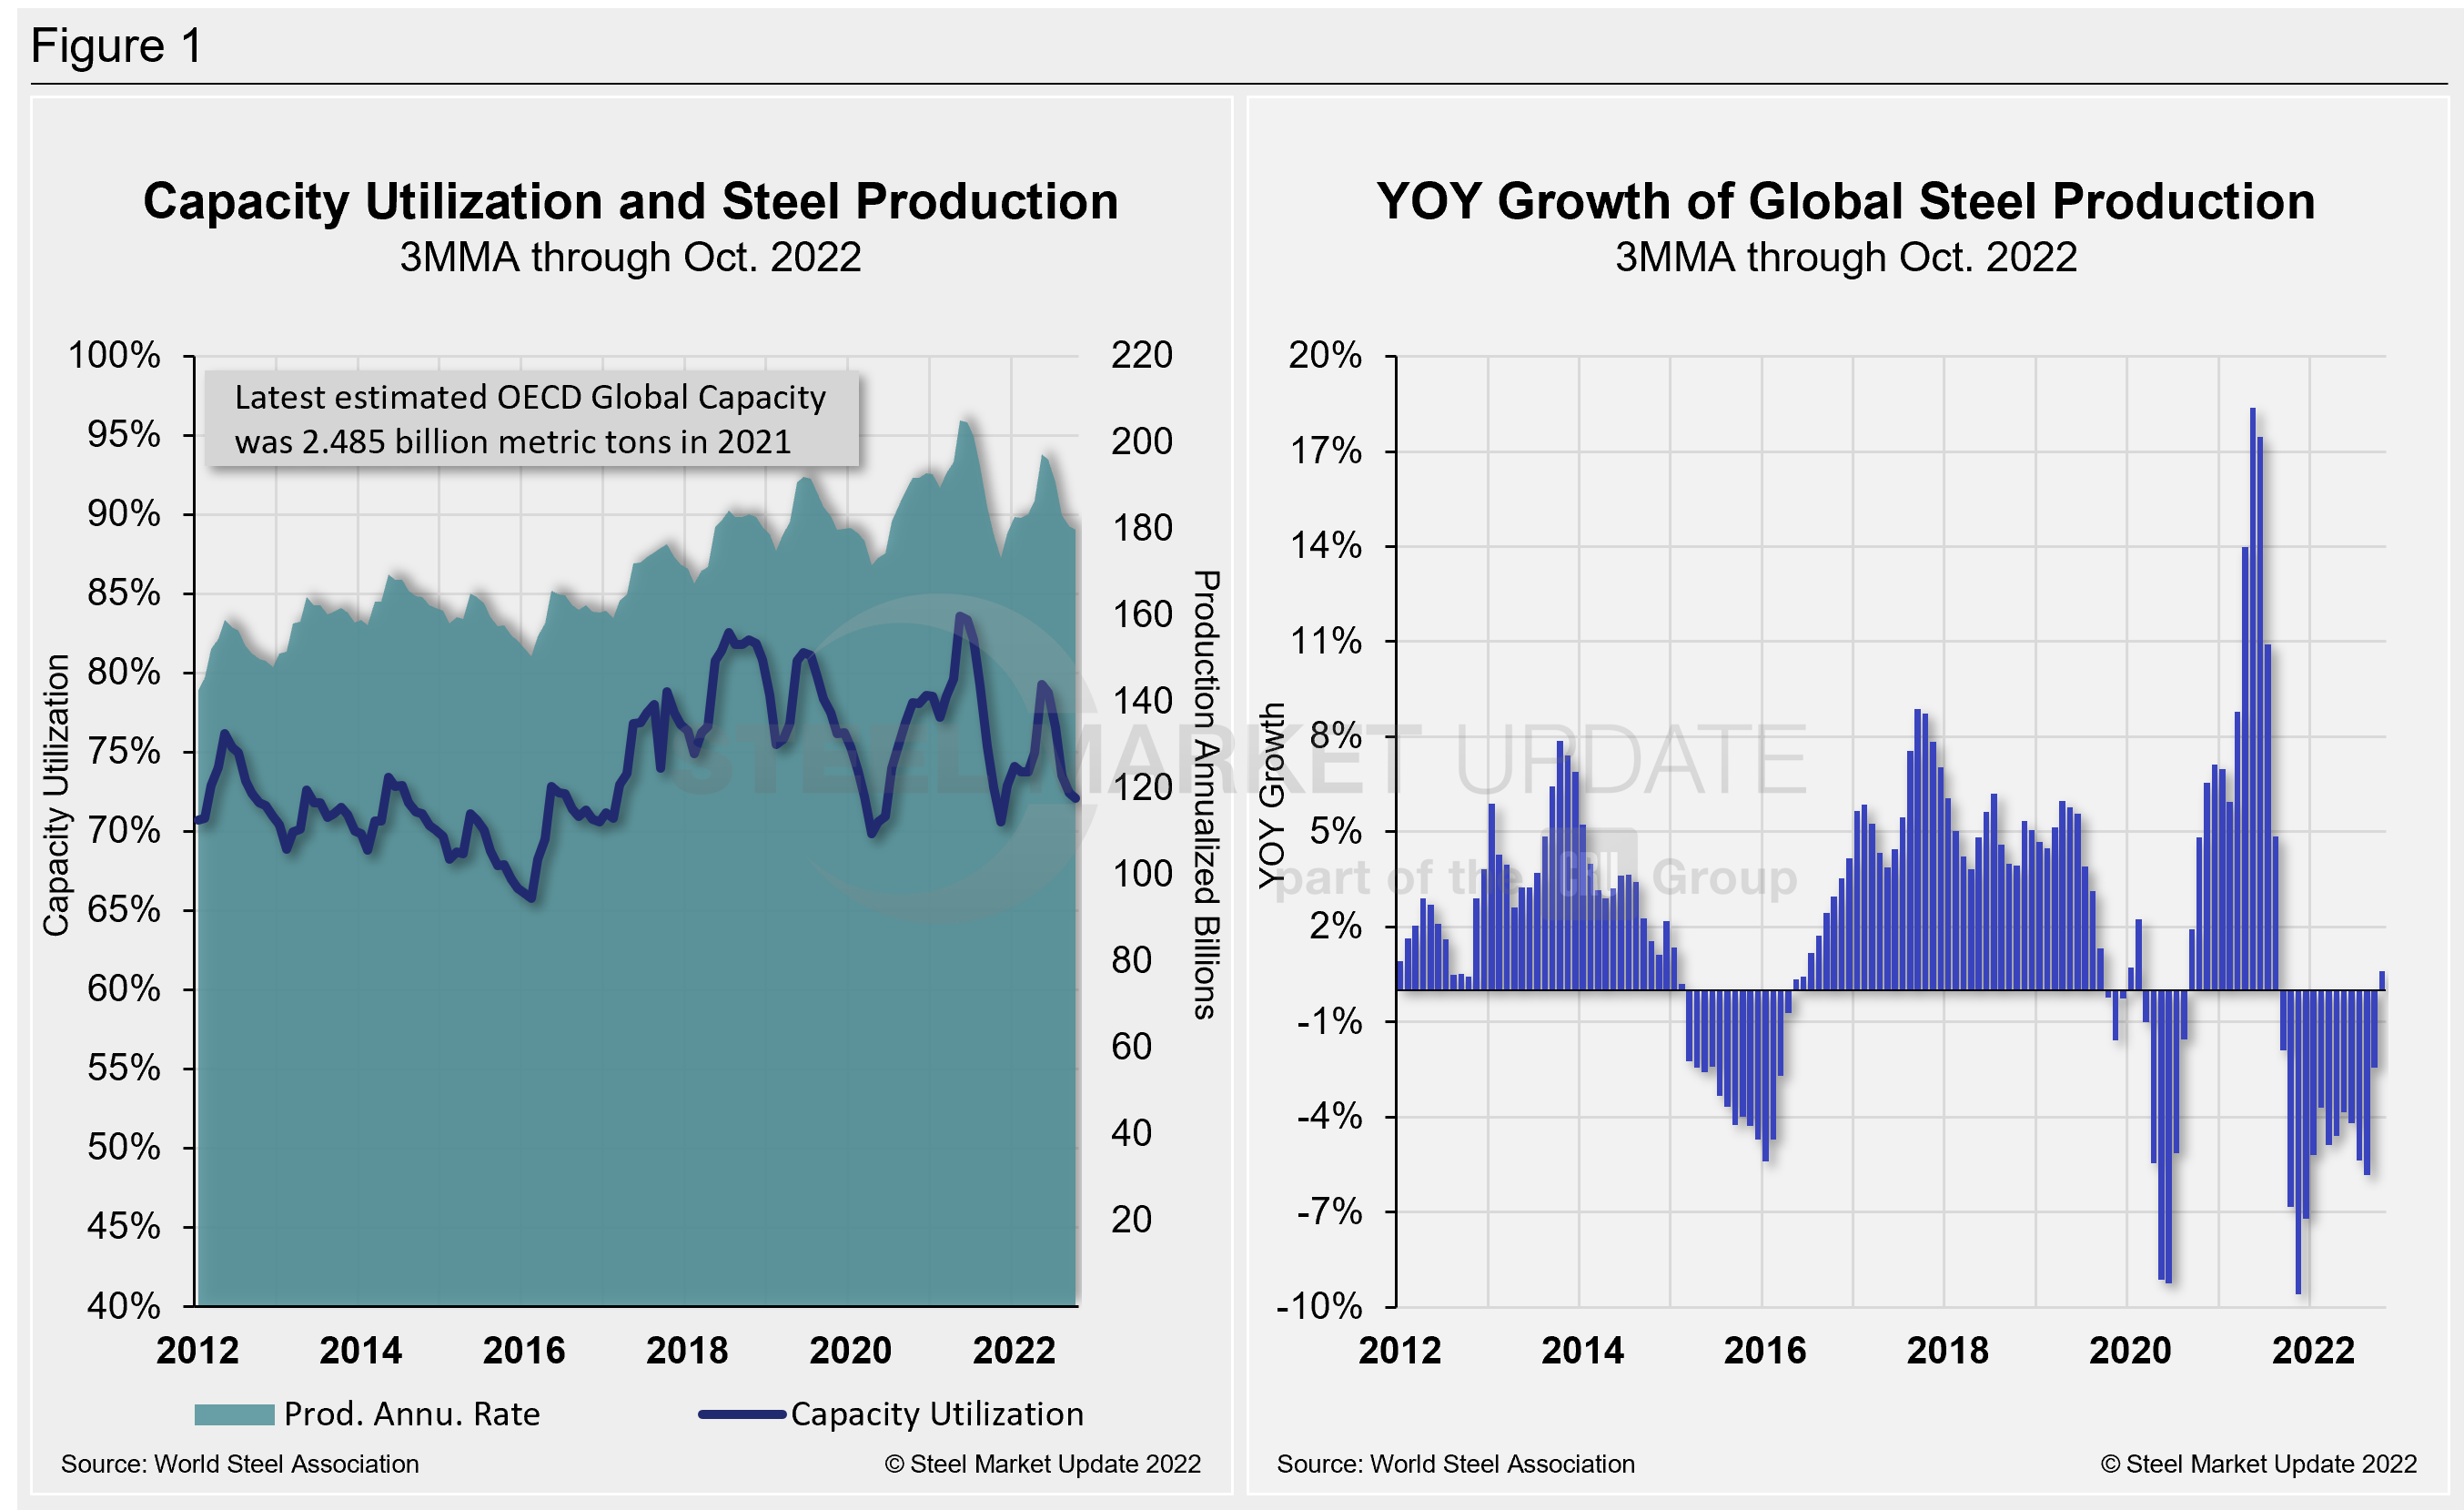
Mill capacity utilization in October on a 3MMA basis was 72.1%, down four percentage points from the month prior. On a tons-per-day basis, production last month was 4.752 million metric tons, down 6% MoM. That figure is 1.06 million metric tons off May 2021’s record rate of 5.813 million metric tons. Growth on a 3MMA basis through October YoY was 0.6%, a three percentage point improvement from the month before. Despite the progress, it’s a far cry from the 18.4% expansion seen in May of last year.
Displayed in the table below is global production broken down into regions. It shows the production of the top 10 nations in October and their share of the global total. It also shows the latest three months and 12 months of production through last month with YoY growth rates for each period. Regions are shown in black font and individual nations in gray.
World steel production overall is down in both the three- and 12-month comparisons, and down nearly universally over the same periods regionally and across the globe’s top-producing nations. The results show a significant deceleration from the 10.9% growth just about one year ago. Despite the decline in October, some positive momentum has remained: the three-month growth rate is better than the 12-month growth rate. It’s just the second time the growth rate has shifted following 11 consecutive months of decline.
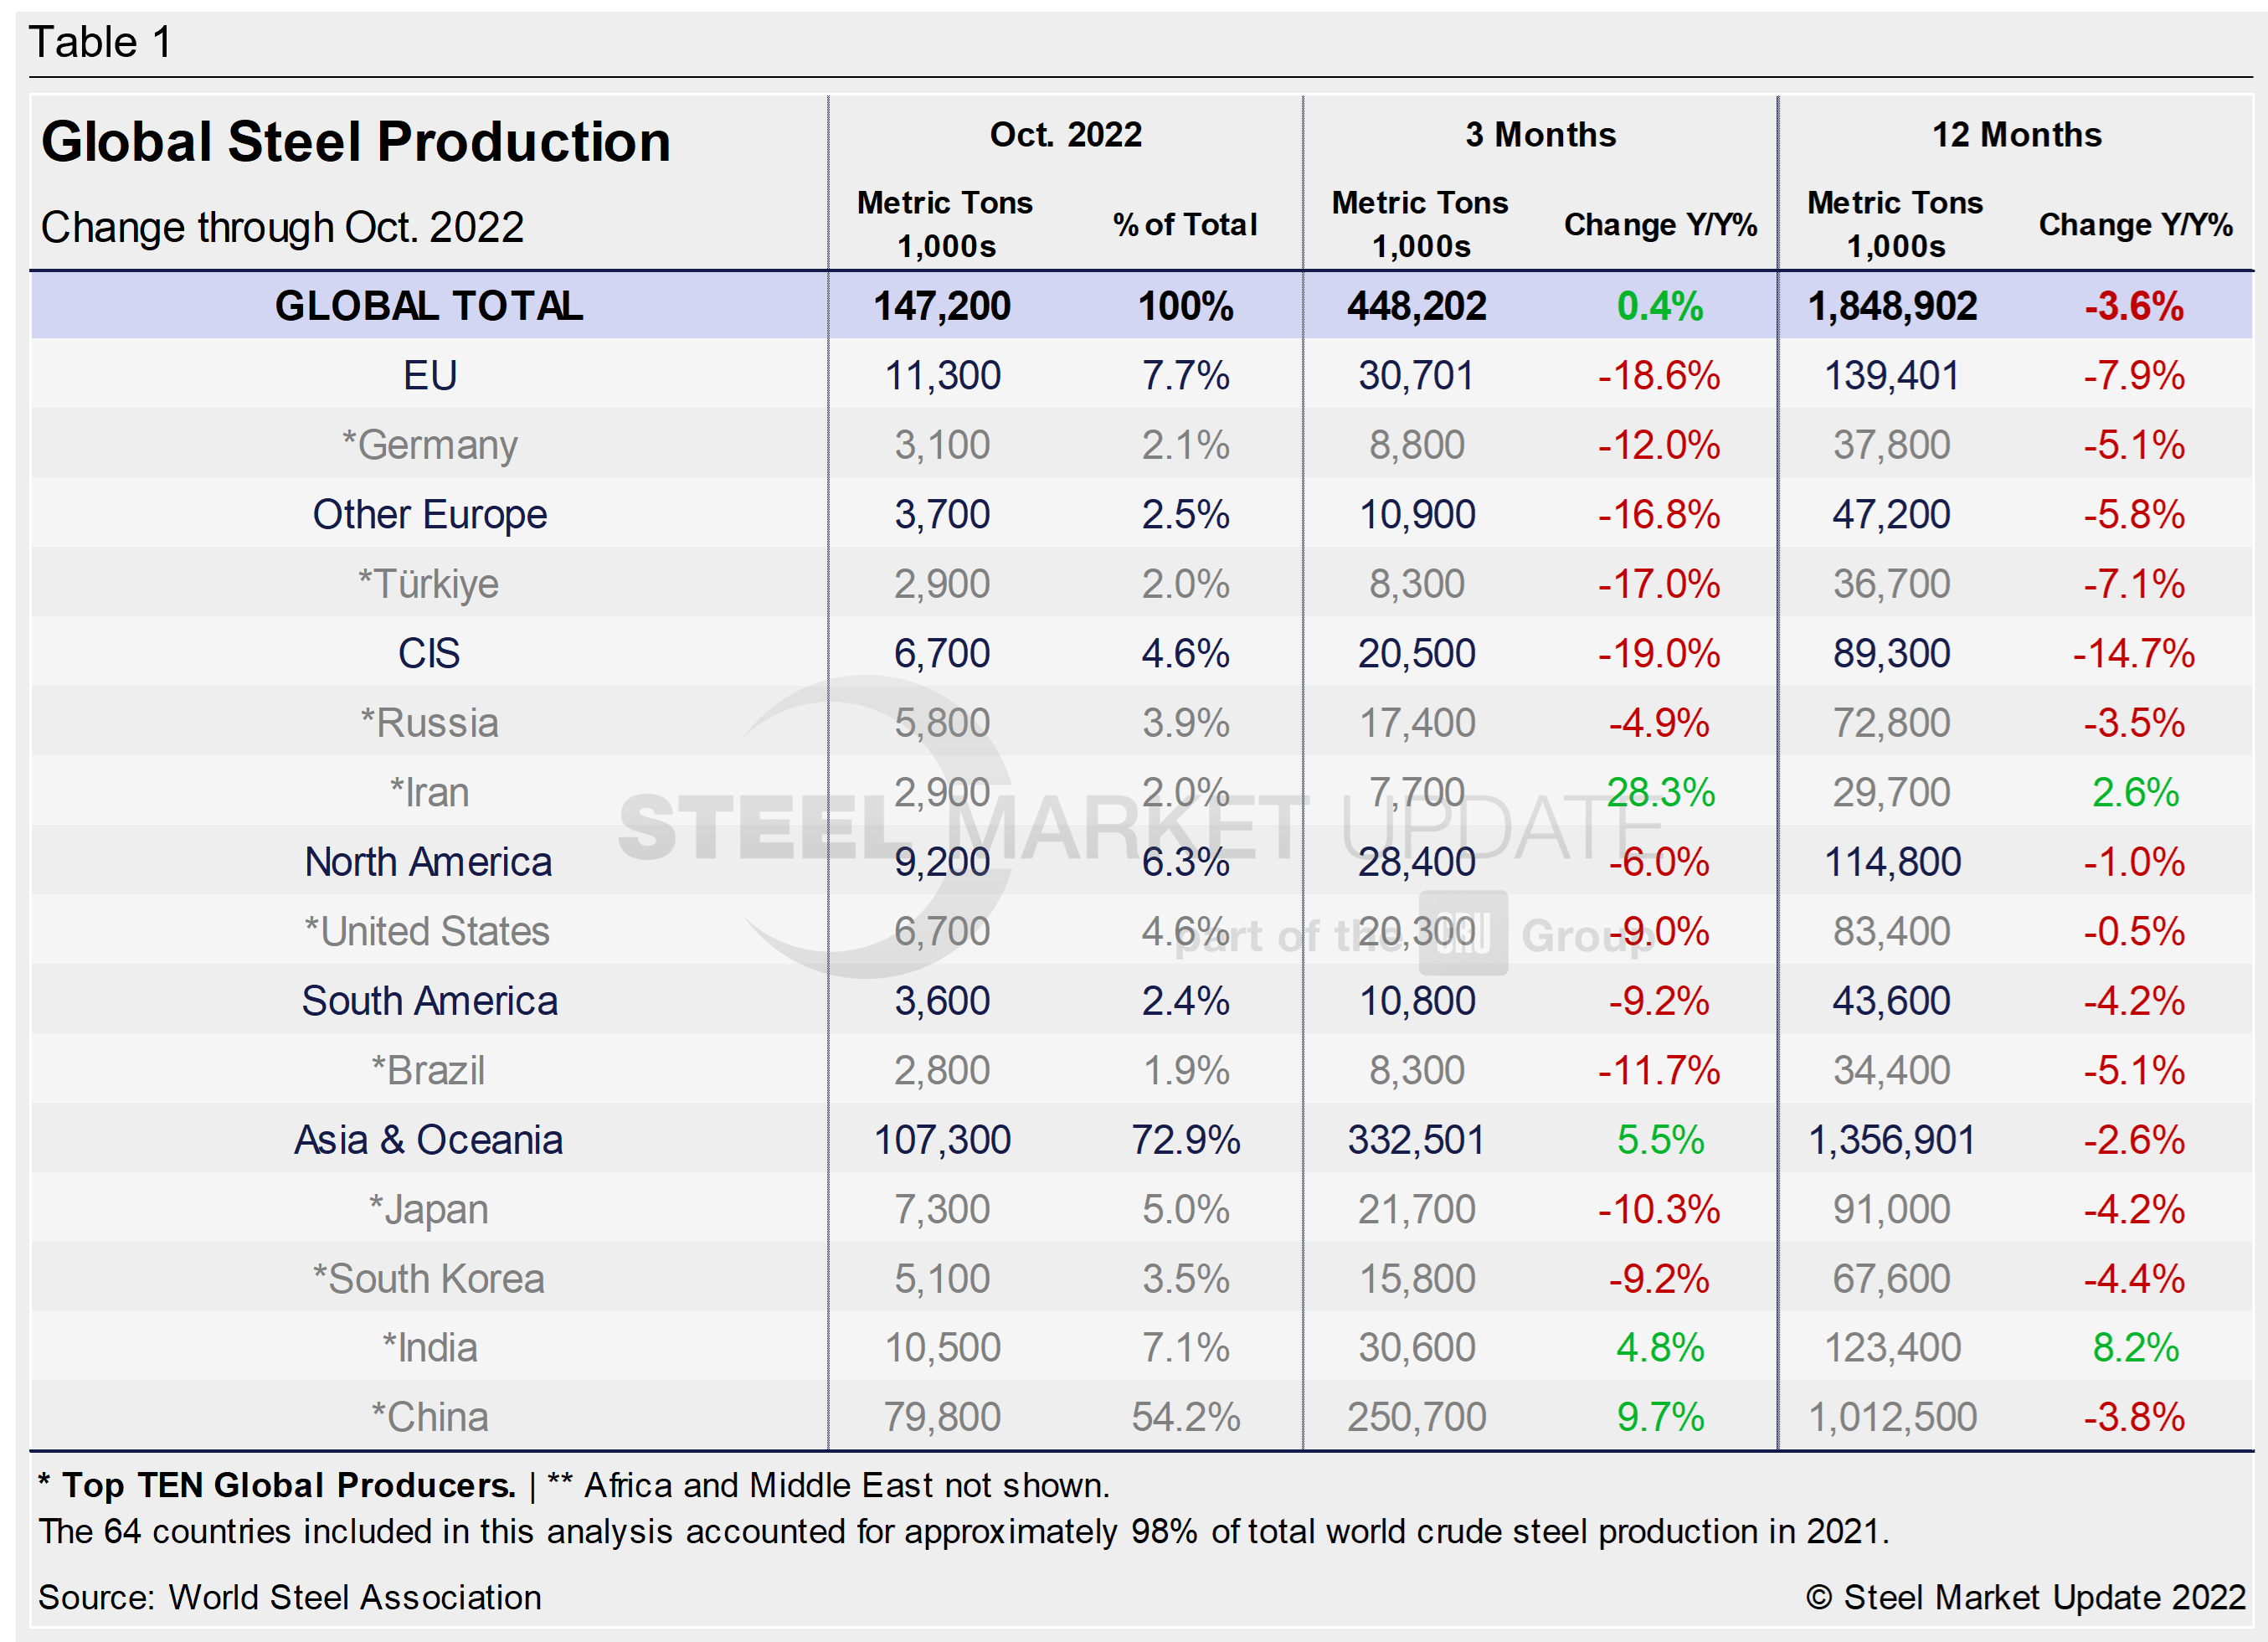
The table shows that North American production is down on a YoY basis but even more so on the three months through October. The trend shows North American output is on a declining trend. With the positive momentum in the North American market over the past 12 months giving way, it indicates that the economy has begun to struggle as inflation and concerns of a down market hang around. When compared to the same pre-pandemic period in 2019, present output is down 3.7%.
China’s Crude Steel Production
China’s monthly steel production was estimated at 79.8 million metric tons in October, down from 87 million metric tons the month prior. The 7.2-million-ton MoM decline came after repeated gains in August and September. Last month’s total is about 19.7 million metric tons below China’s all-time high crude steel output of 99.5 million metric tons in May 2021.
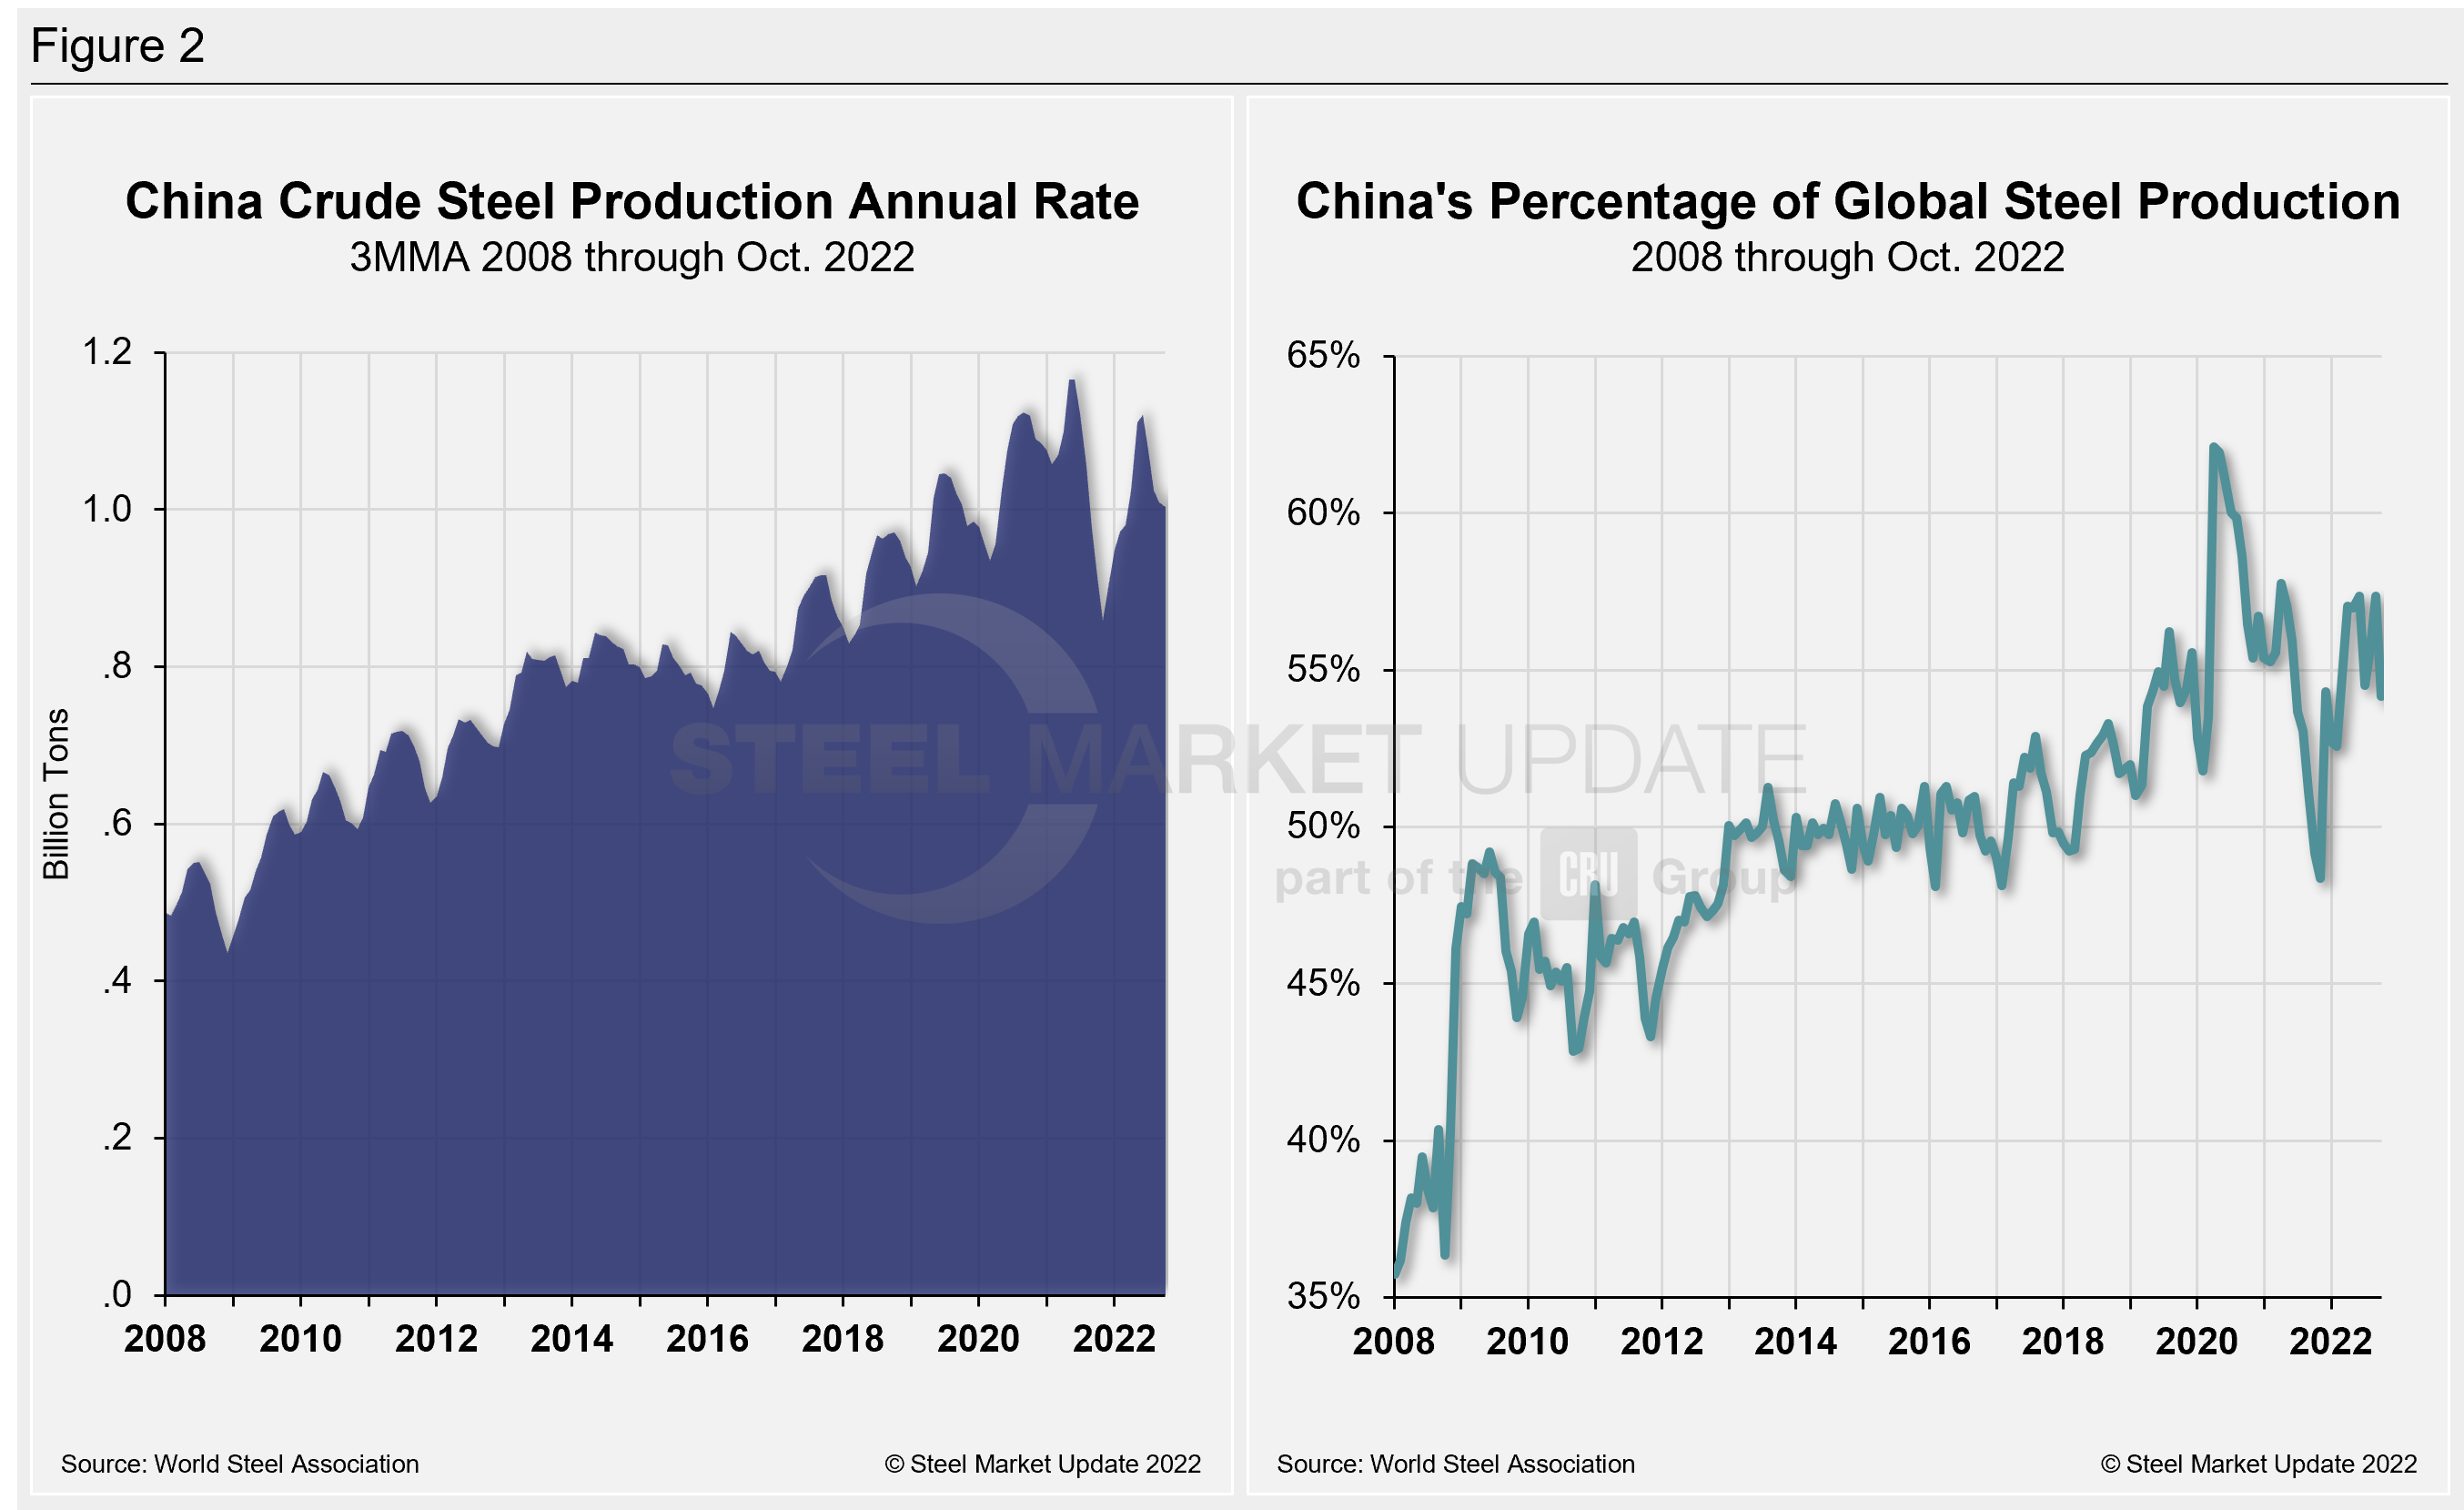
On a 3MMA basis, the annual rate of China’s crude steel production maxed out at 1.166 billion metric tons in May 2021. It has fallen repeatedly since February of last year, reaching its lowest total in November 2021. China’s annual capacity stands at 1.128 billion metric tons, while its annual production rate through October was 1.003 billion metric tons.
Despite the MoM decline, its annual capacity utilization was marginally higher at 89.8% last month, about 0.7 percentage points higher versus the month prior, but down from an all-time high of 98.4% last June.
China still produced more than half (54.2%) of the world’s steel in October. Chinese production last month was 2.1% below its pre-pandemic levels in October 2019.
China’s crude steel production rate and its percentage of global output are displayed side-by-side in Figure 2.
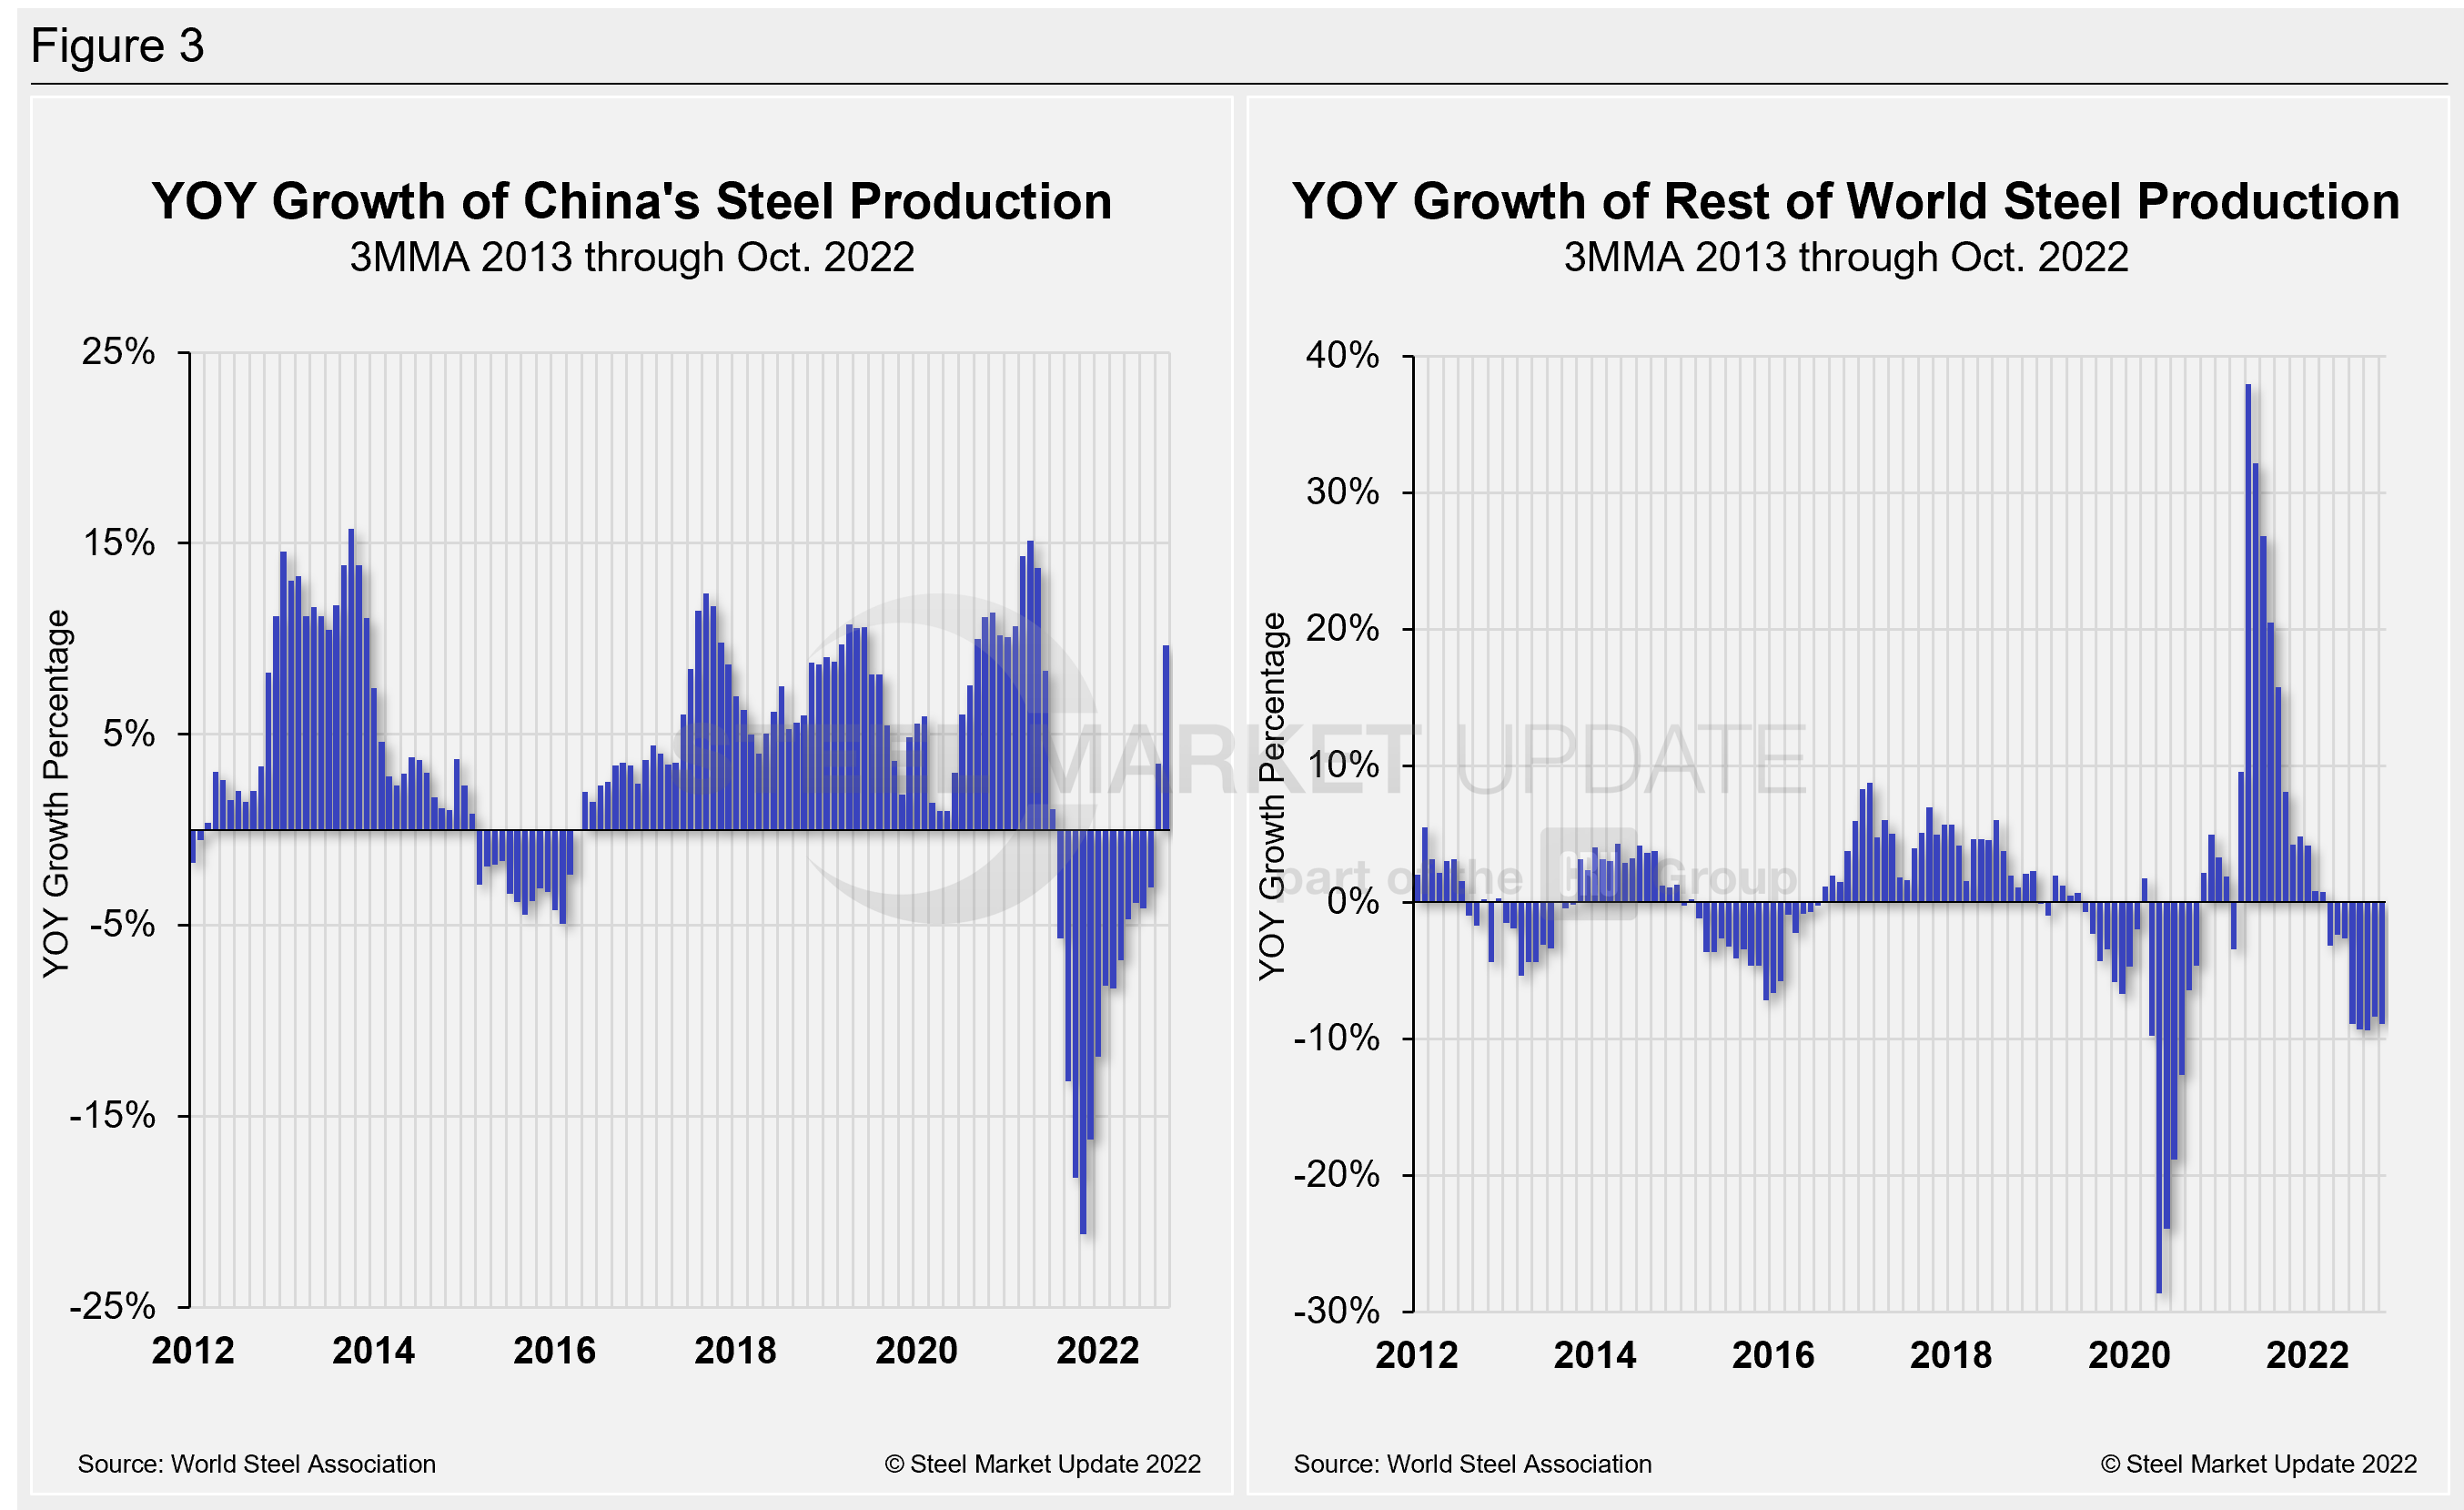
The fluctuations in China’s steel production since January 2013 versus the growth of global steel excluding China, both on a 3MMA basis, are shown side-by-side in Figure 3. From October 2020 through December 2021, the rest of the world’s production rose sharply, reaching a peak of 38.0% in April. Since then, the rate for the rest of the world’s annual production has decreased sequentially to -3.2% in March. In April and May, the percentage improved slightly but shrank back to -8.9% last month. China’s annual growth rate was -3.8% in October, a 2.6 percentage point improvement MoM. Annual growth is nowhere near the +15.1% seen last April.
By David Schollaert, David@SteelMarketUpdate.com


