

Market Segment
December 1, 2022
US Economic Growth Revised Up in Q3’s Second Look
Written by David Schollaert
The US economy’s growth was stronger than expected in the third quarter, the US Commerce Department’s Bureau of Economic Analysis (BEA) said in its latest report.
Gross Domestic Production (GDP) accelerated to a 2.9% annualized pace in Q3. That’s an improvement from the initial government reading in October which showed 2.6% growth in economic activity. The result is a marked turnaround from economic contractions of 1.6% in the first quarter of the year and 0.6% in the second.
The better-than-expected growth in the latest GDP reading reflected upward revisions to consumer and business spending, while the value of imports was revised down, further narrowing the trade deficit, the report said.
Personal consumption – the biggest part of the economy – climbed at a 1.7% pace, a slowdown from the prior quarter but up from the previously reported 1.4% increase, the GDP data showed. Services spending increased, while outlays on goods fell for a third consecutive quarter.
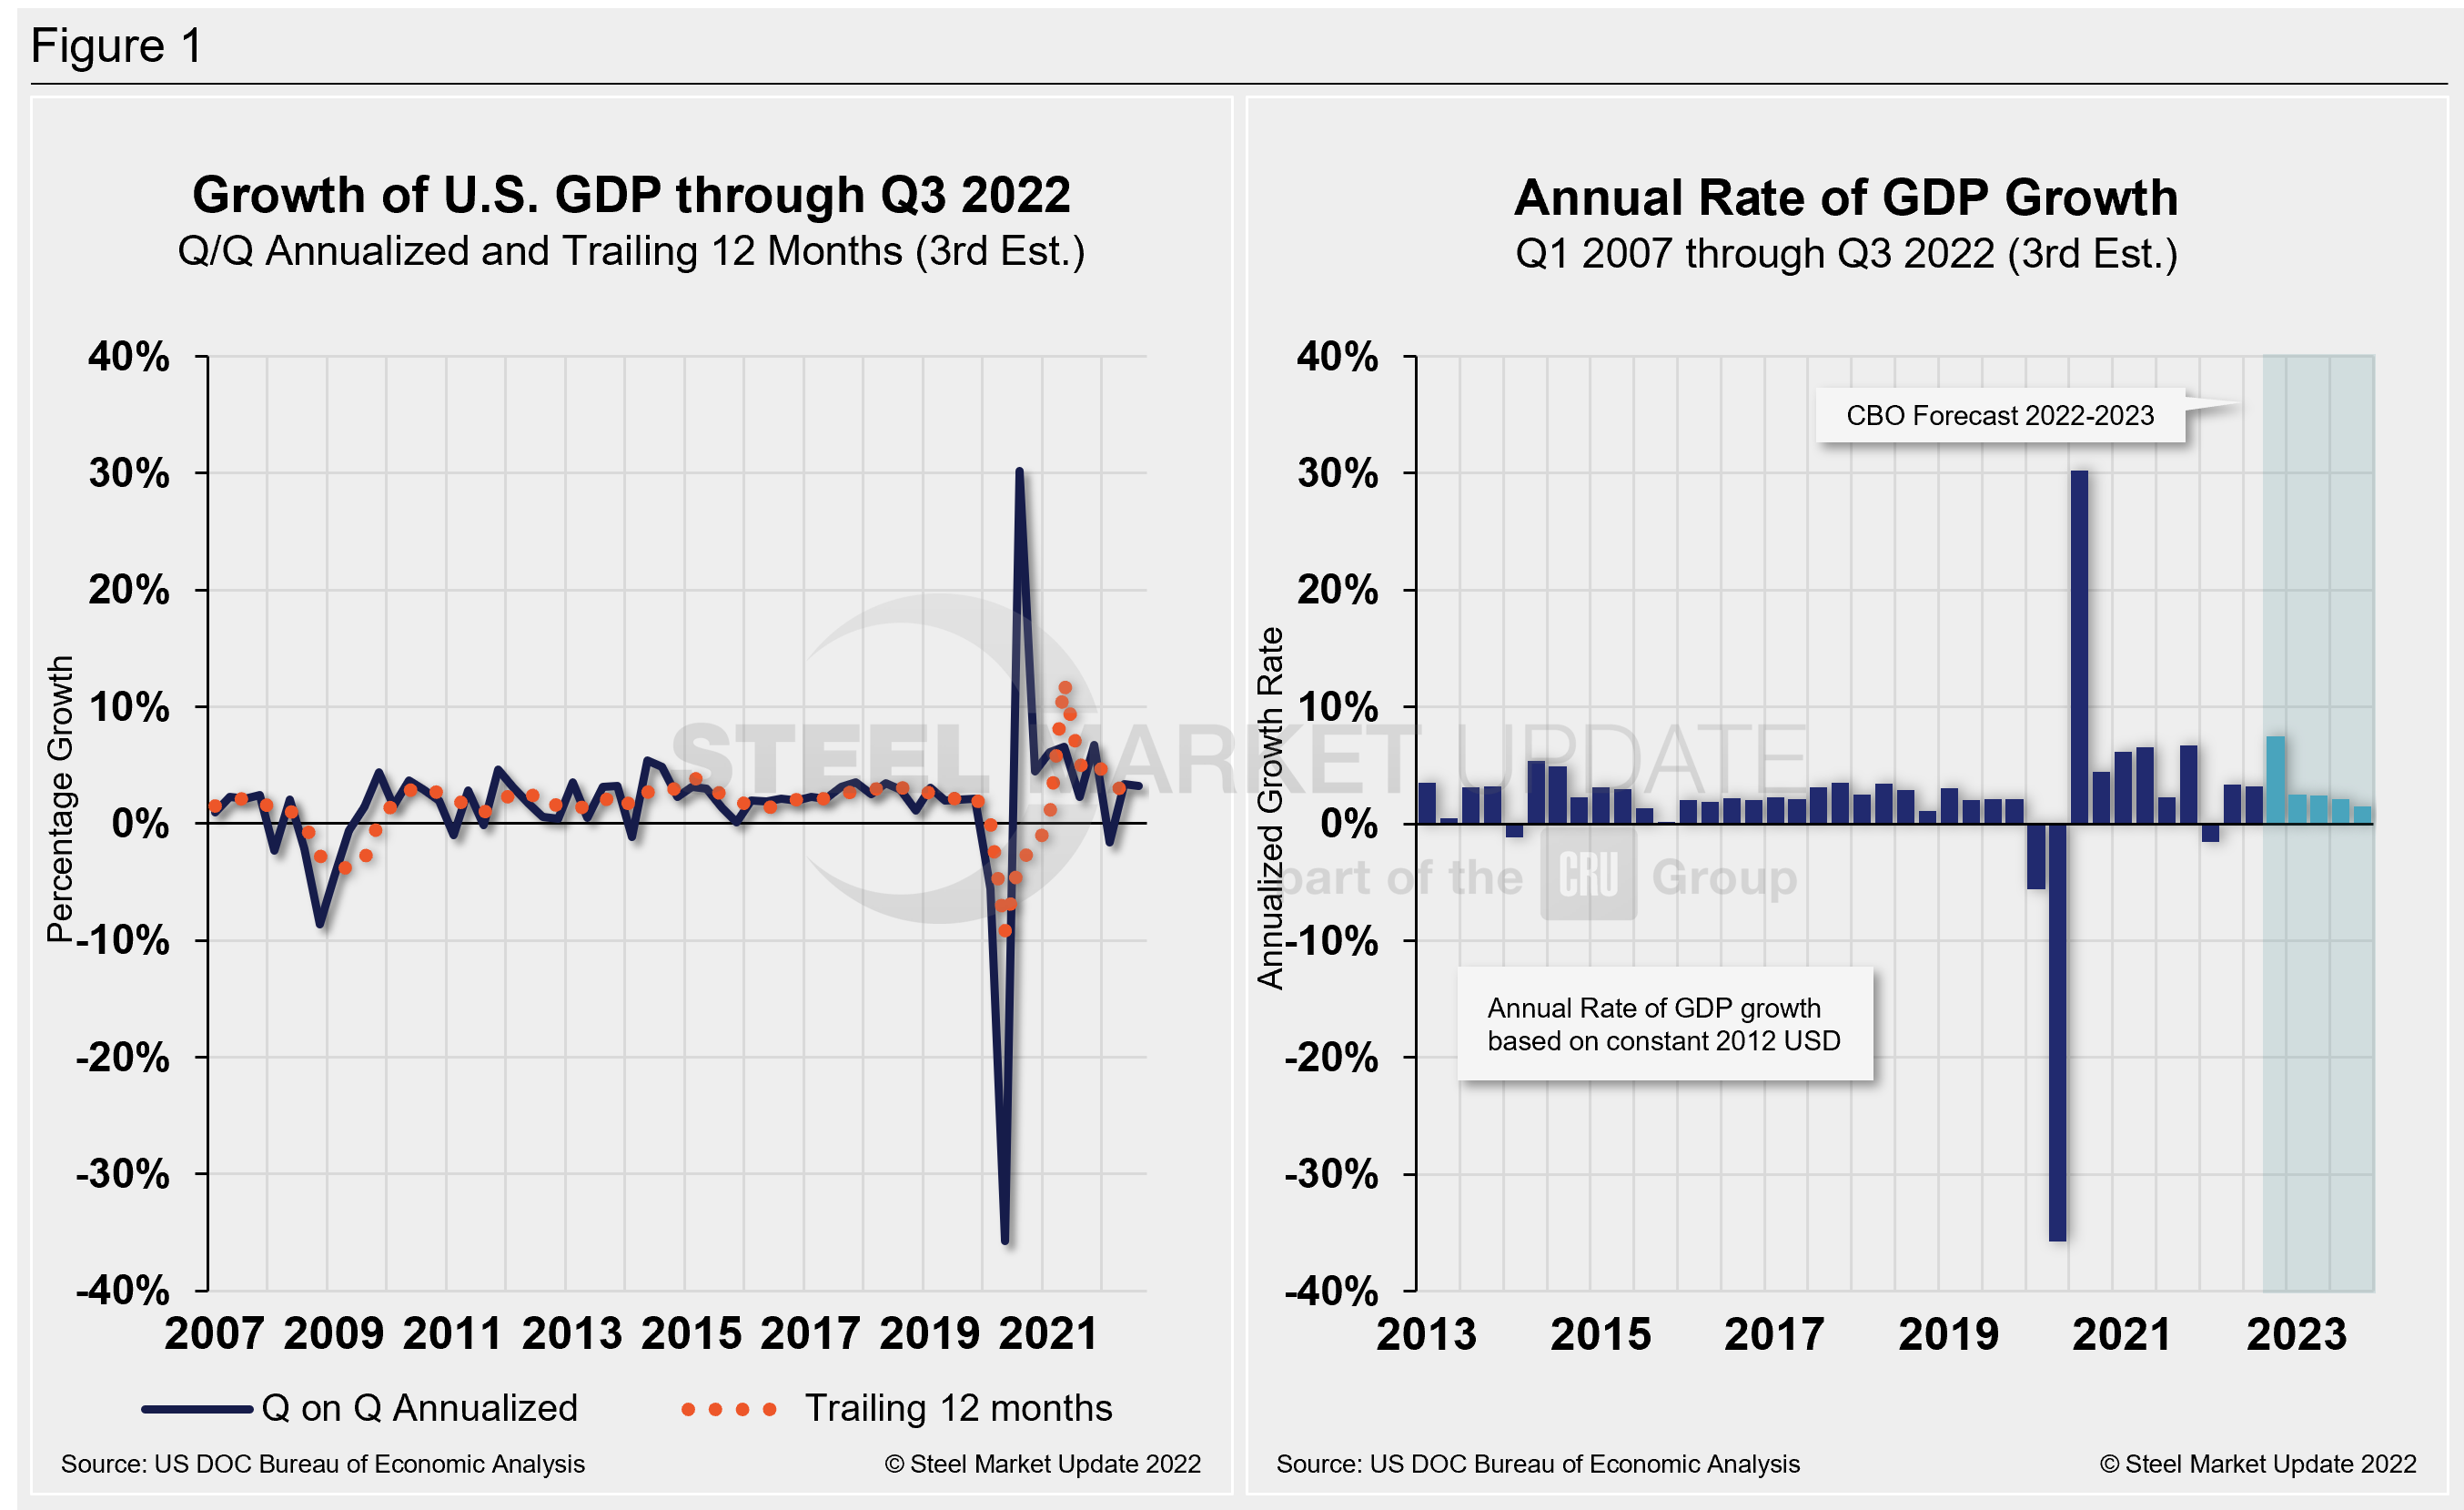
Commerce’s second look put the total US GDP in Q3 at $25.7 trillion, a 7.3% annual rate increase, or $450.5 billion, over the previous quarter. Below in Figure 1 is a side-by-side comparison of US GDP growth and the annual rate of GDP, both through Q3 2022. In the first chart, you’ll see the contrast between the trailing 12-month growth and the headline quarterly result. The chart on the right details the headline quarterly results since Q1 2007, including the Congressional Budget Office’s GDP projection through 2023.
On a trailing 12-month basis, GDP accelerated by just 2.88% in Q3, up from 2.72% in the prior quarter but still well behind 12.23% growth in Q2 of 2021. It’s a vast improvement from -9.27% in Q2 2020 at the height of the pandemic. For comparison, the average in 51 quarters since Q1 2010 has been a growth rate of 2.15%.
The latest GDP figures show the resilience of the economy as it deals with the headwinds caused by the Fed’s aggressive fight to tame decades-high inflation with large interest rate hikes. Its attempt to slow the economy has been difficult.
The US labor market’s November jobs report, set to be released this Friday, is expected to remain strong, with employers still hiring and unemployment near a half-century low. And while consumers are struggling with higher prices, spending hasn’t really slowed. More than two-thirds of US economic activity is driven by consumer spending.
One of the biggest drags on economic growth is the pullback in spending on home building amid higher interest rates. Investment in housing construction shaved 1.4 percentage points off overall growth, the report showed.
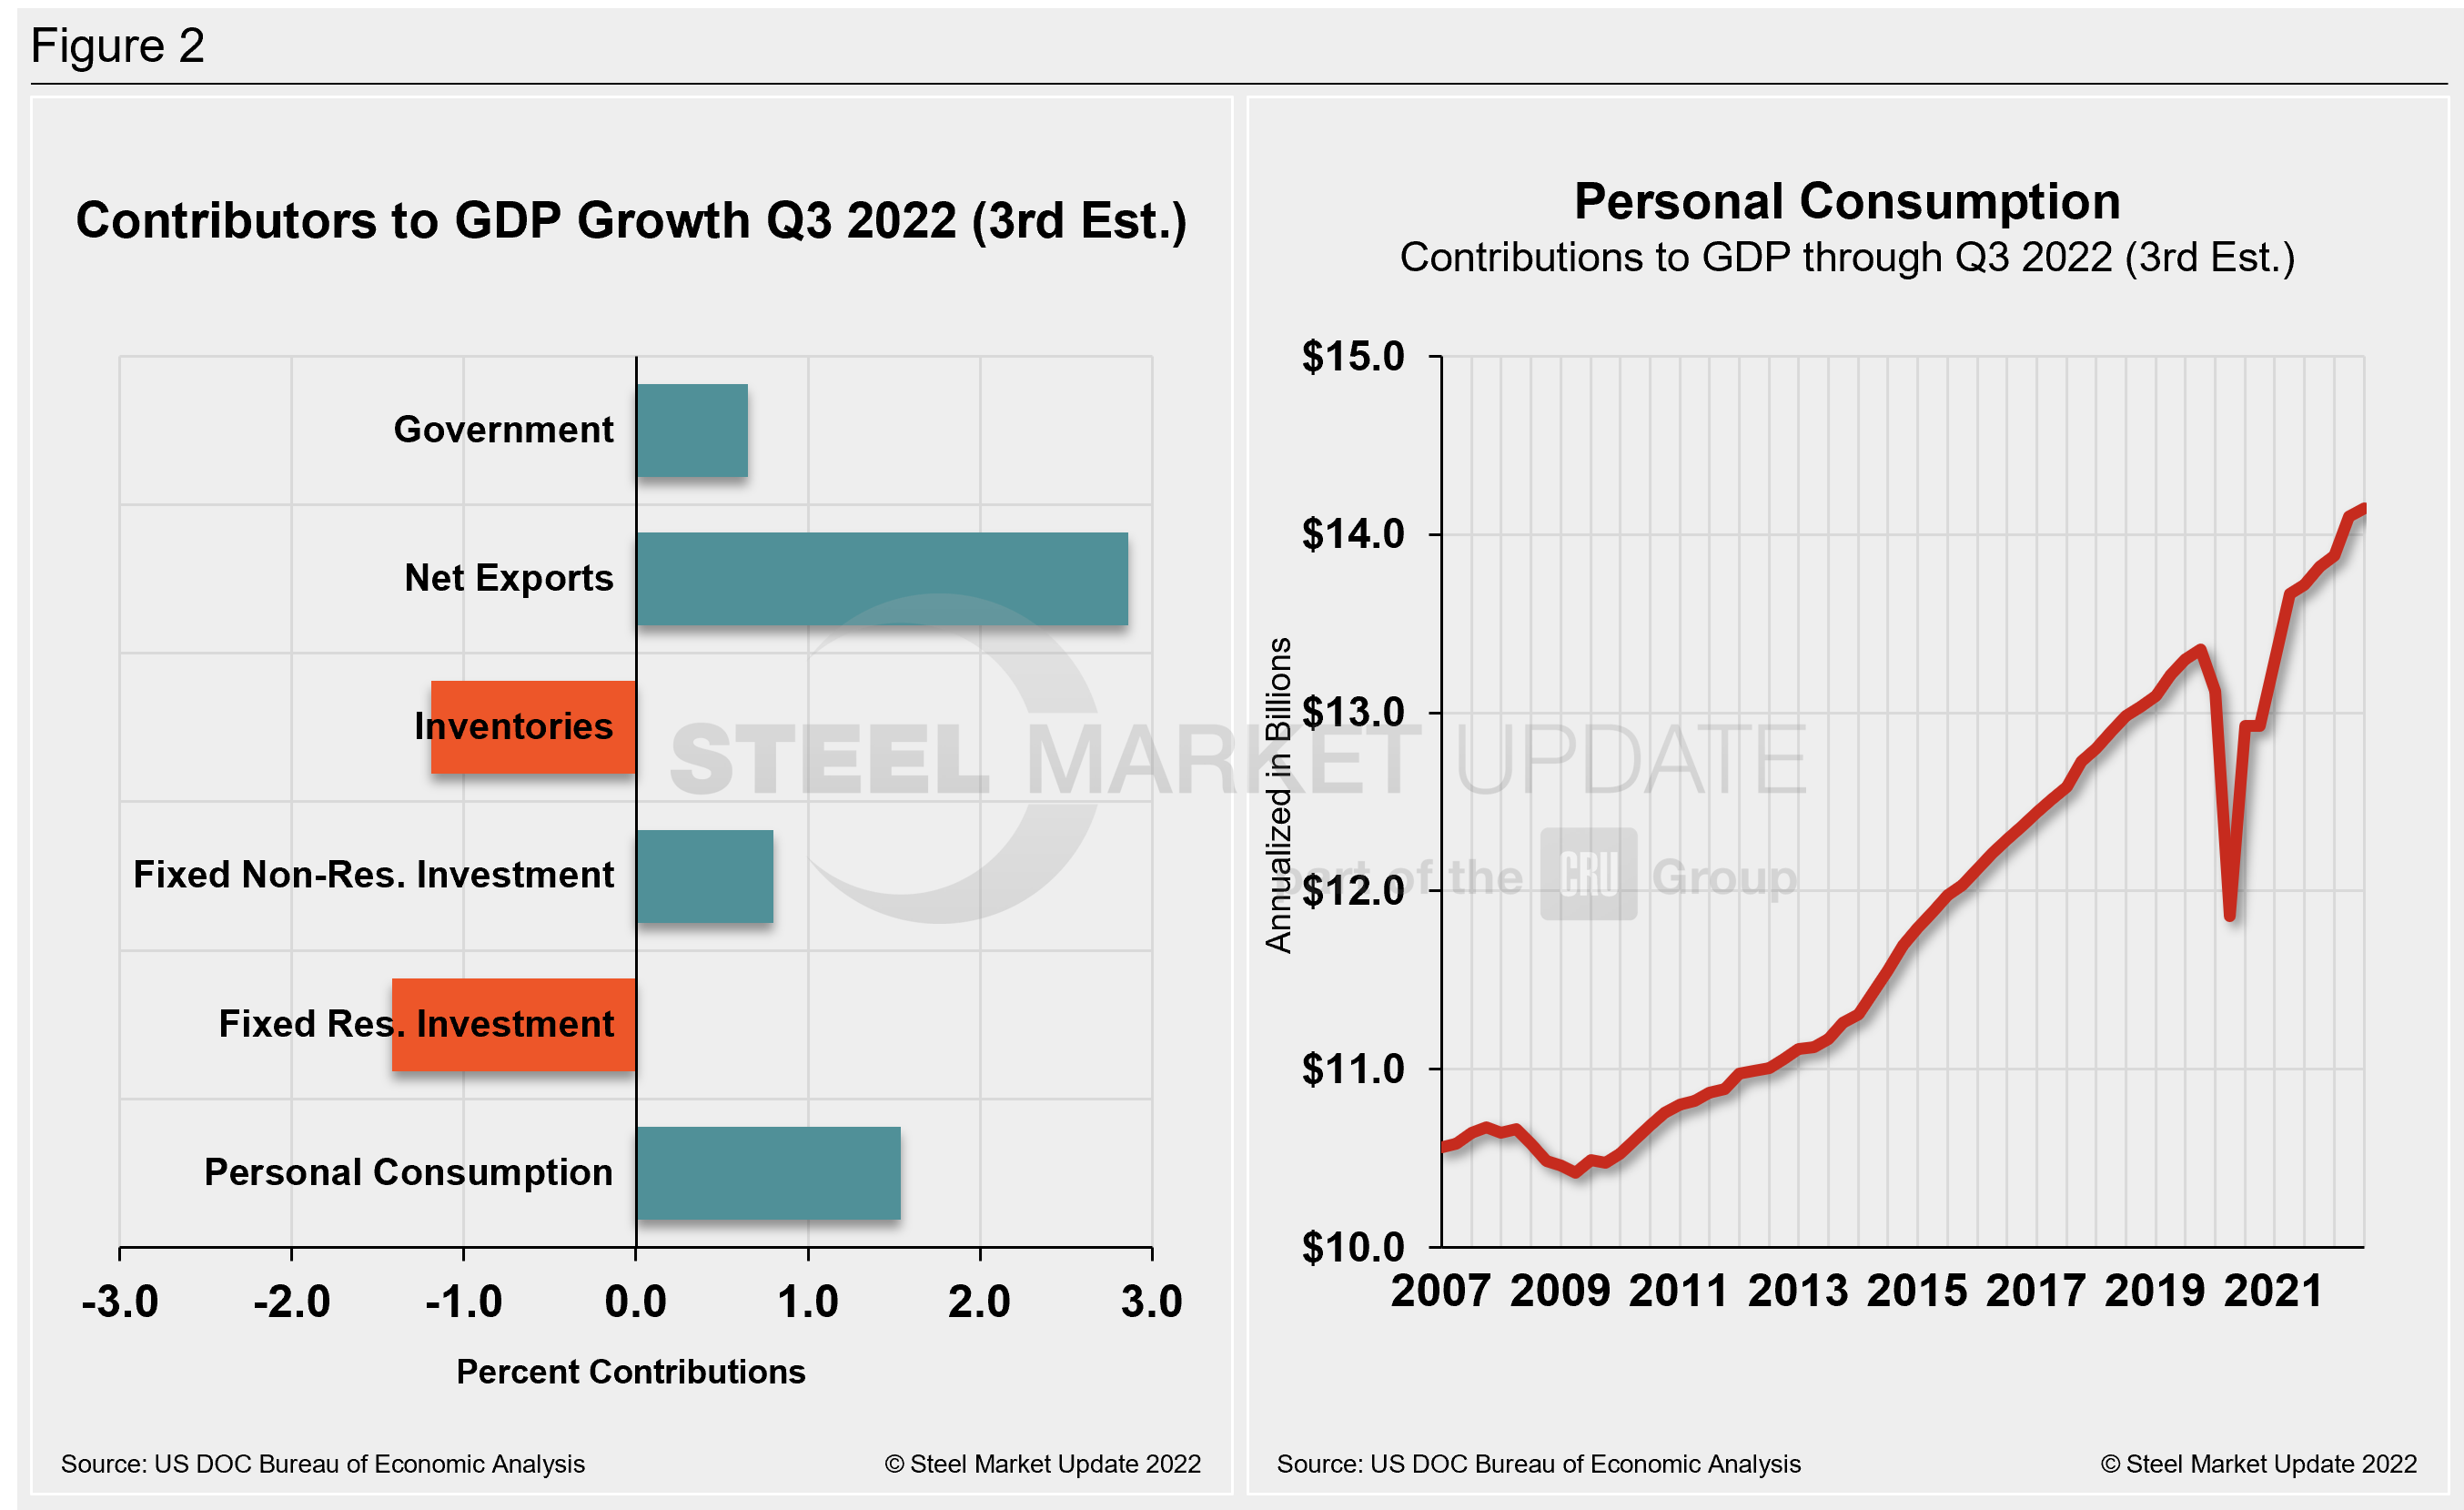
Shown below in Figure 2 is a side-by-side comparison of two charts. The mix of the six major components in the GDP growth calculation is on the left. The chart on the right puts a spotlight on personal consumption, a measure of consumer confidence and spending engagement.
The most notable change and a major source of GDP fluctuation is personal consumption, which has seen extreme swings since the onset of Covid. It has been resilient more recently but is no longer the bright spot, and is at its lowest mark in two years.
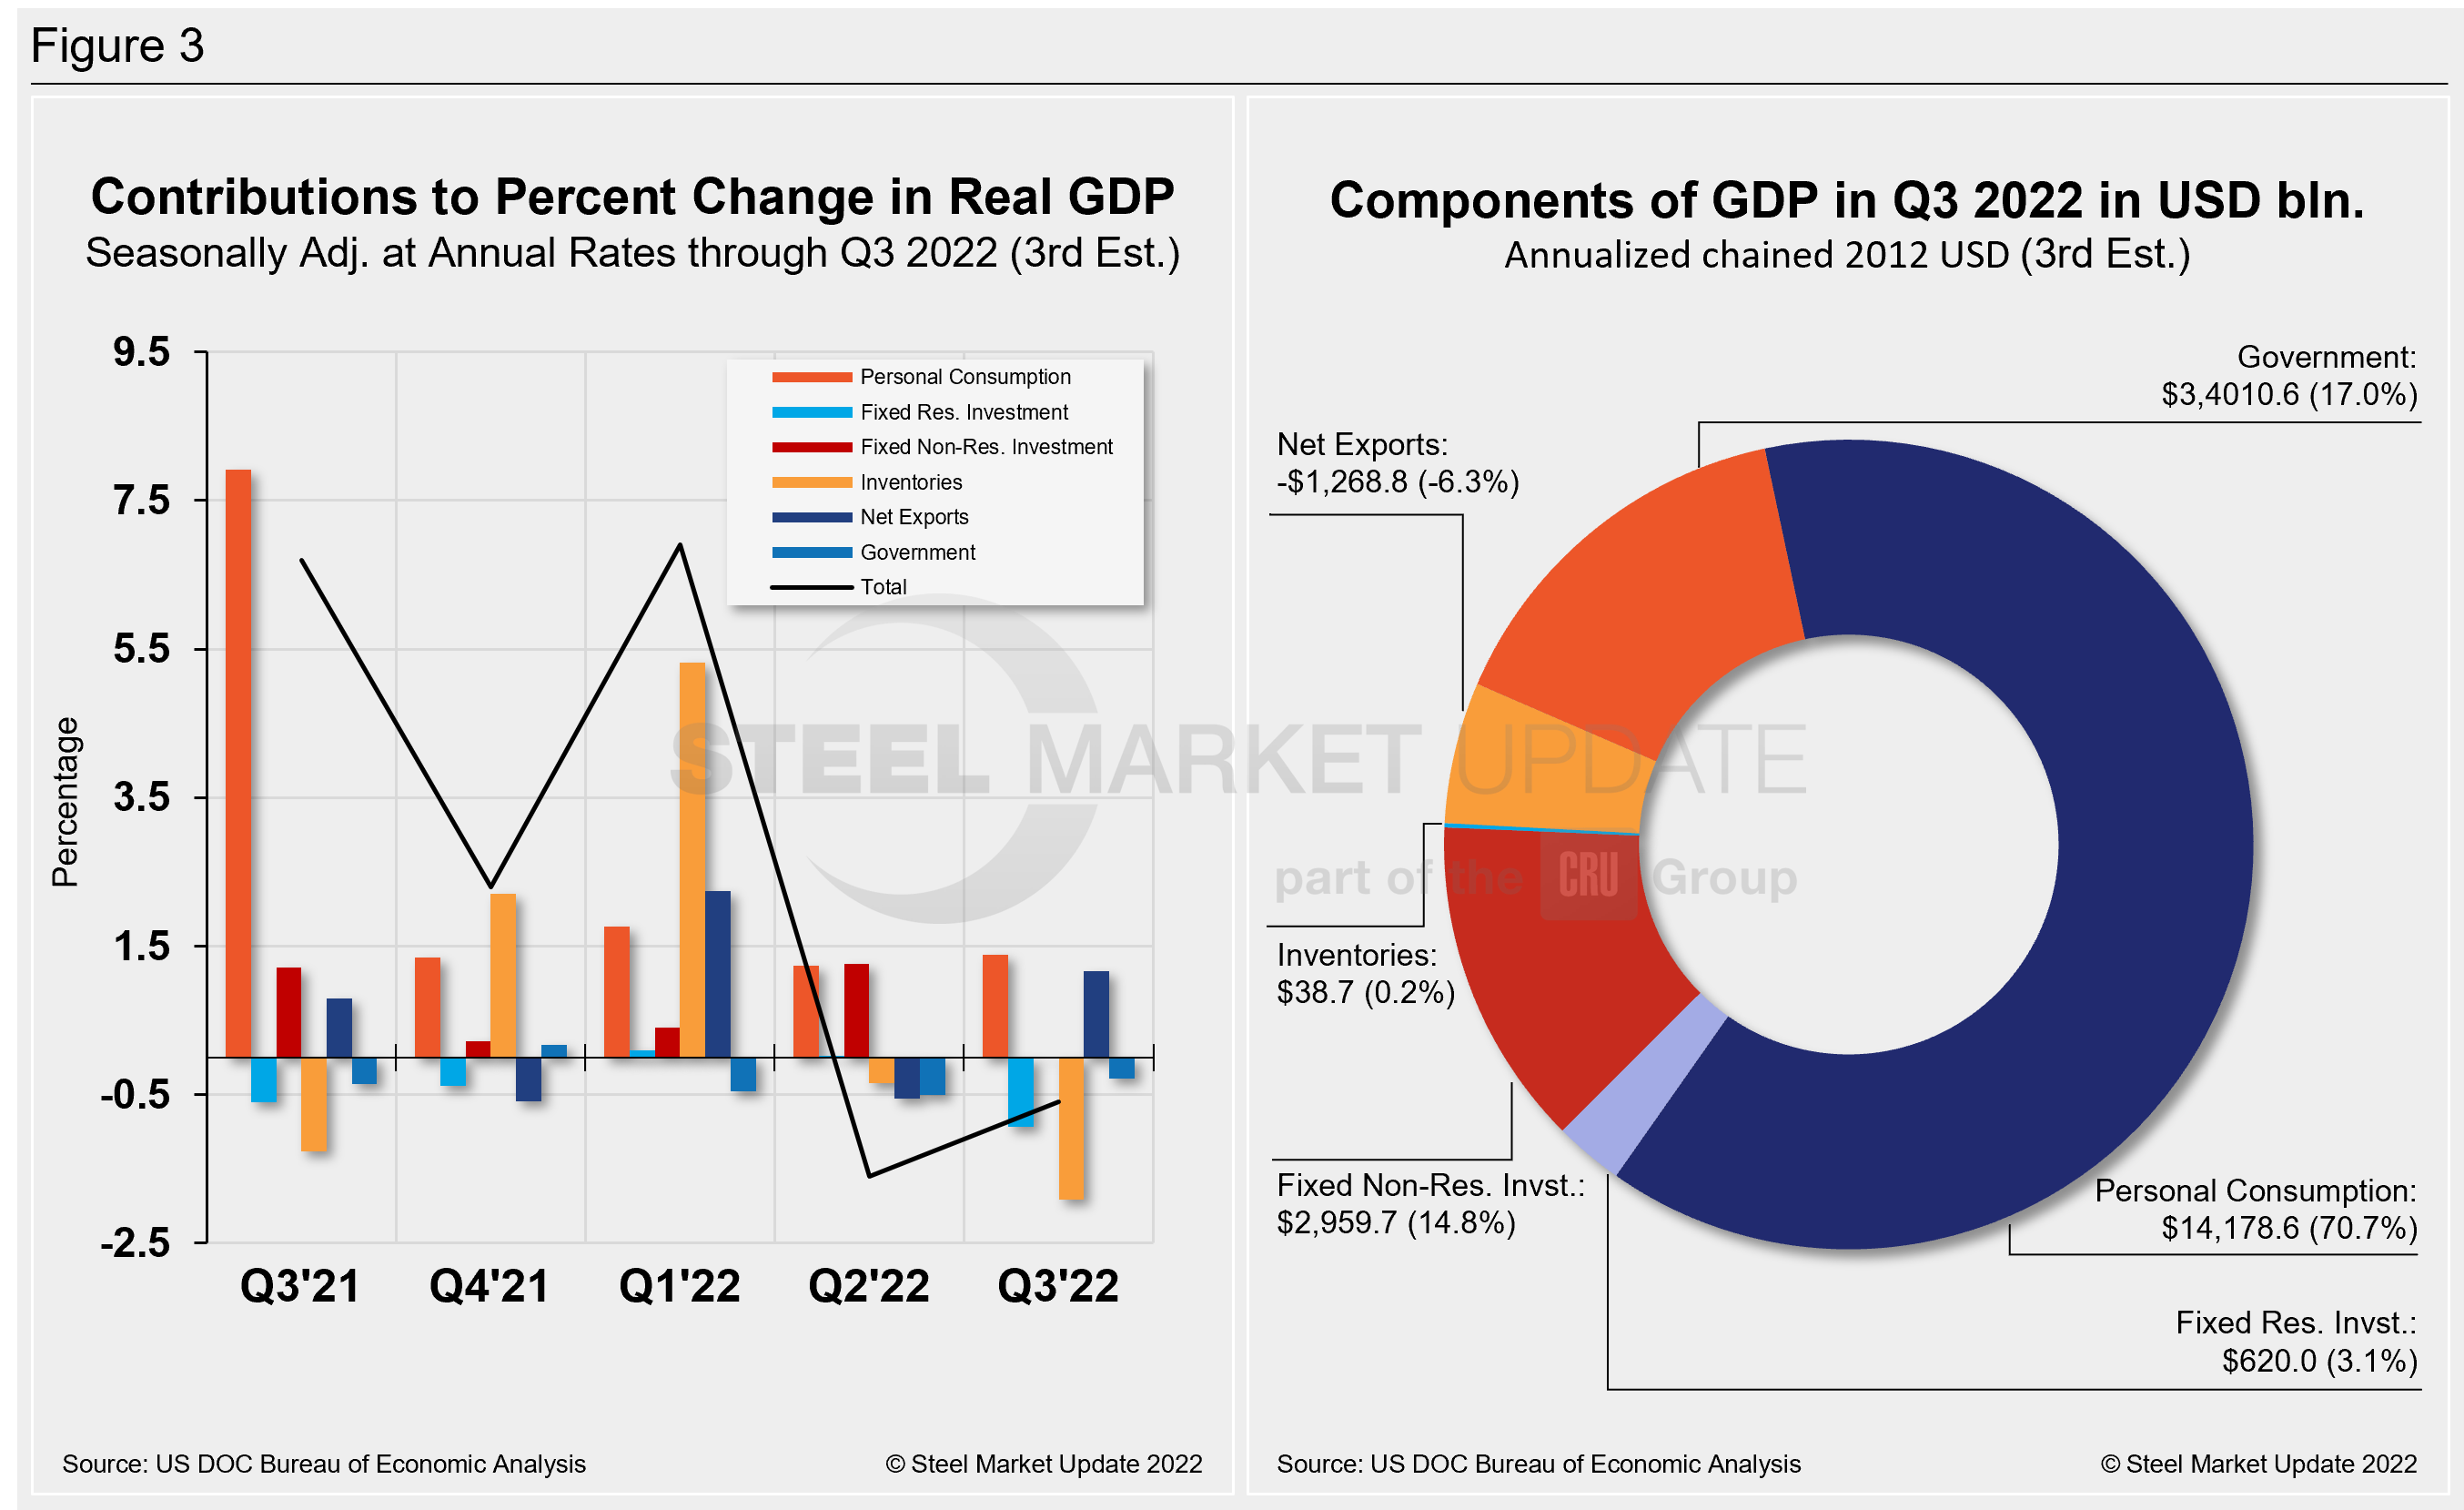
The quarterly contributions of the six major subcomponents of GDP since Q2 2021 and the breakdown of the $25.7 trillion economy in BEA’s second review of Q3 GDP are both shown in Figure 3. The chart on the left is for cross-comparison with Figure 1 above. The right chart shows the other components’ size relative to personal consumption.
By David Schollaert, David@SteelMarketUpdate.com


