Mexico
January 30, 2023
January Energy Market Update
Written by Becca Moczygemba
Editor’s note: Steel Market Update is pleased to share this Premium content with Executive members. For information on how to upgrade to a Premium-level subscription, email info@steelmarketupdate.com.
The Energy Information Administration’s (EIA) January Short-Term Energy Outlook (STEO) was released earlier this month, forecasting spot prices, production, and inventories for crude oil and natural gas. It is the first to include forecasts for 2024.
Crude oil prices are forecast to average $83 per barrel in 2023, and are forecast to fall into 2024, while natural gas prices are expected to remain 25% below levels in 2022.
In this Premium analysis we cover oil and natural gas prices, North American drilling rig activity, active drill rigs by state, and US crude oil stock levels.
You can view the latest EIA Short-Term Energy Outlook here.
Oil and Gas Spot Prices
The weekly West Texas Intermediate oil spot market price was $80.341 per barrel as of the week ending Jan. 27 (Figure 1). Oil spot prices dropped in late November to $78.74, hit a low of $73.06 in early December, and have been volatile ever since. Previously, the lowest price was $71.18 in Dec. 2021. For comparison, the record high in the EIA’s 36-year data history occurred in July 2008 at $142.52/b. The EIA expects oil spot prices to average $83/b in 2023.
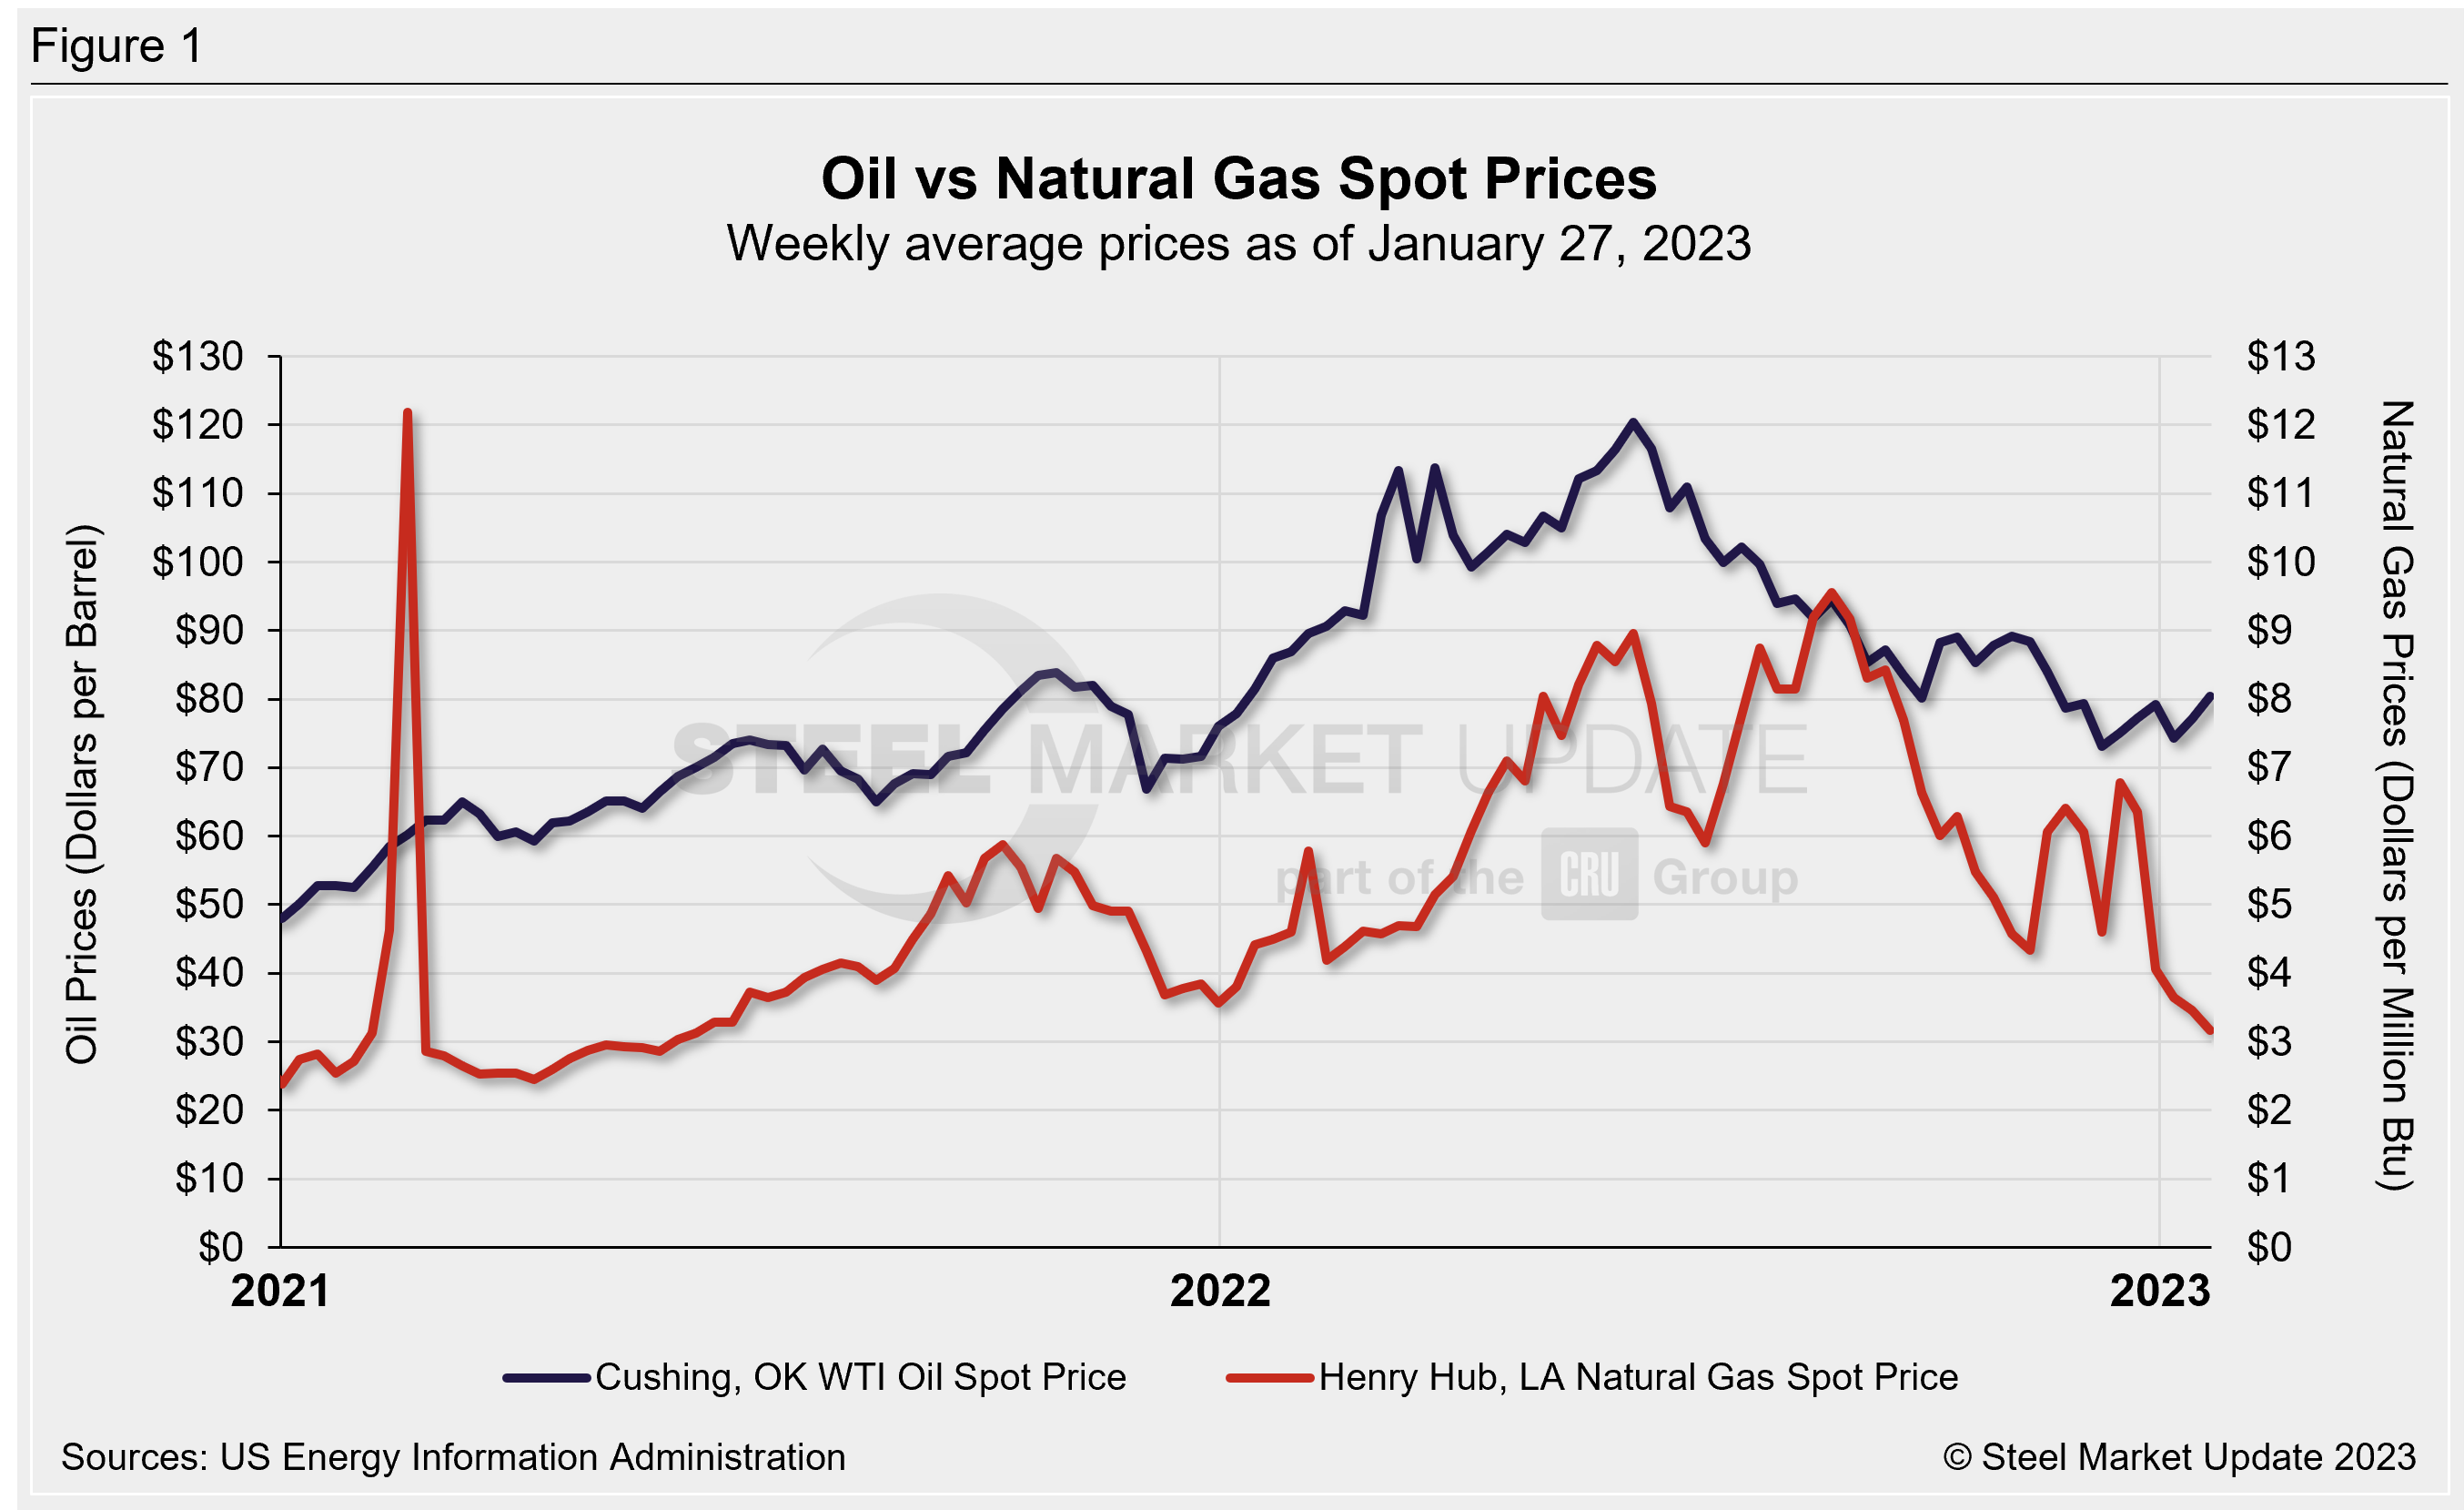
Natural gas spot prices are now lower than they’ve been since June 2021. Recall prices reached a high of $9.56/Metric Million British Thermal Units (MMBTU) in late August. The record high in the EIA’s 36-year history was $14.49/MMBTU the week of Dec. 16, 2005. The EIA expects natural gas prices to fall under $5.00/MMBTU in 2023 and continue at that rate into 2024. The November STEO explains, “We expect natural gas prices to again average slightly below $5.00/MMBtu, as dry natural gas production outpaces an increase in LNG (liquefied natural gas) exports that results from rising LNG export capacity.”
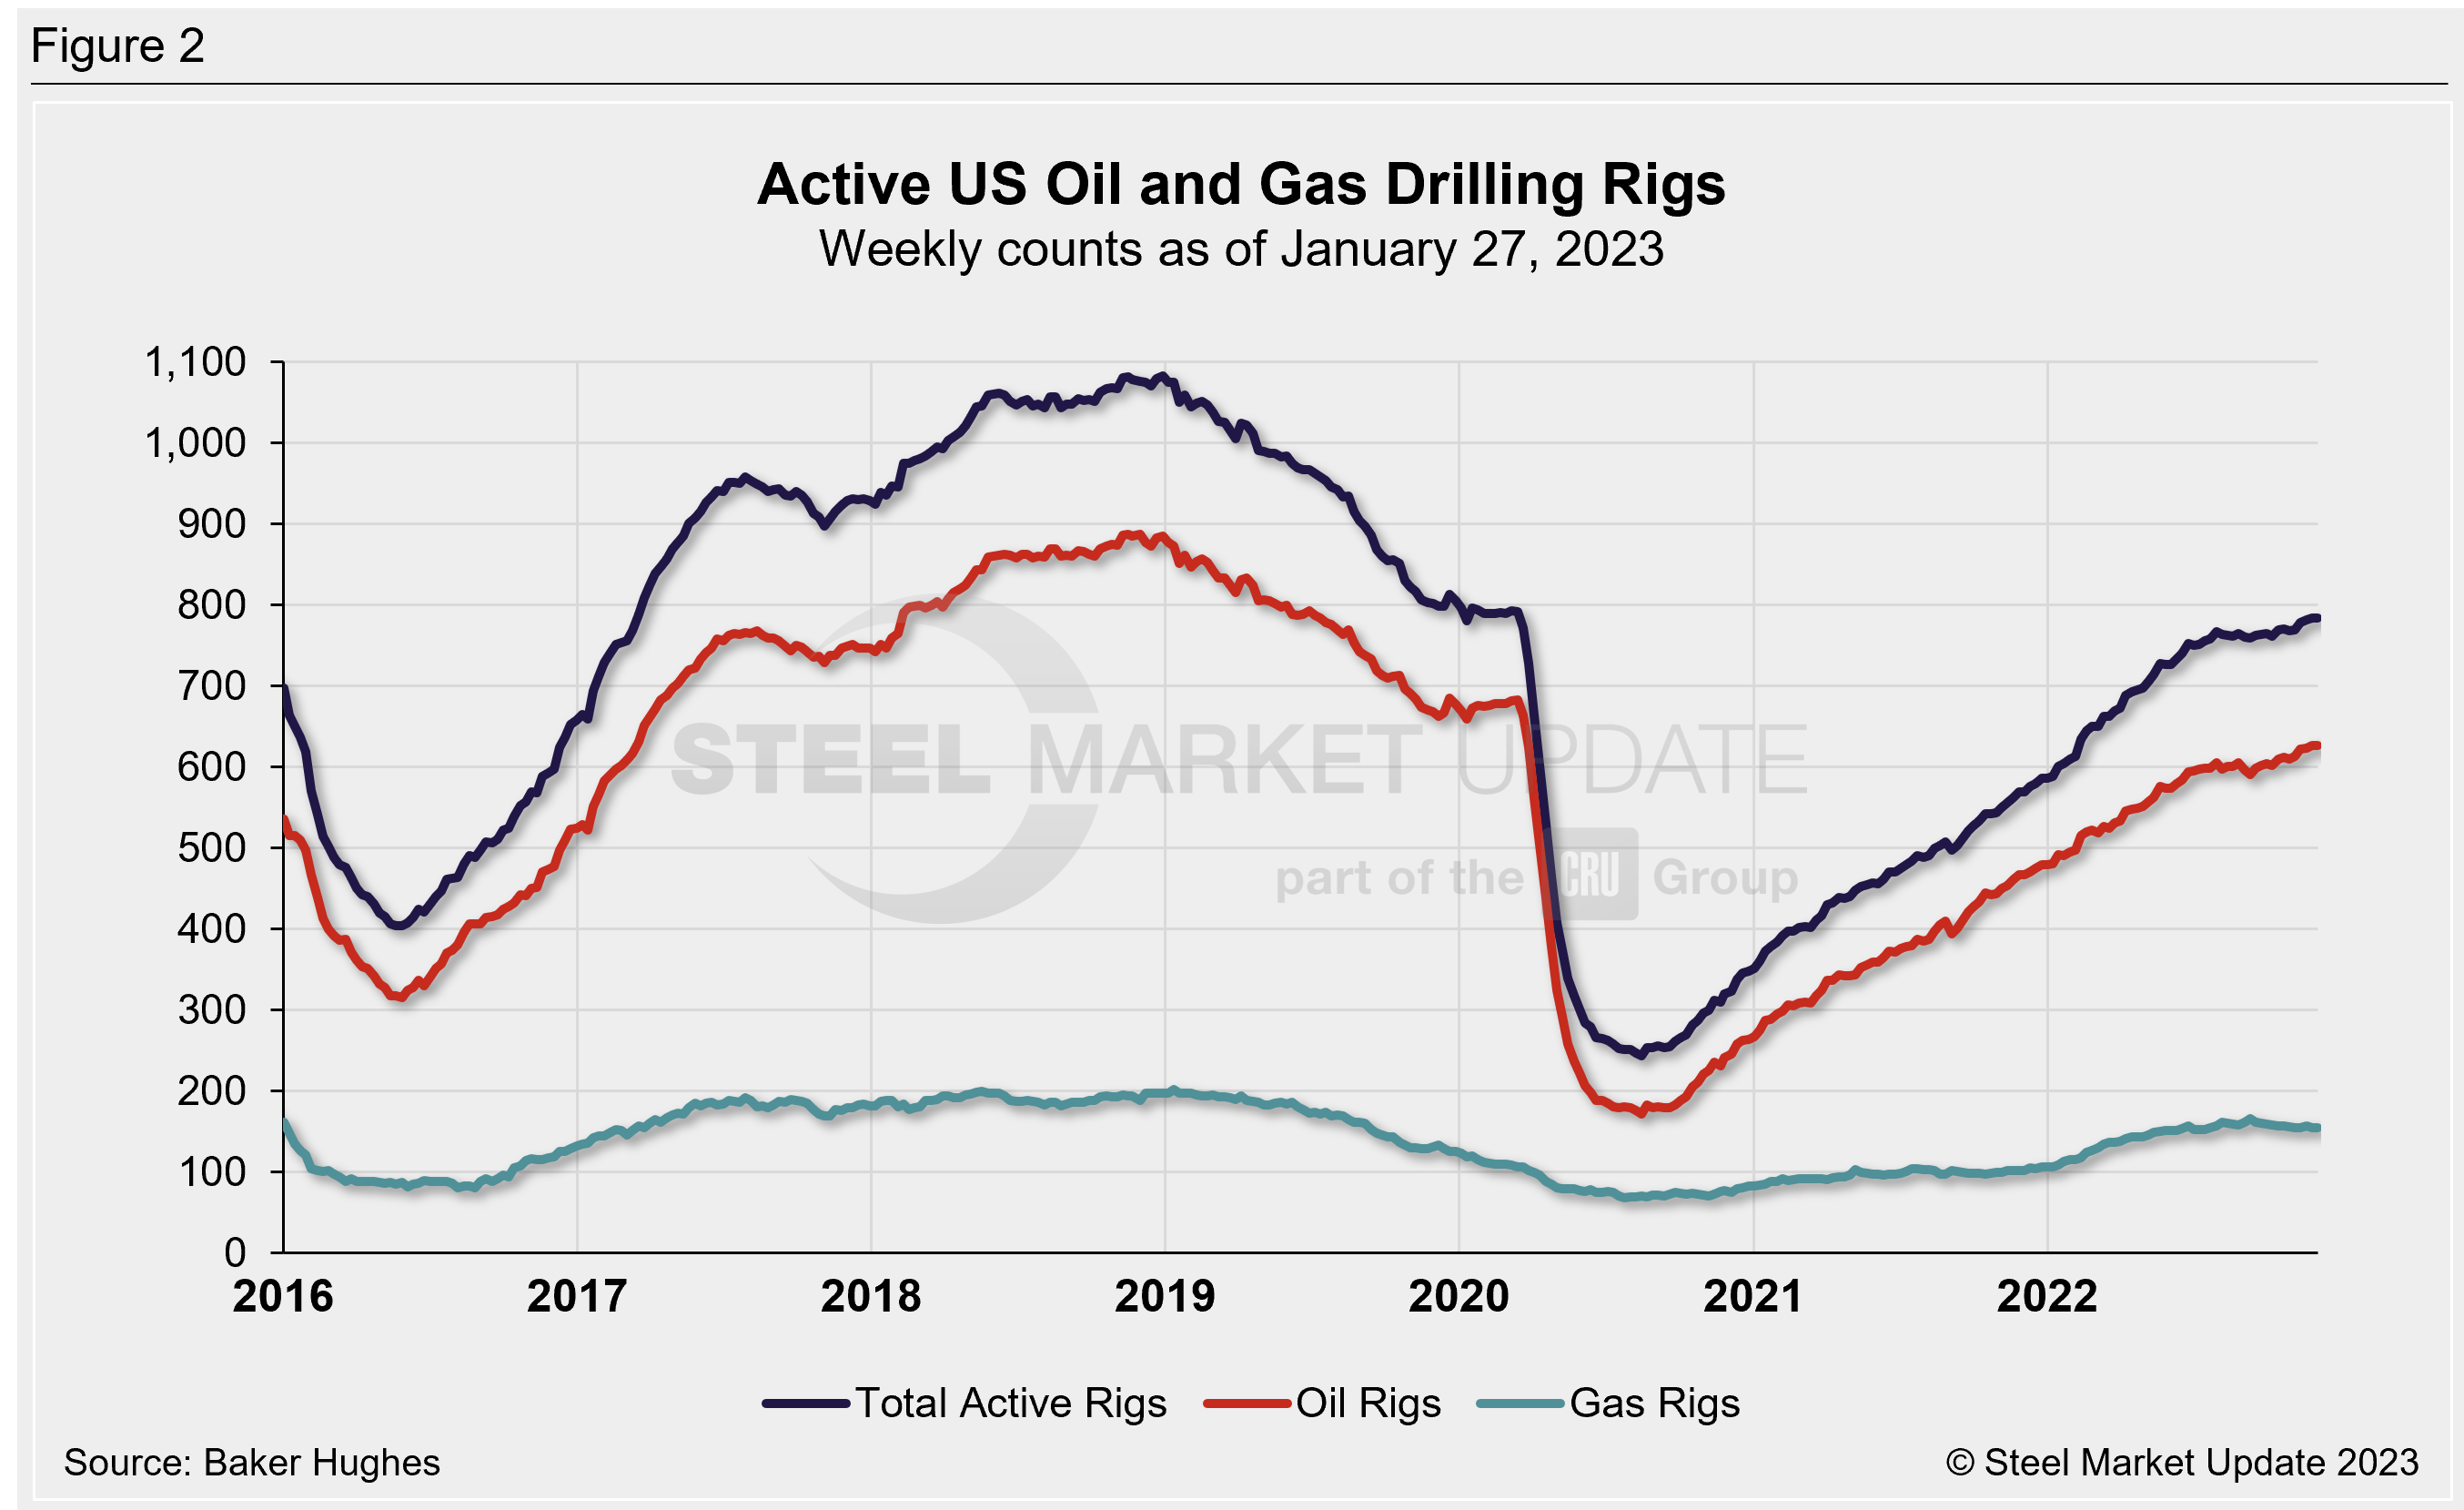
Rig Counts
The number of active US oil and gas drill rigs is up 495 from this time one year ago. The latest US count stood at 771 active drill rigs as of the end of last week, which includes 609 oil rigs, 160 gas rigs, and two miscellaneous rigs, according to Baker Hughes (Figure 2).
The latest Canadian rig count is 247 rigs, which includes 157 oil rigs and 90 gas rigs. The Canadian rig count has been increasing since the start of 2023. The Canadian rig count is up 30 from the same period one year ago. (Figure 3).
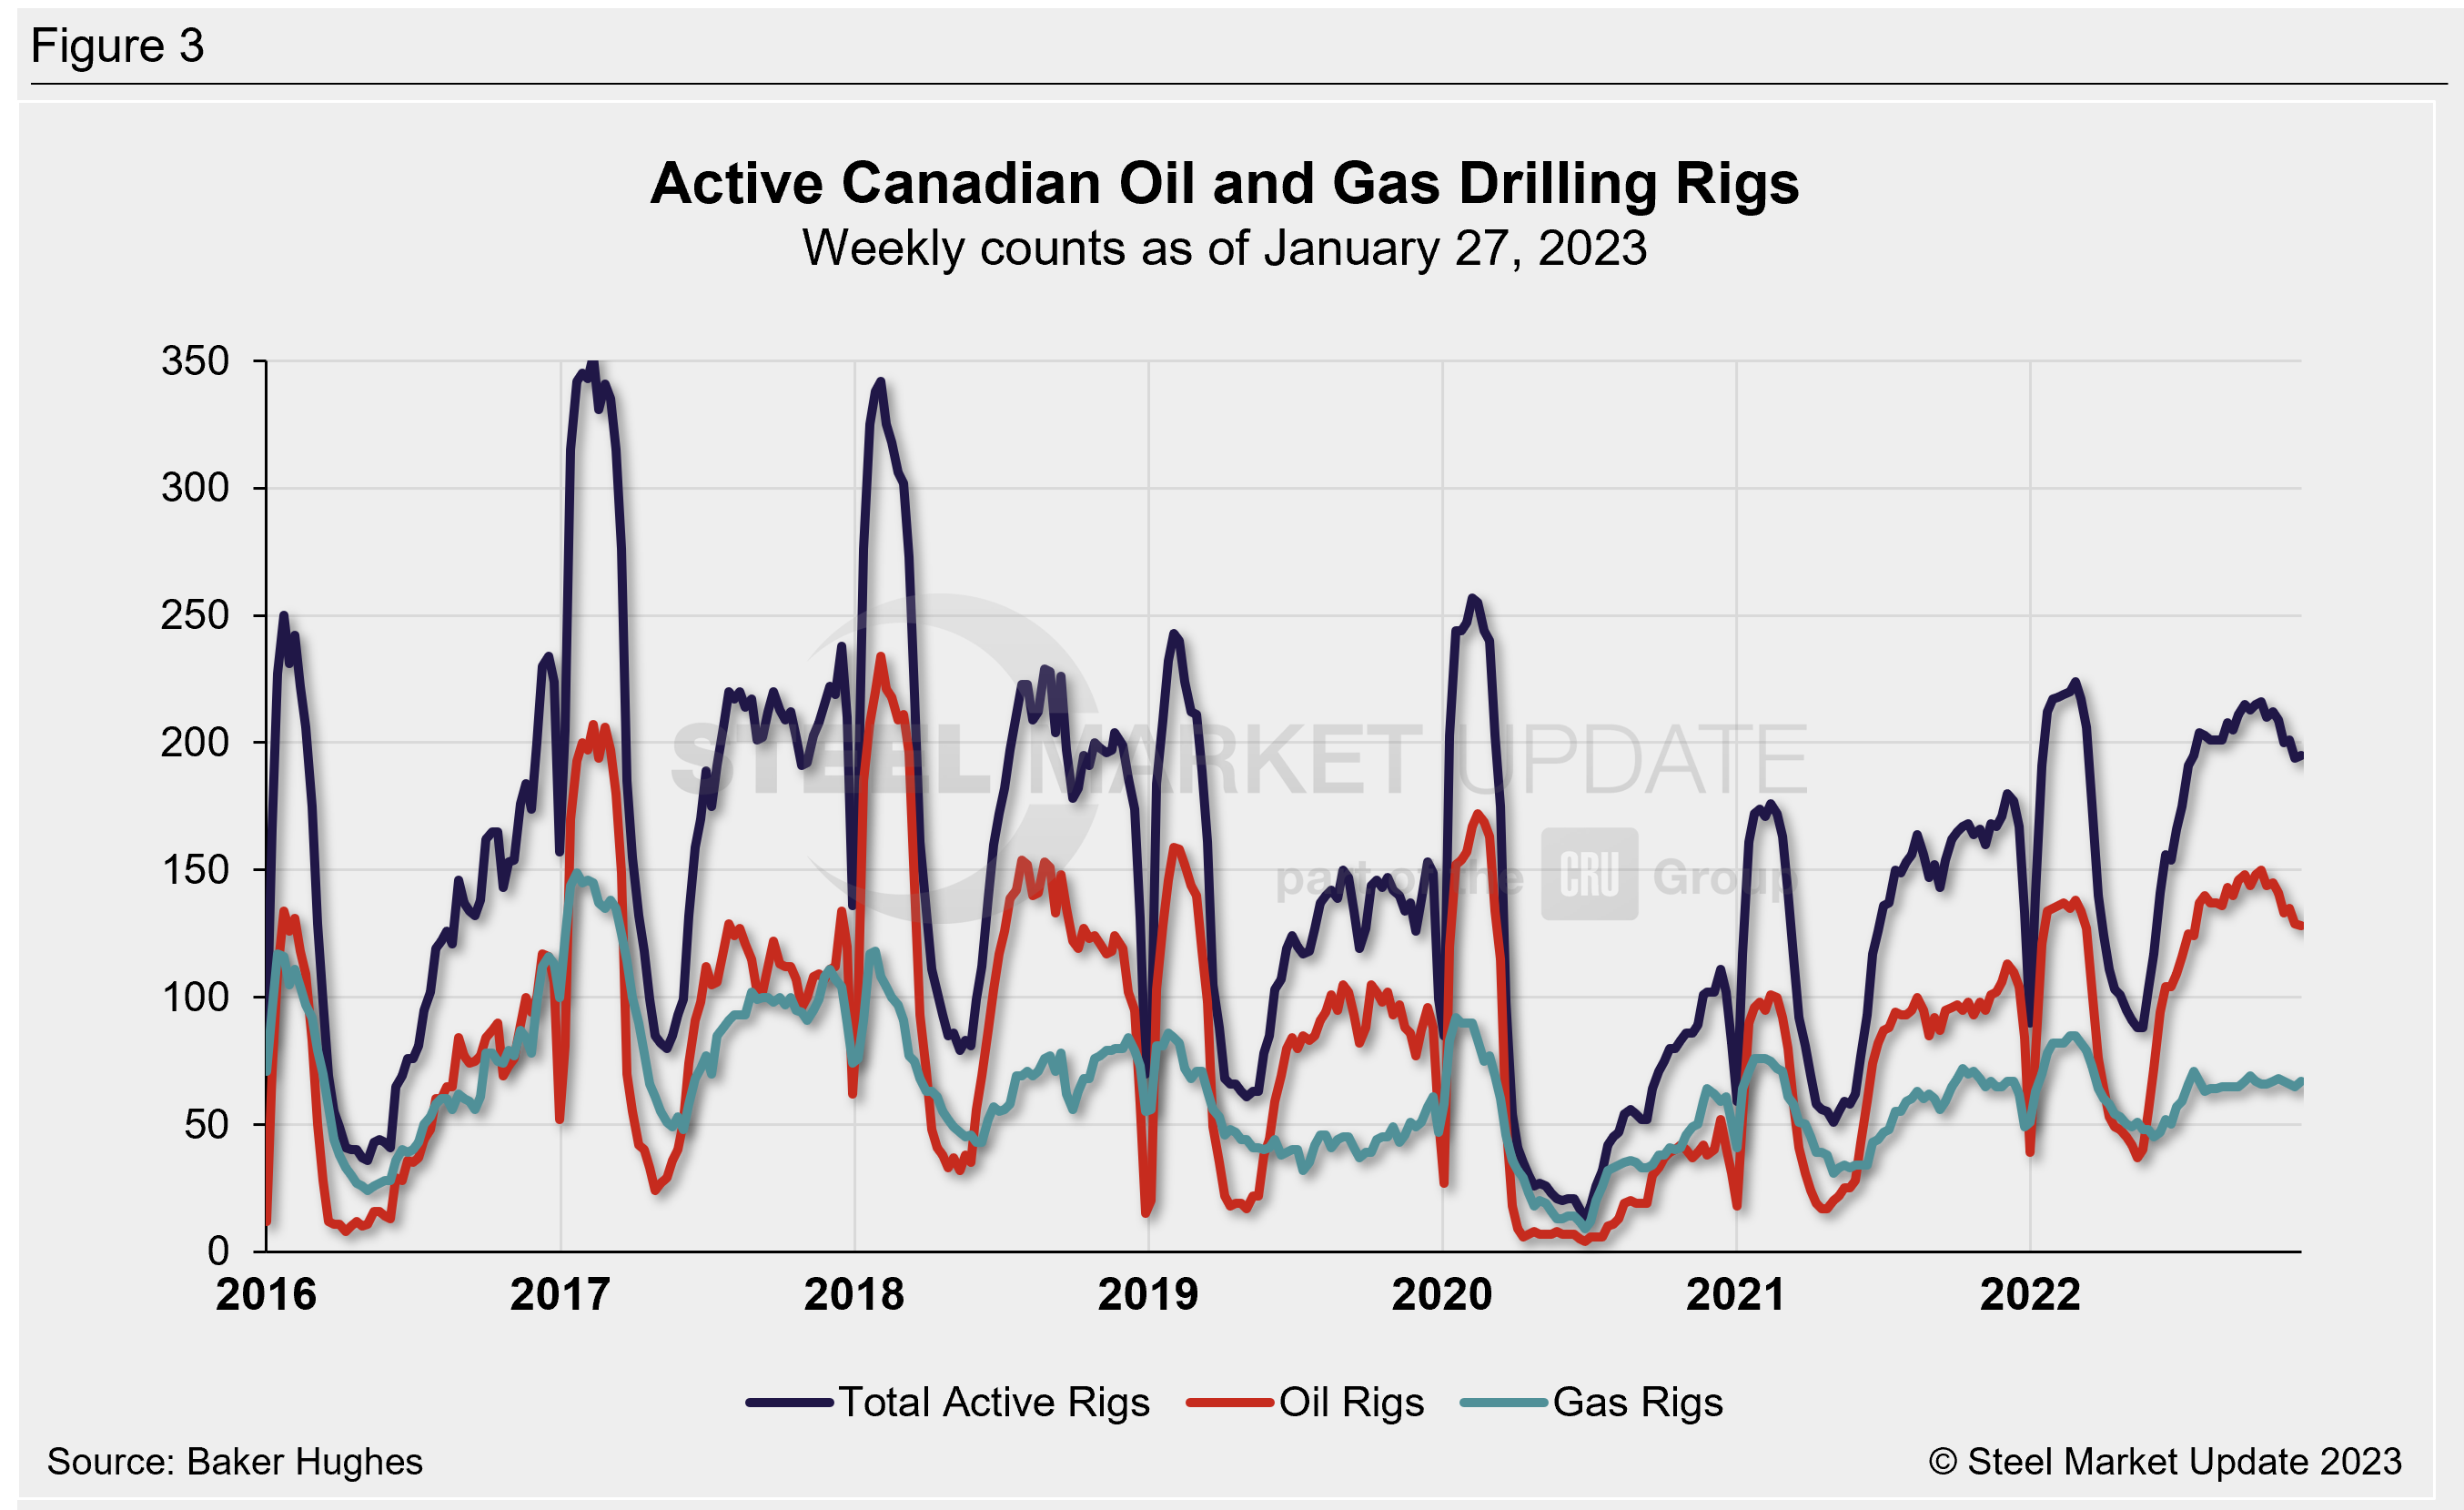
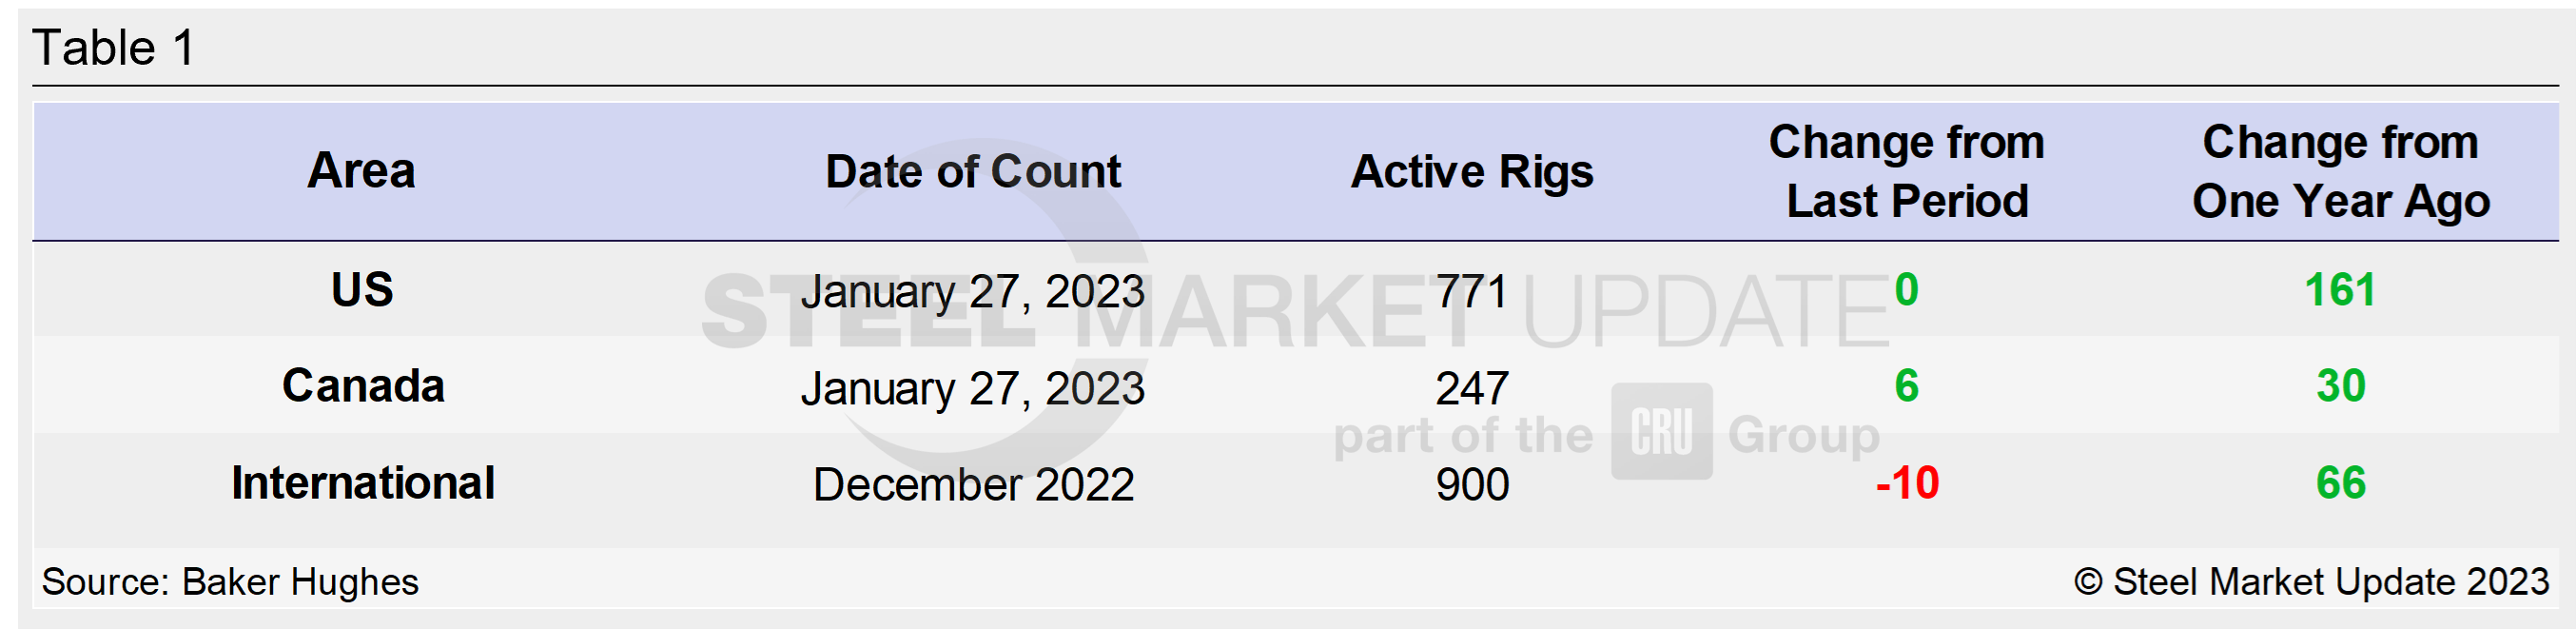
Table 1 below compares the current US, Canadian and international rig counts to historical levels.
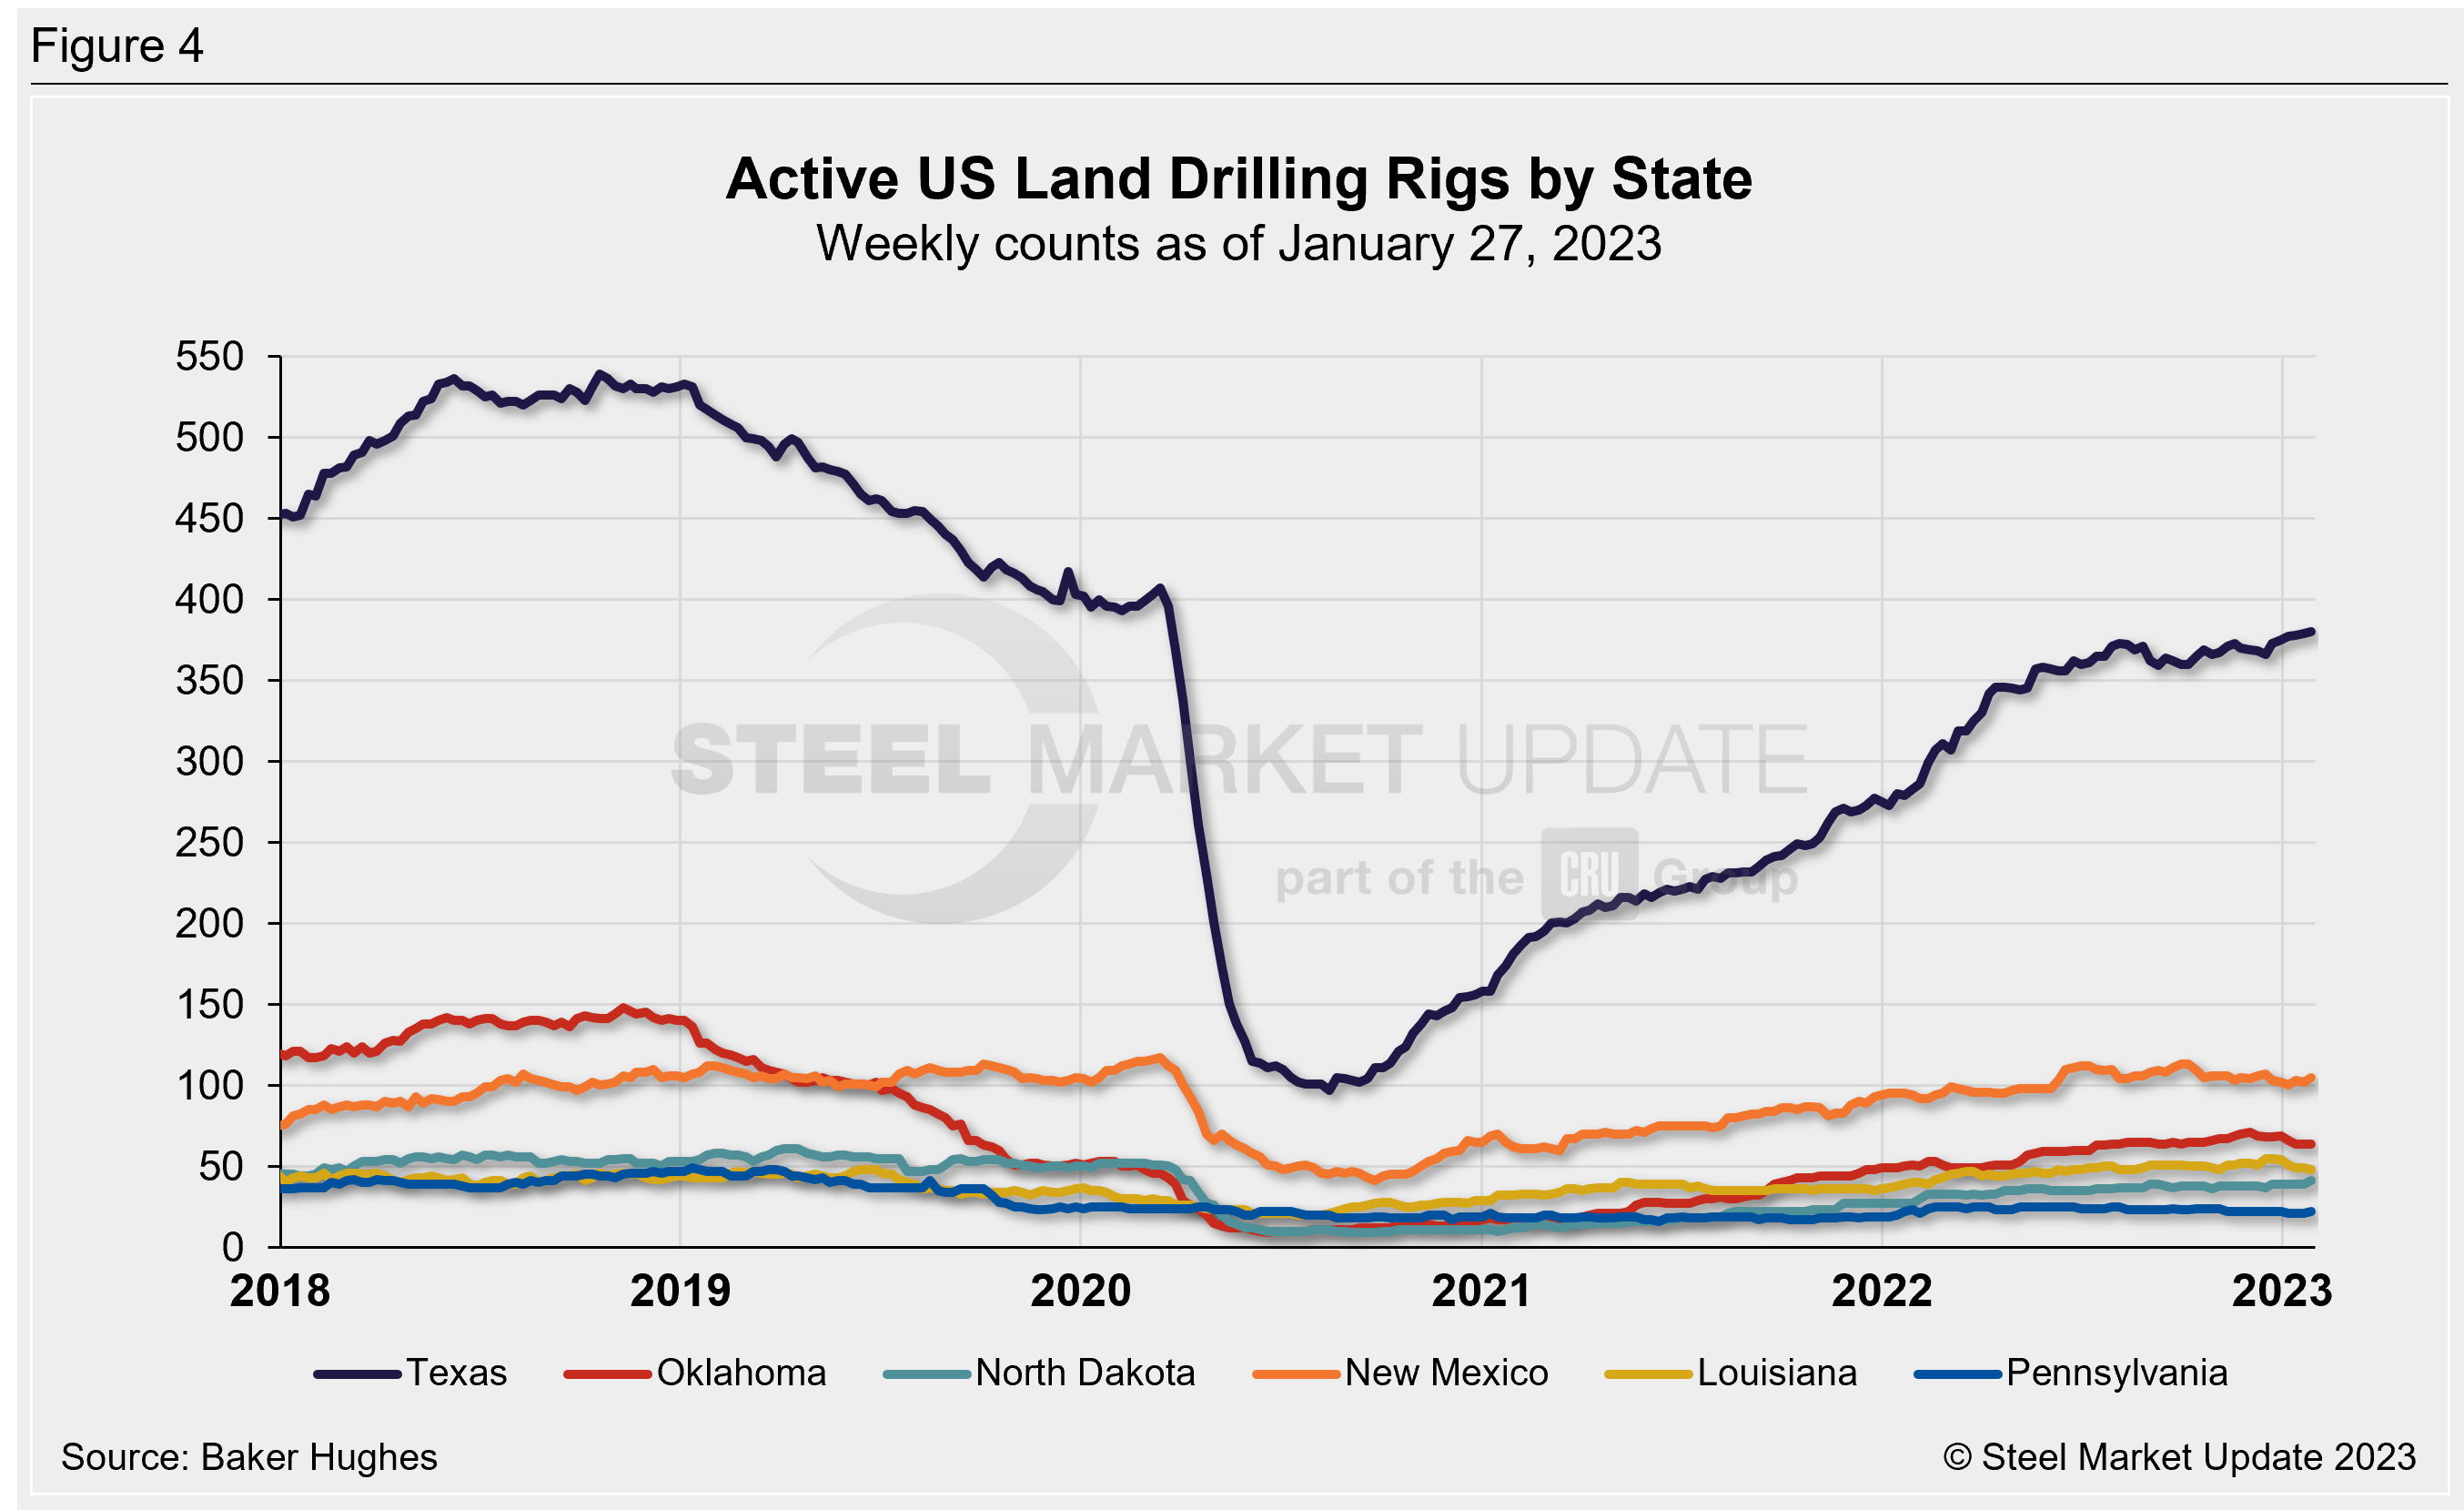
US oil and gas production is heavily concentrated in Texas, Oklahoma, North Dakota, and New Mexico. Production levels have improved since the beginning of the new year, but not all activity has recovered to pre-2020 levels (Figure 4). As of Jan. 27, Texas is the most active state with 380 rigs in operation, and New Mexico is the second highest with 105 rigs. Recall that the number of active Texas rigs had plummeted 76% in 2020, falling from 407 in April to 97 rigs in August.
Stock Levels
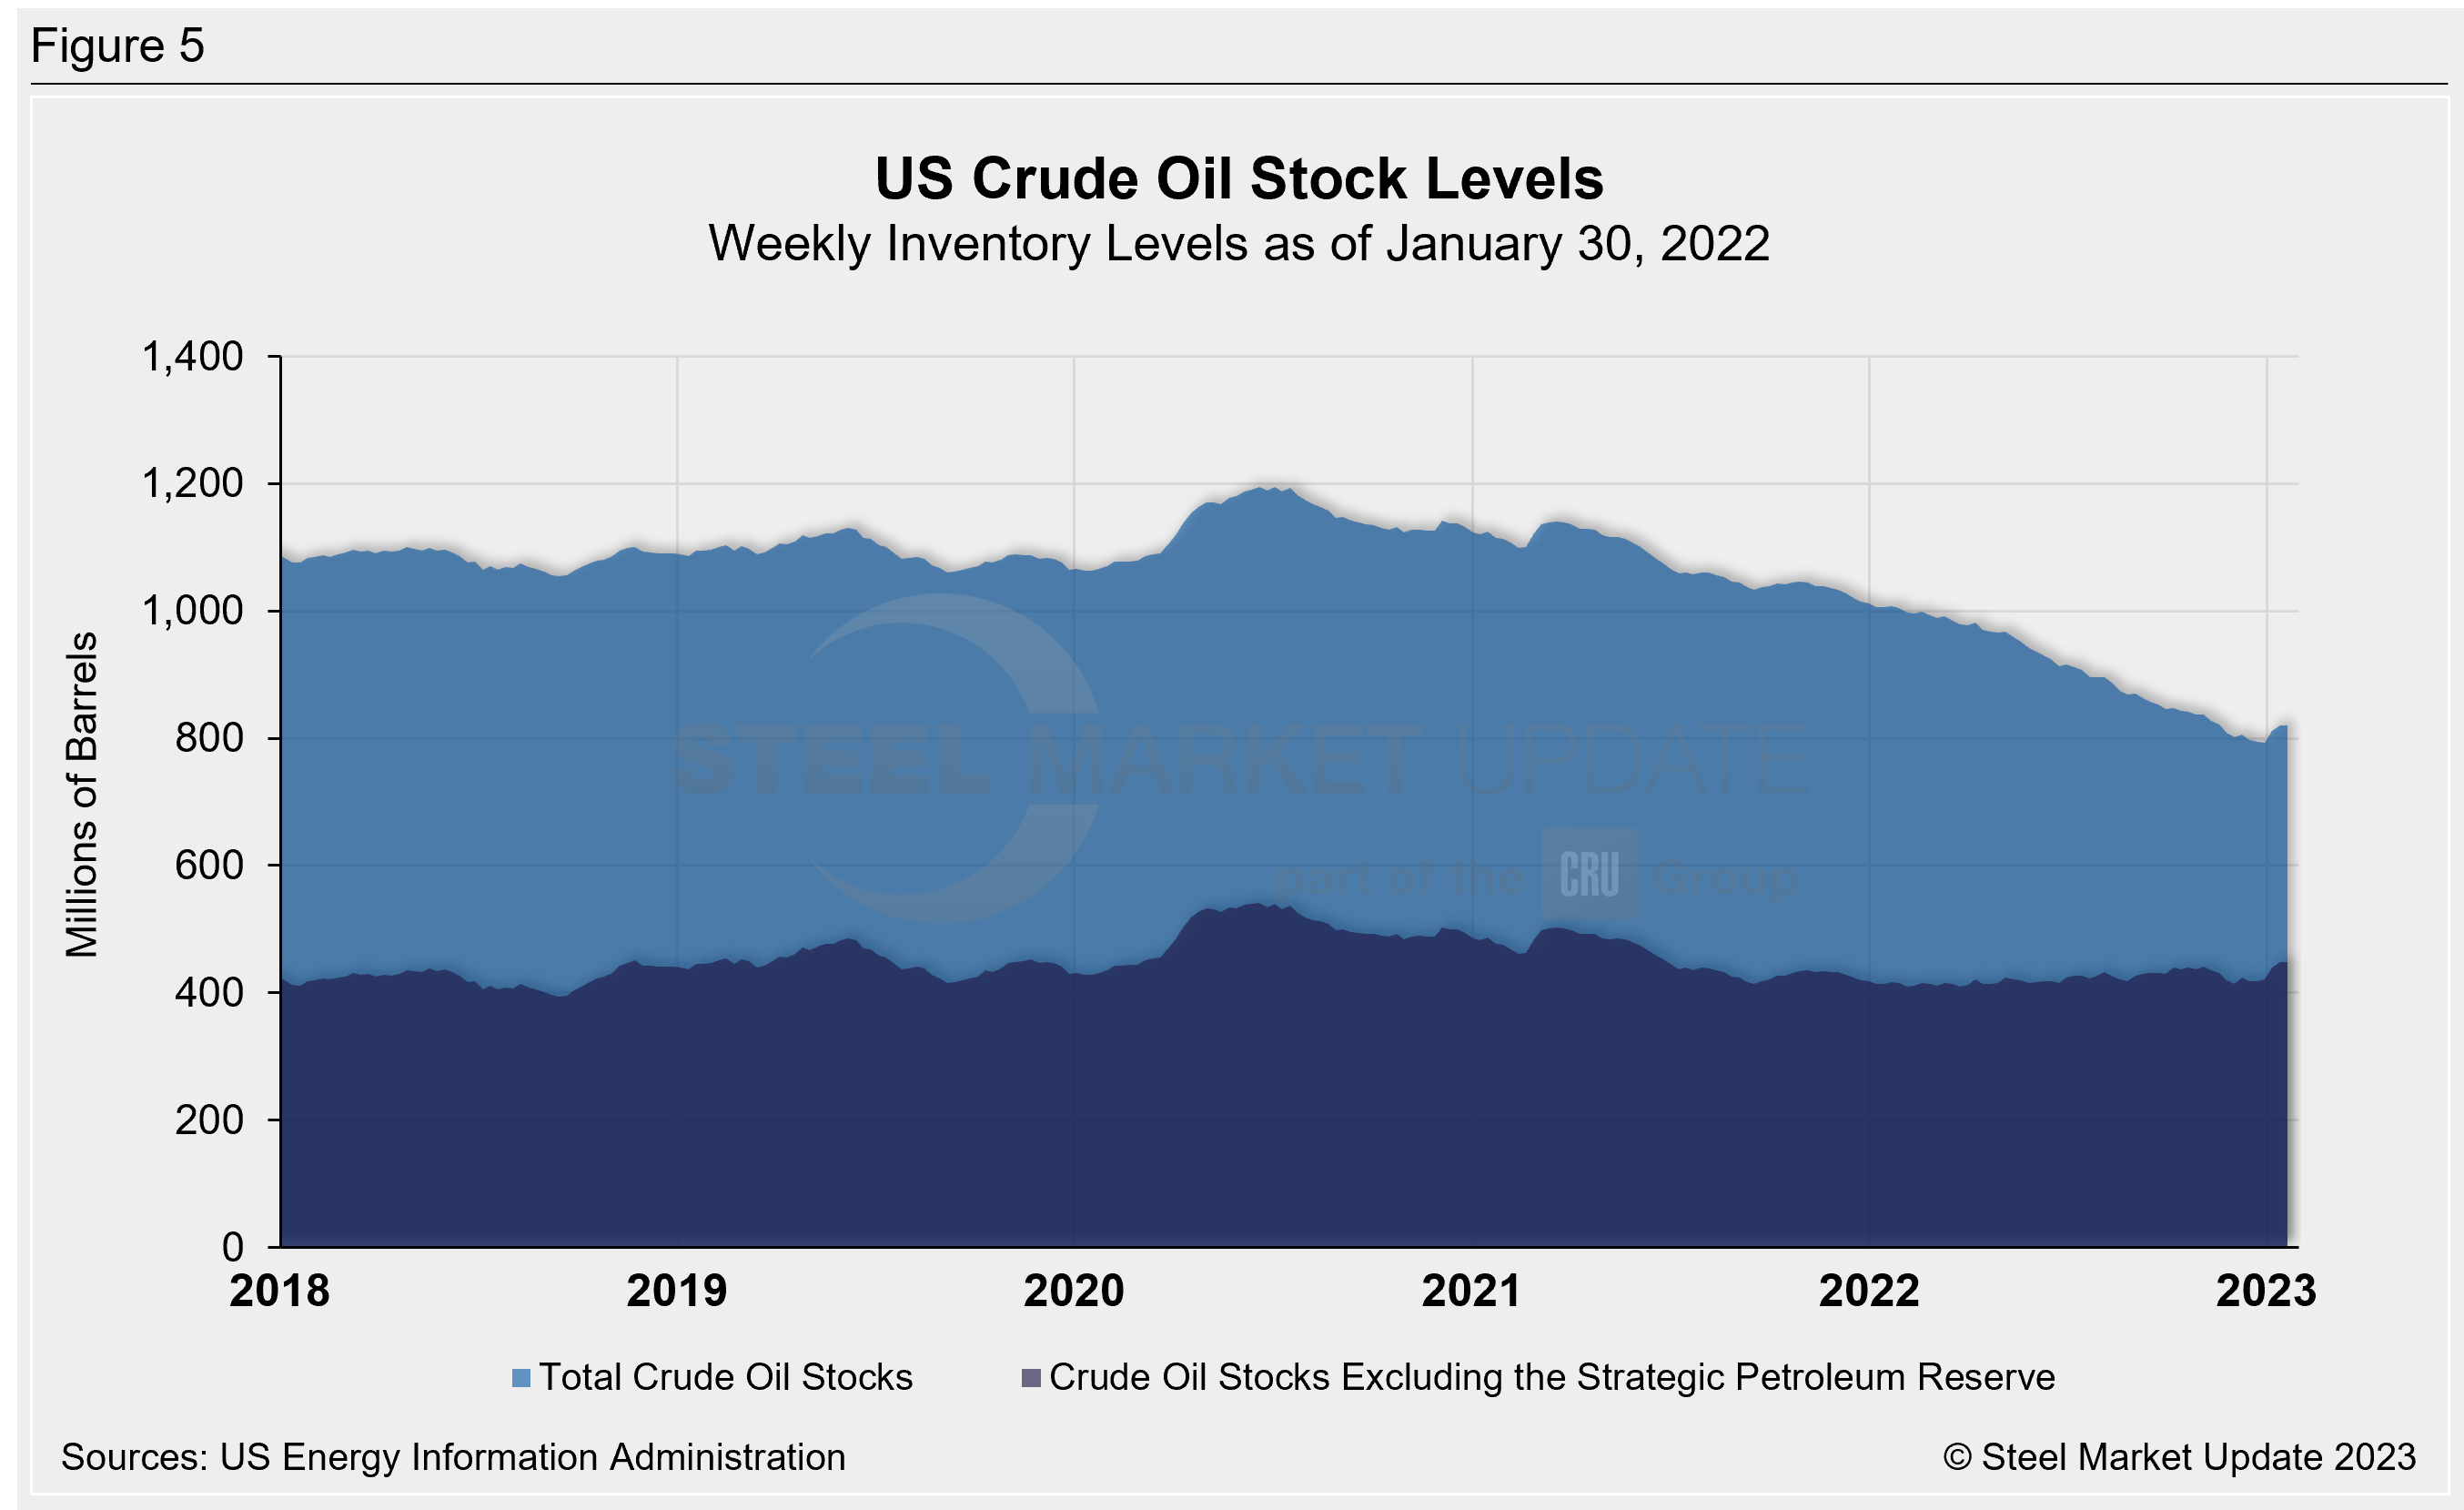
US crude oil stocks have leveled out after reaching a 21-year low of 793 million barrels at the end of December. For comparison, the record low in the EIA’s 40-year history was 608 million barrels in October 1982. (Figure 5).
Trends in energy prices and rig counts are an advanced indicator of demand for oil country tubular goods (OCTG), line pipe, and other steel products.
By Becca Moczygemba, becca@steelmarketupdate.com