

Market Data
February 26, 2023
Global Crude Steel Output Rebounds in January
Written by David Schollaert
Steel Market Update is pleased to share this Premium content with Executive members. For information on upgrading to a Premium-level subscription, email info@steelmarketupdate.com.
World crude steel production rebounded month on month (MoM) in January, driven by widespread increases worldwide. Global production was down, though, more than 6% vs. the same period last year, according to World Steel Association (worldsteel) data.
January’s output gained ground when compared to December, up 3.3%, recovering for the first time in four months. World crude steel production was estimated at 145.3 million metric tons last month.
January’s increase in crude steel production was led by a 4.8% increase in ex-China output, while Chinese output rose by 2.1% MoM last month. The rest of the world produced a total of 65.8 million metric tons, up from 62.8 million metric tons the month prior.
Last month’s global total was down 16.7%, or 29.1 million metric tons less than May 2021’s all-time high of 174.4 million metric tons. January’s MoM increase put output down 4.2%, or 6.3 million metric tons less than the pre-pandemic period of January 2019.
The US remained the fourth-largest crude steel producer in the world in January, accounting for 6.5 million metric tons, or 4.5%, of the global total. US production last month was unchanged vs. December’s total.
Shown below in Figure 1 is the annualized monthly global steel production on a three-month moving average (3MMA) basis as well as capacity utilization since January 2001. Also shown is the year-on-year (YoY) growth rate of global production on the same 3MMA basis since January 2018. Both are based on worldsteel data.
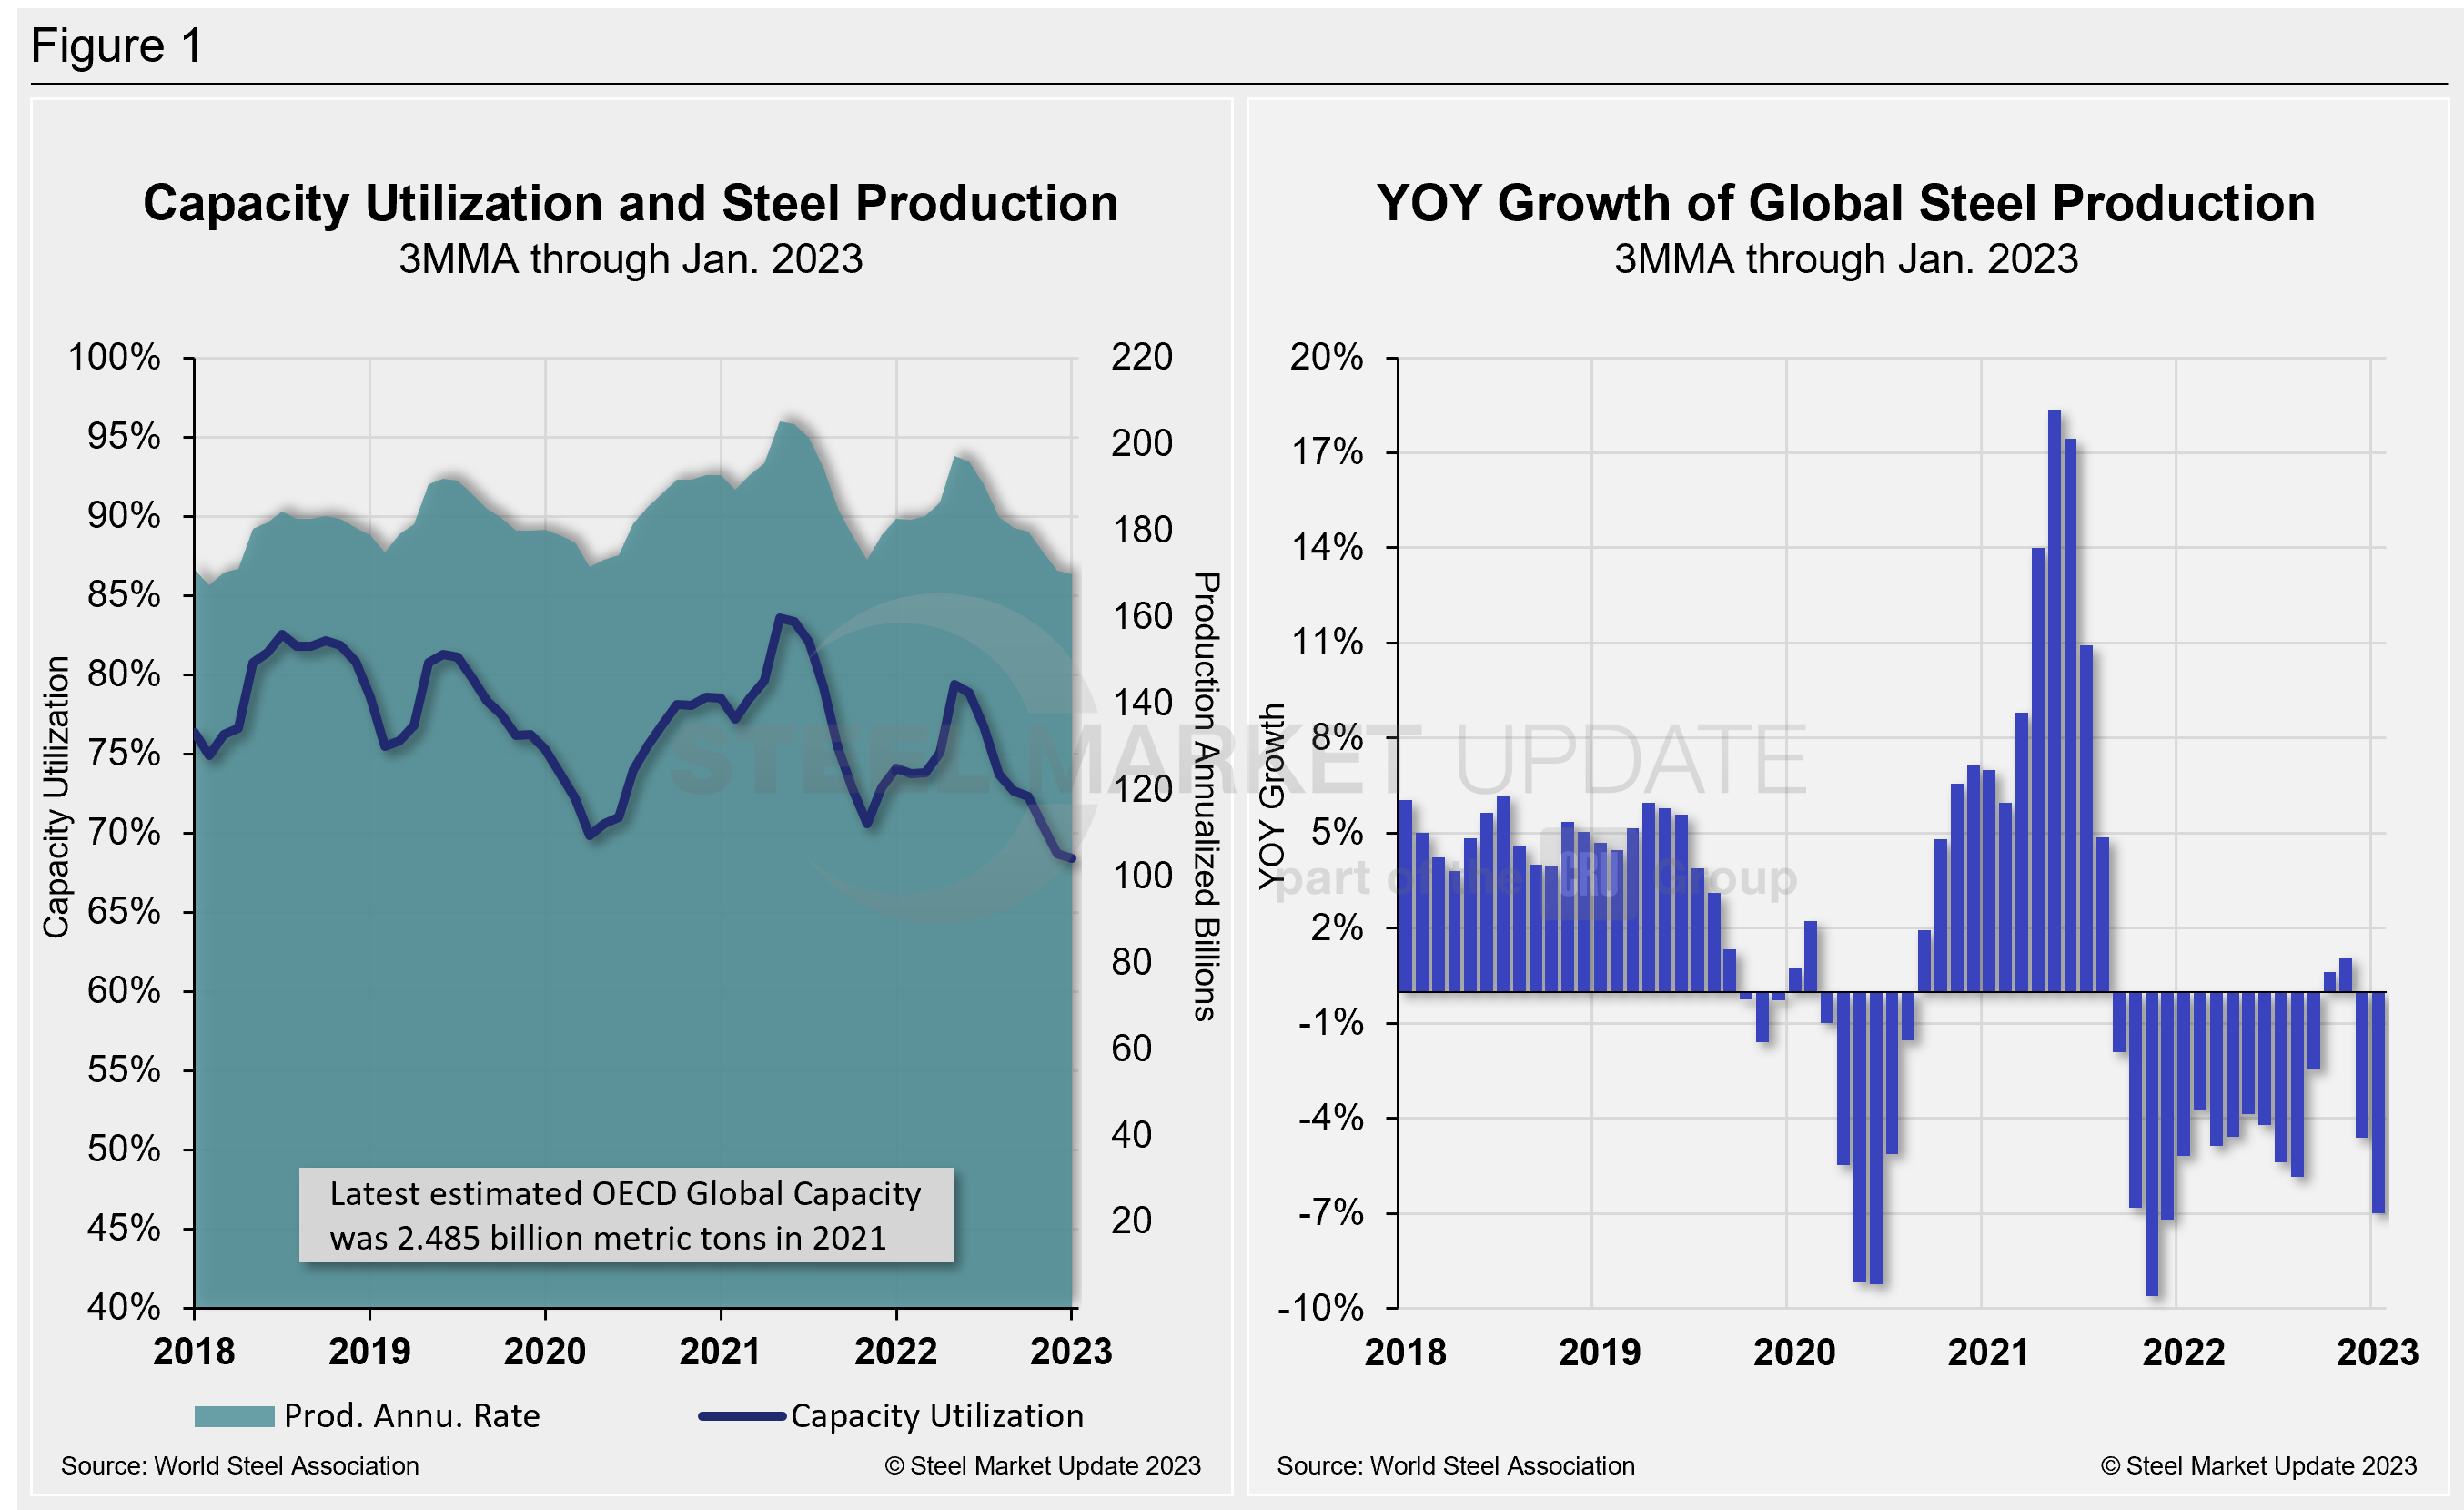
Mill capacity utilization in January on a 3MMA basis was 68.4%, down 0.3 percentage points from the month prior. On a tons-per-day basis, production last month was 4.687 million metric tons, up 3.3% MoM. That figure is 1.13 million metric tons off May 2021’s record rate of 5.813 million metric tons. Growth on a 3MMA basis through January YoY was -7%, a 2.4-percentage point decline from the month before. The result is a far cry from the 18.4% expansion seen in May of last year.
Displayed in the table below is global production broken down into regions. It shows the production of the top 10 nations in November and their share of the global total. It also shows the latest three months and 12 months of production through last month with YoY growth rates for each period. Regions are shown in black font and individual nations in gray.
World steel production overall is noticeably down when looking at both the three- and 12-month comparisons. Only India and Iran trump that trend. Despite the MoM increase in total global output, the fourth-quarter collapse is clearly displayed in the table below.
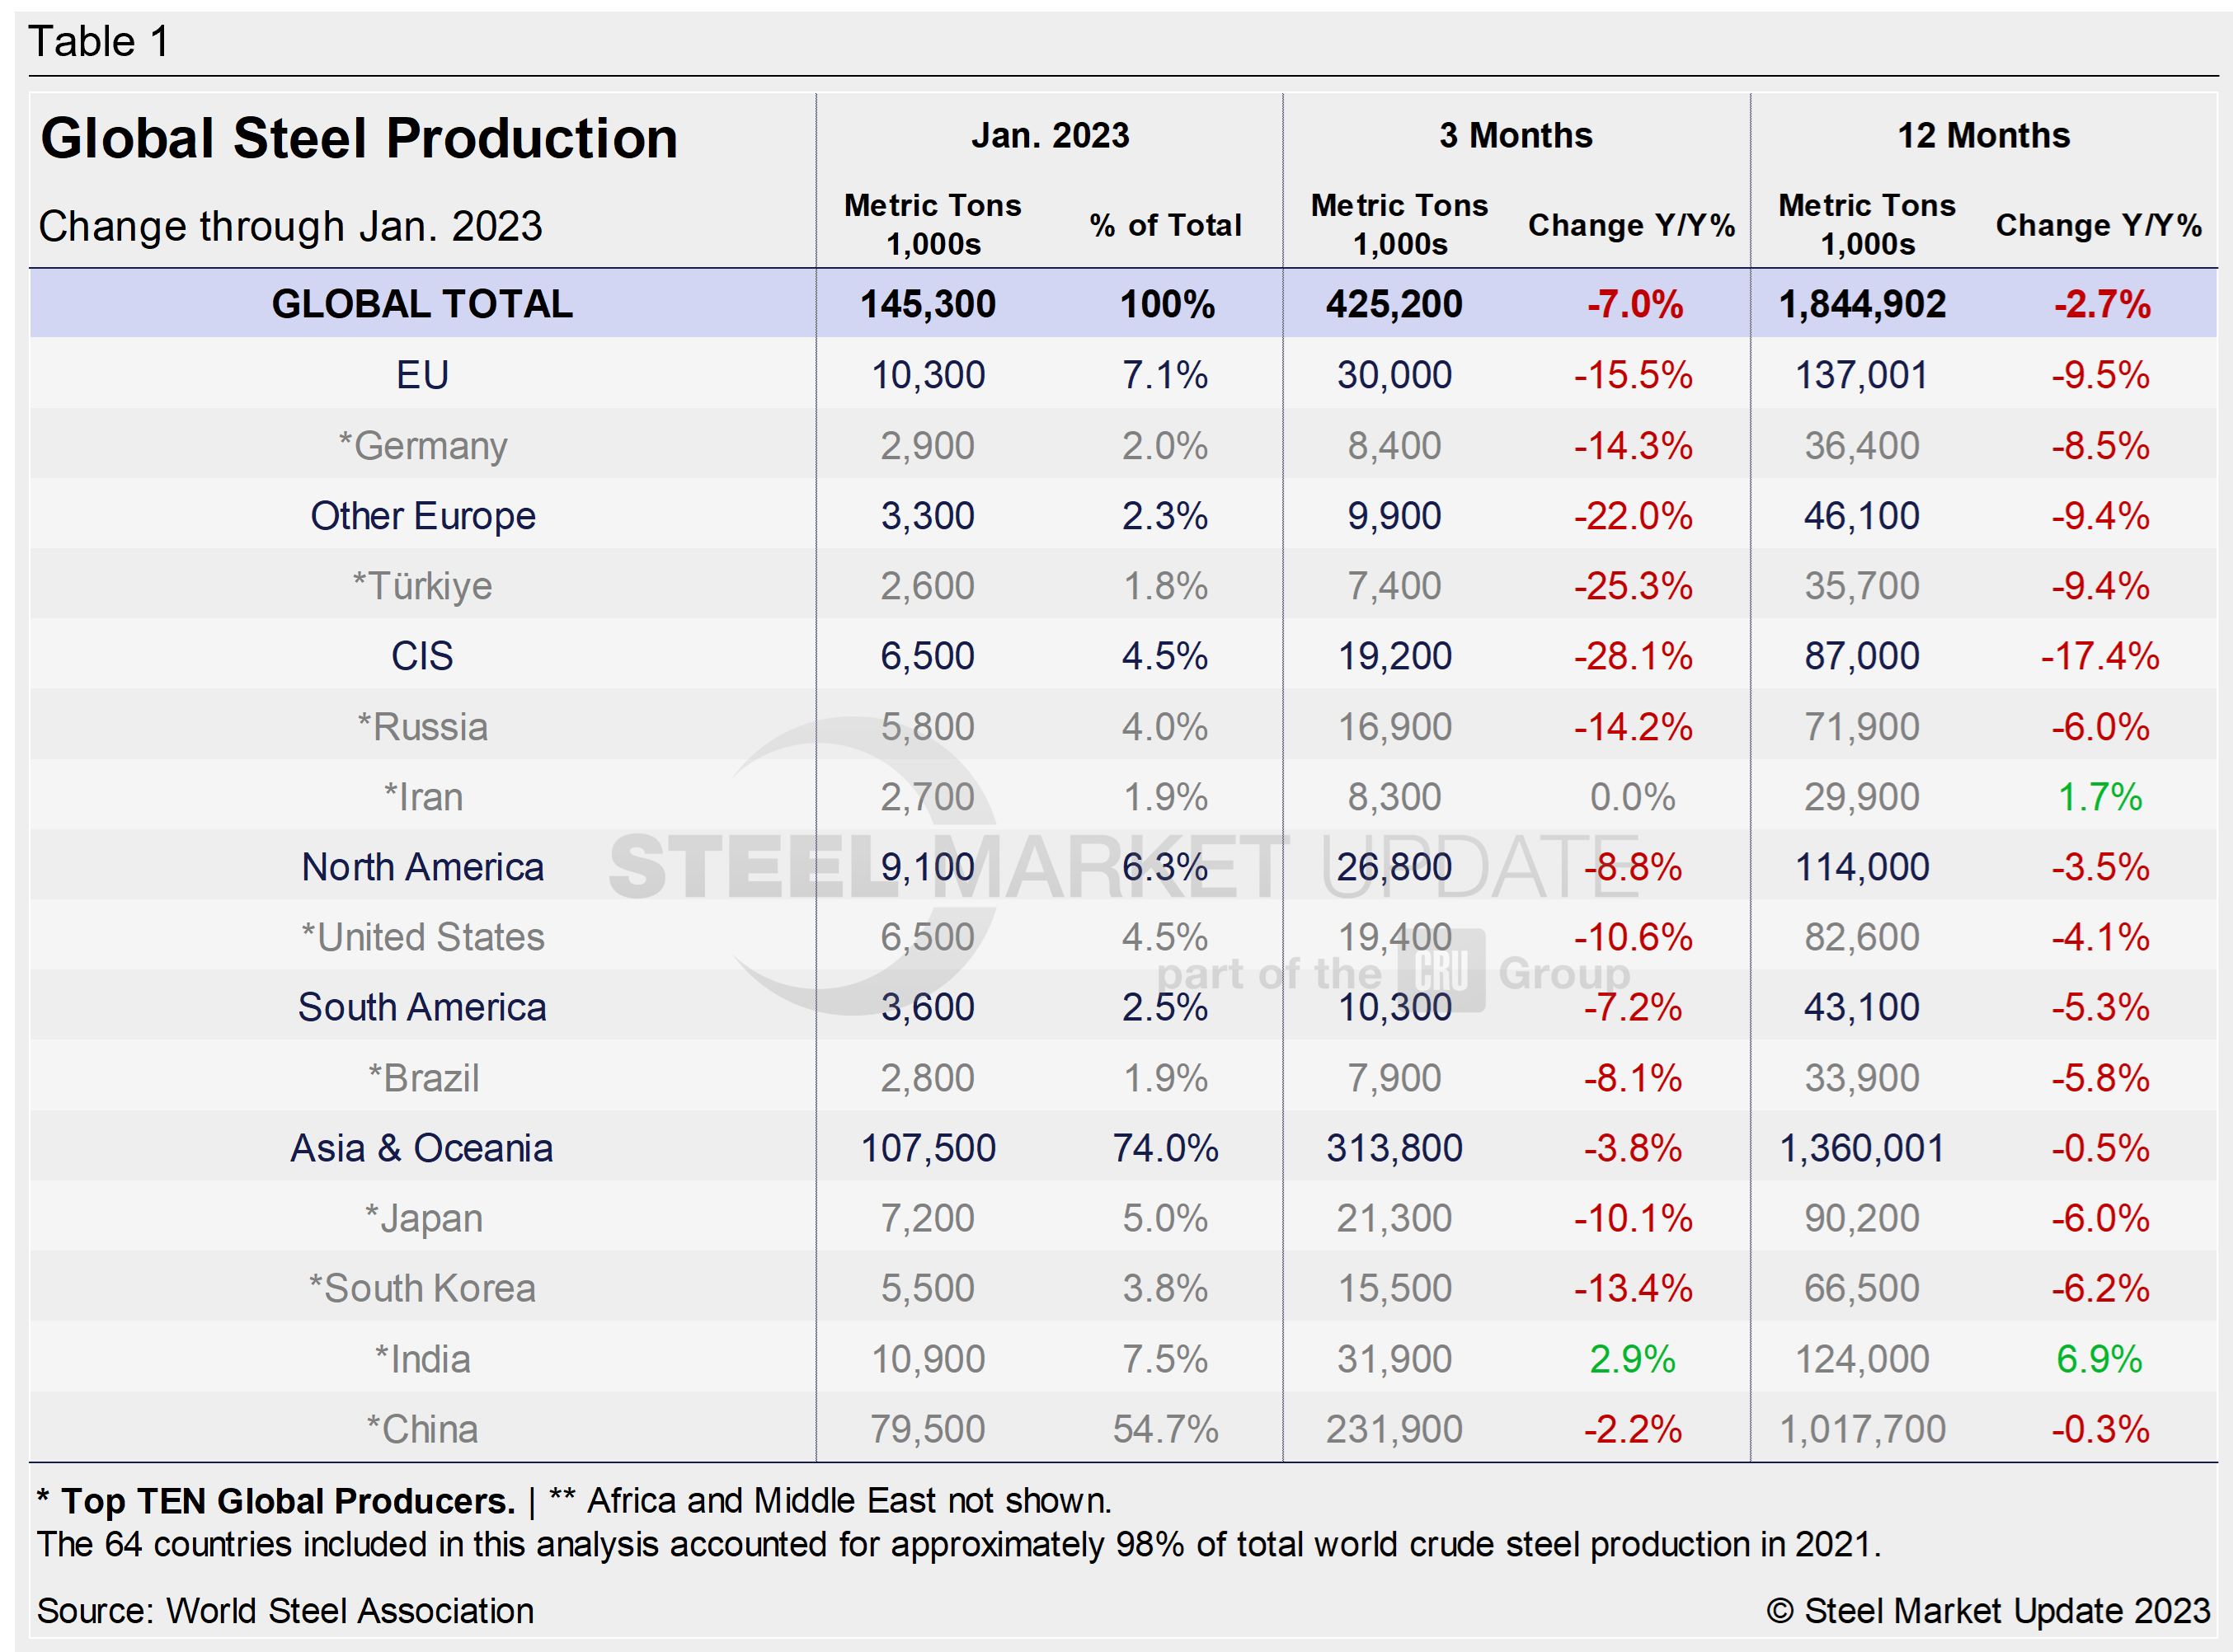
The table shows that North American production is down on a YoY basis, but even more so in the three months through January. The trend shows North American output is on a declining trend. With the positive momentum in the North American market over the past 12 months giving way, it does point towards the economic headwinds the market has faced coupled with year-end seasonality. Nevertheless, when compared to the same pre-pandemic period in 2020, present output is down up 21.6%
China’s Crude Steel Production
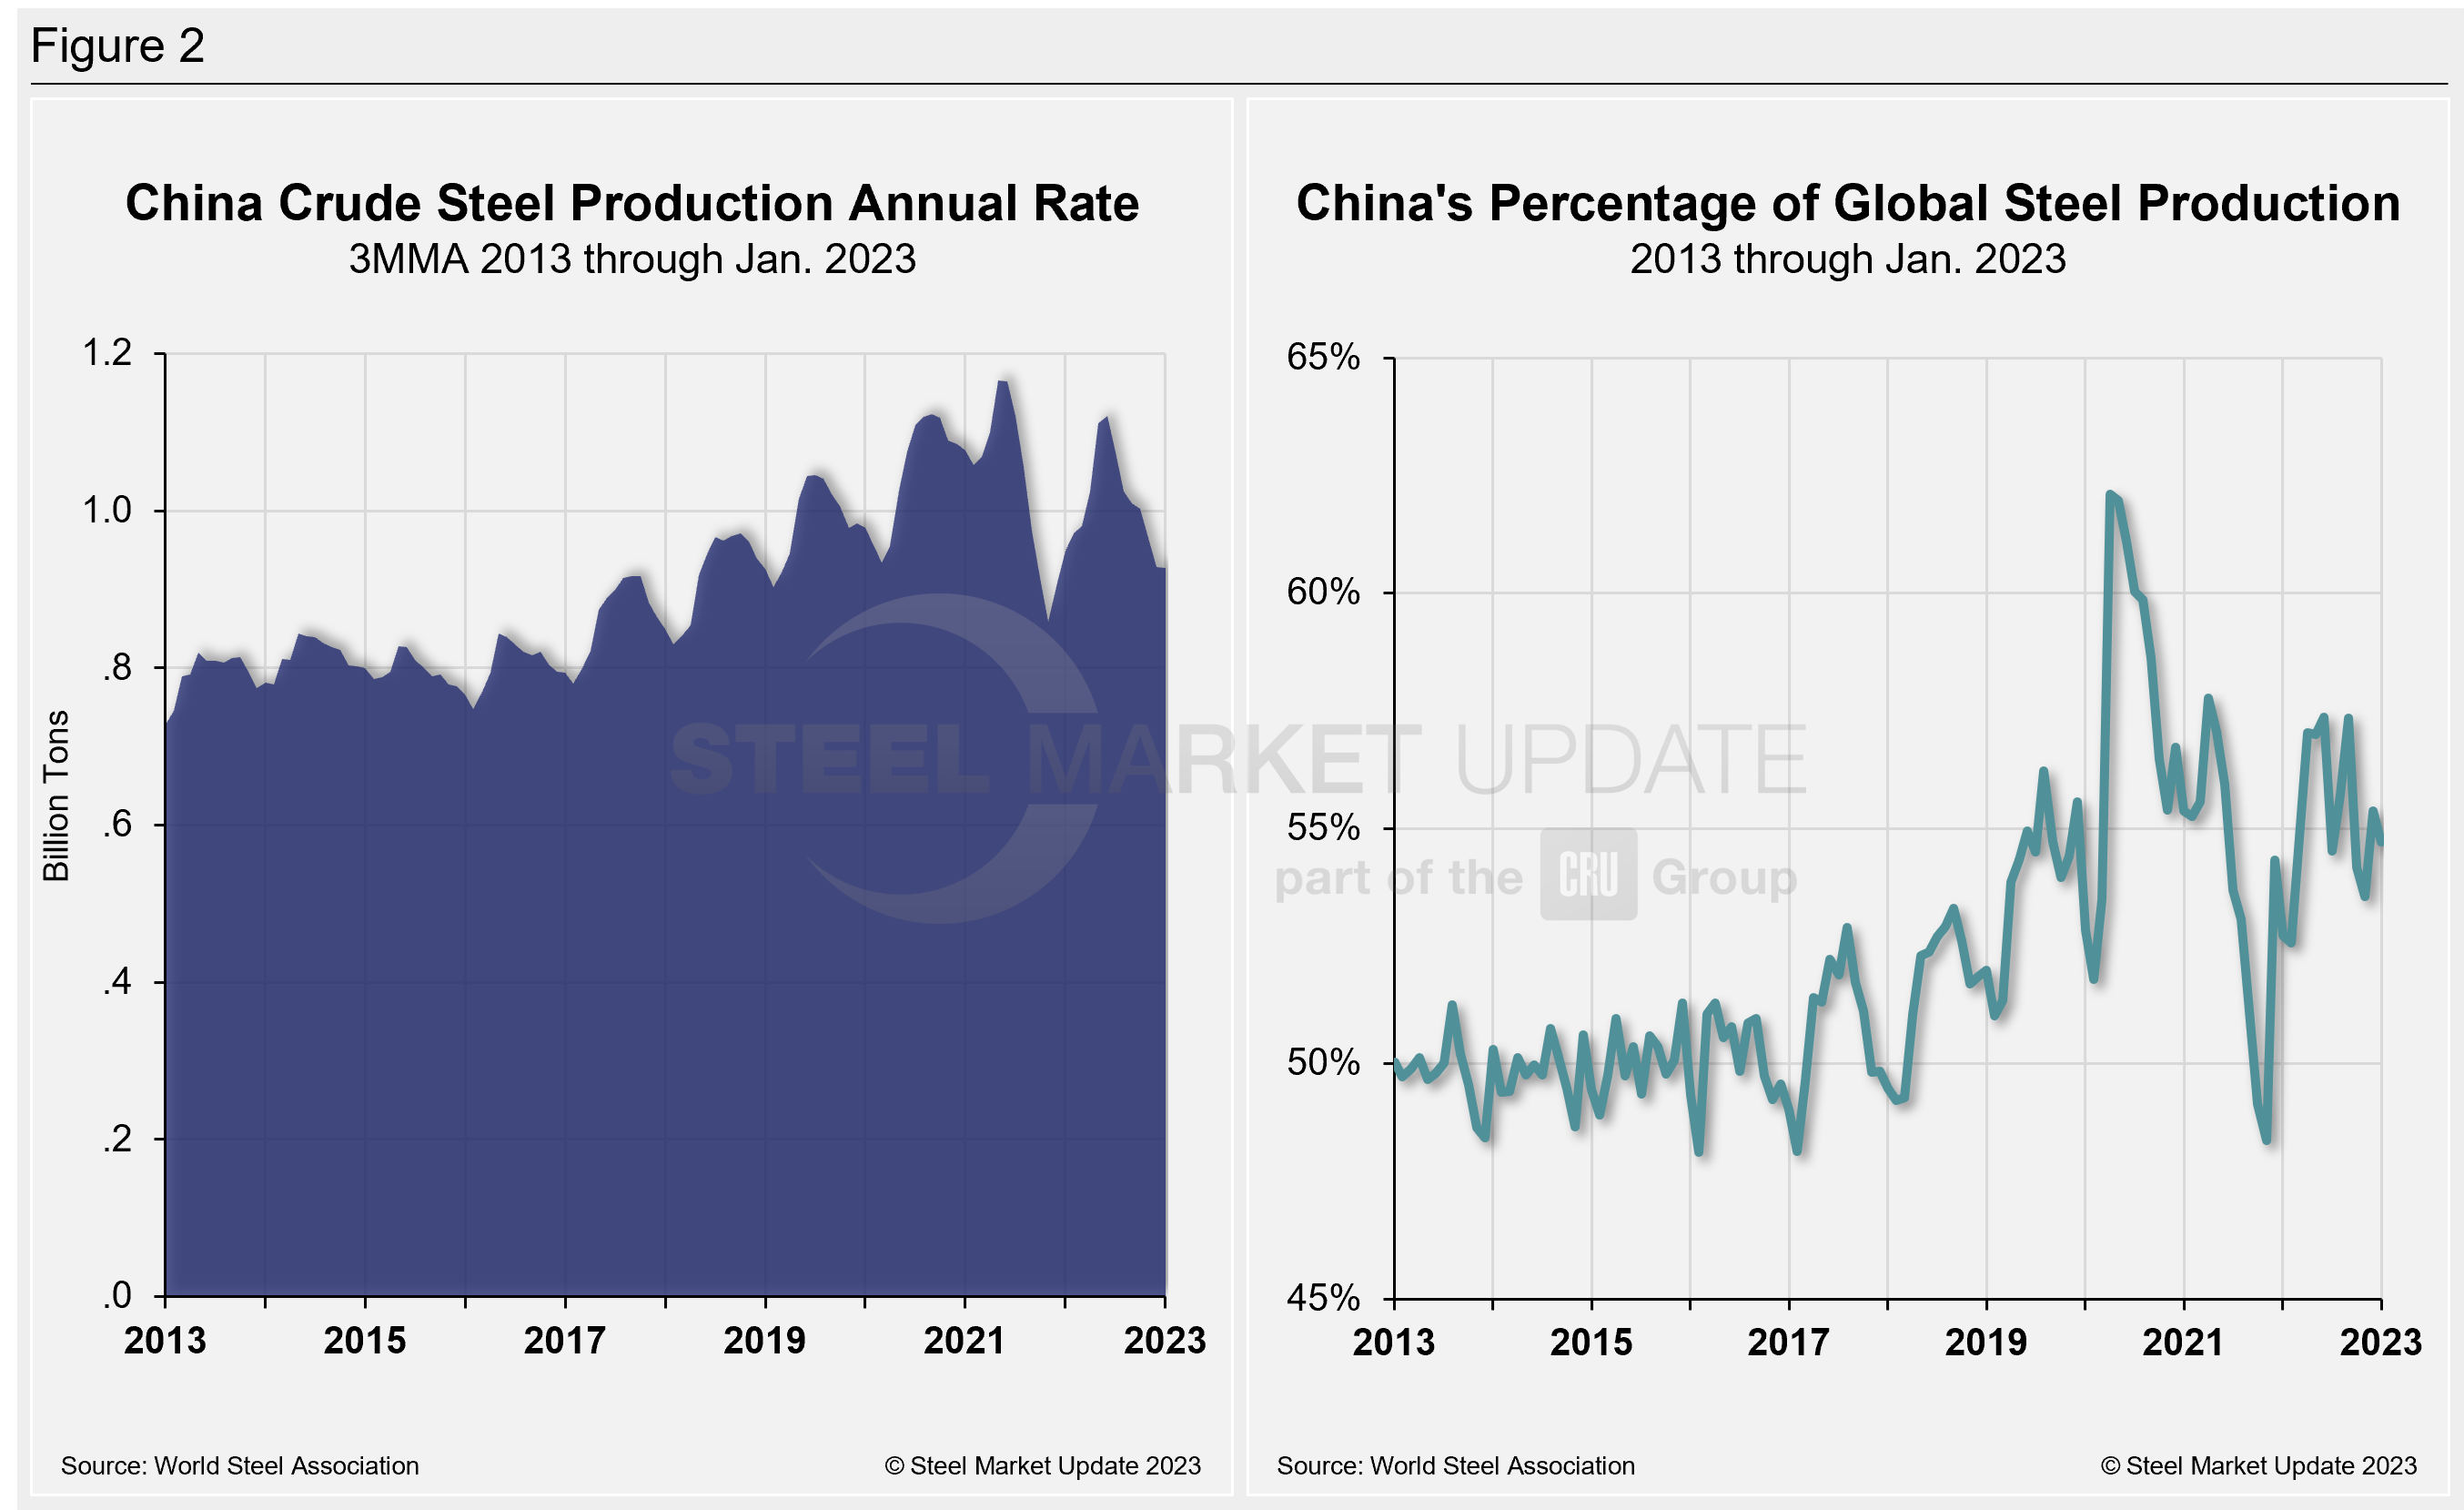
China’s monthly steel production was estimated at 79.5 million metric tons in January, up from 77.9 million metric tons the month prior. The 1.6-million-ton MoM increase follows a similar increase in December. Last month’s total is still about 20 million metric tons below China’s all-time high crude steel output of 99.5 million metric tons in May 2021.
On a 3MMA basis, the annual rate of China’s crude steel production maxed out at 1.166 billion metric tons in May 2021. It has fallen repeatedly since February of last year, reaching its lowest total in November 2021. China’s annual capacity stands at 1.128 billion metric tons, while its annual production rate through January was 928 million metric tons.
Despite the MoM increase, China’s annual capacity utilization was marginally lower at 89.3% last month, about 0.2 percentage points lower vs. the month prior, and down from an all-time high of 98.4% last June.
China still produced more than half (54.7%) of the world’s steel in January. Chinese production last month was 0.8% above its pre-pandemic levels in January 2019.
China’s crude steel production rate and its percentage of global output are displayed side by side in Figure 2.
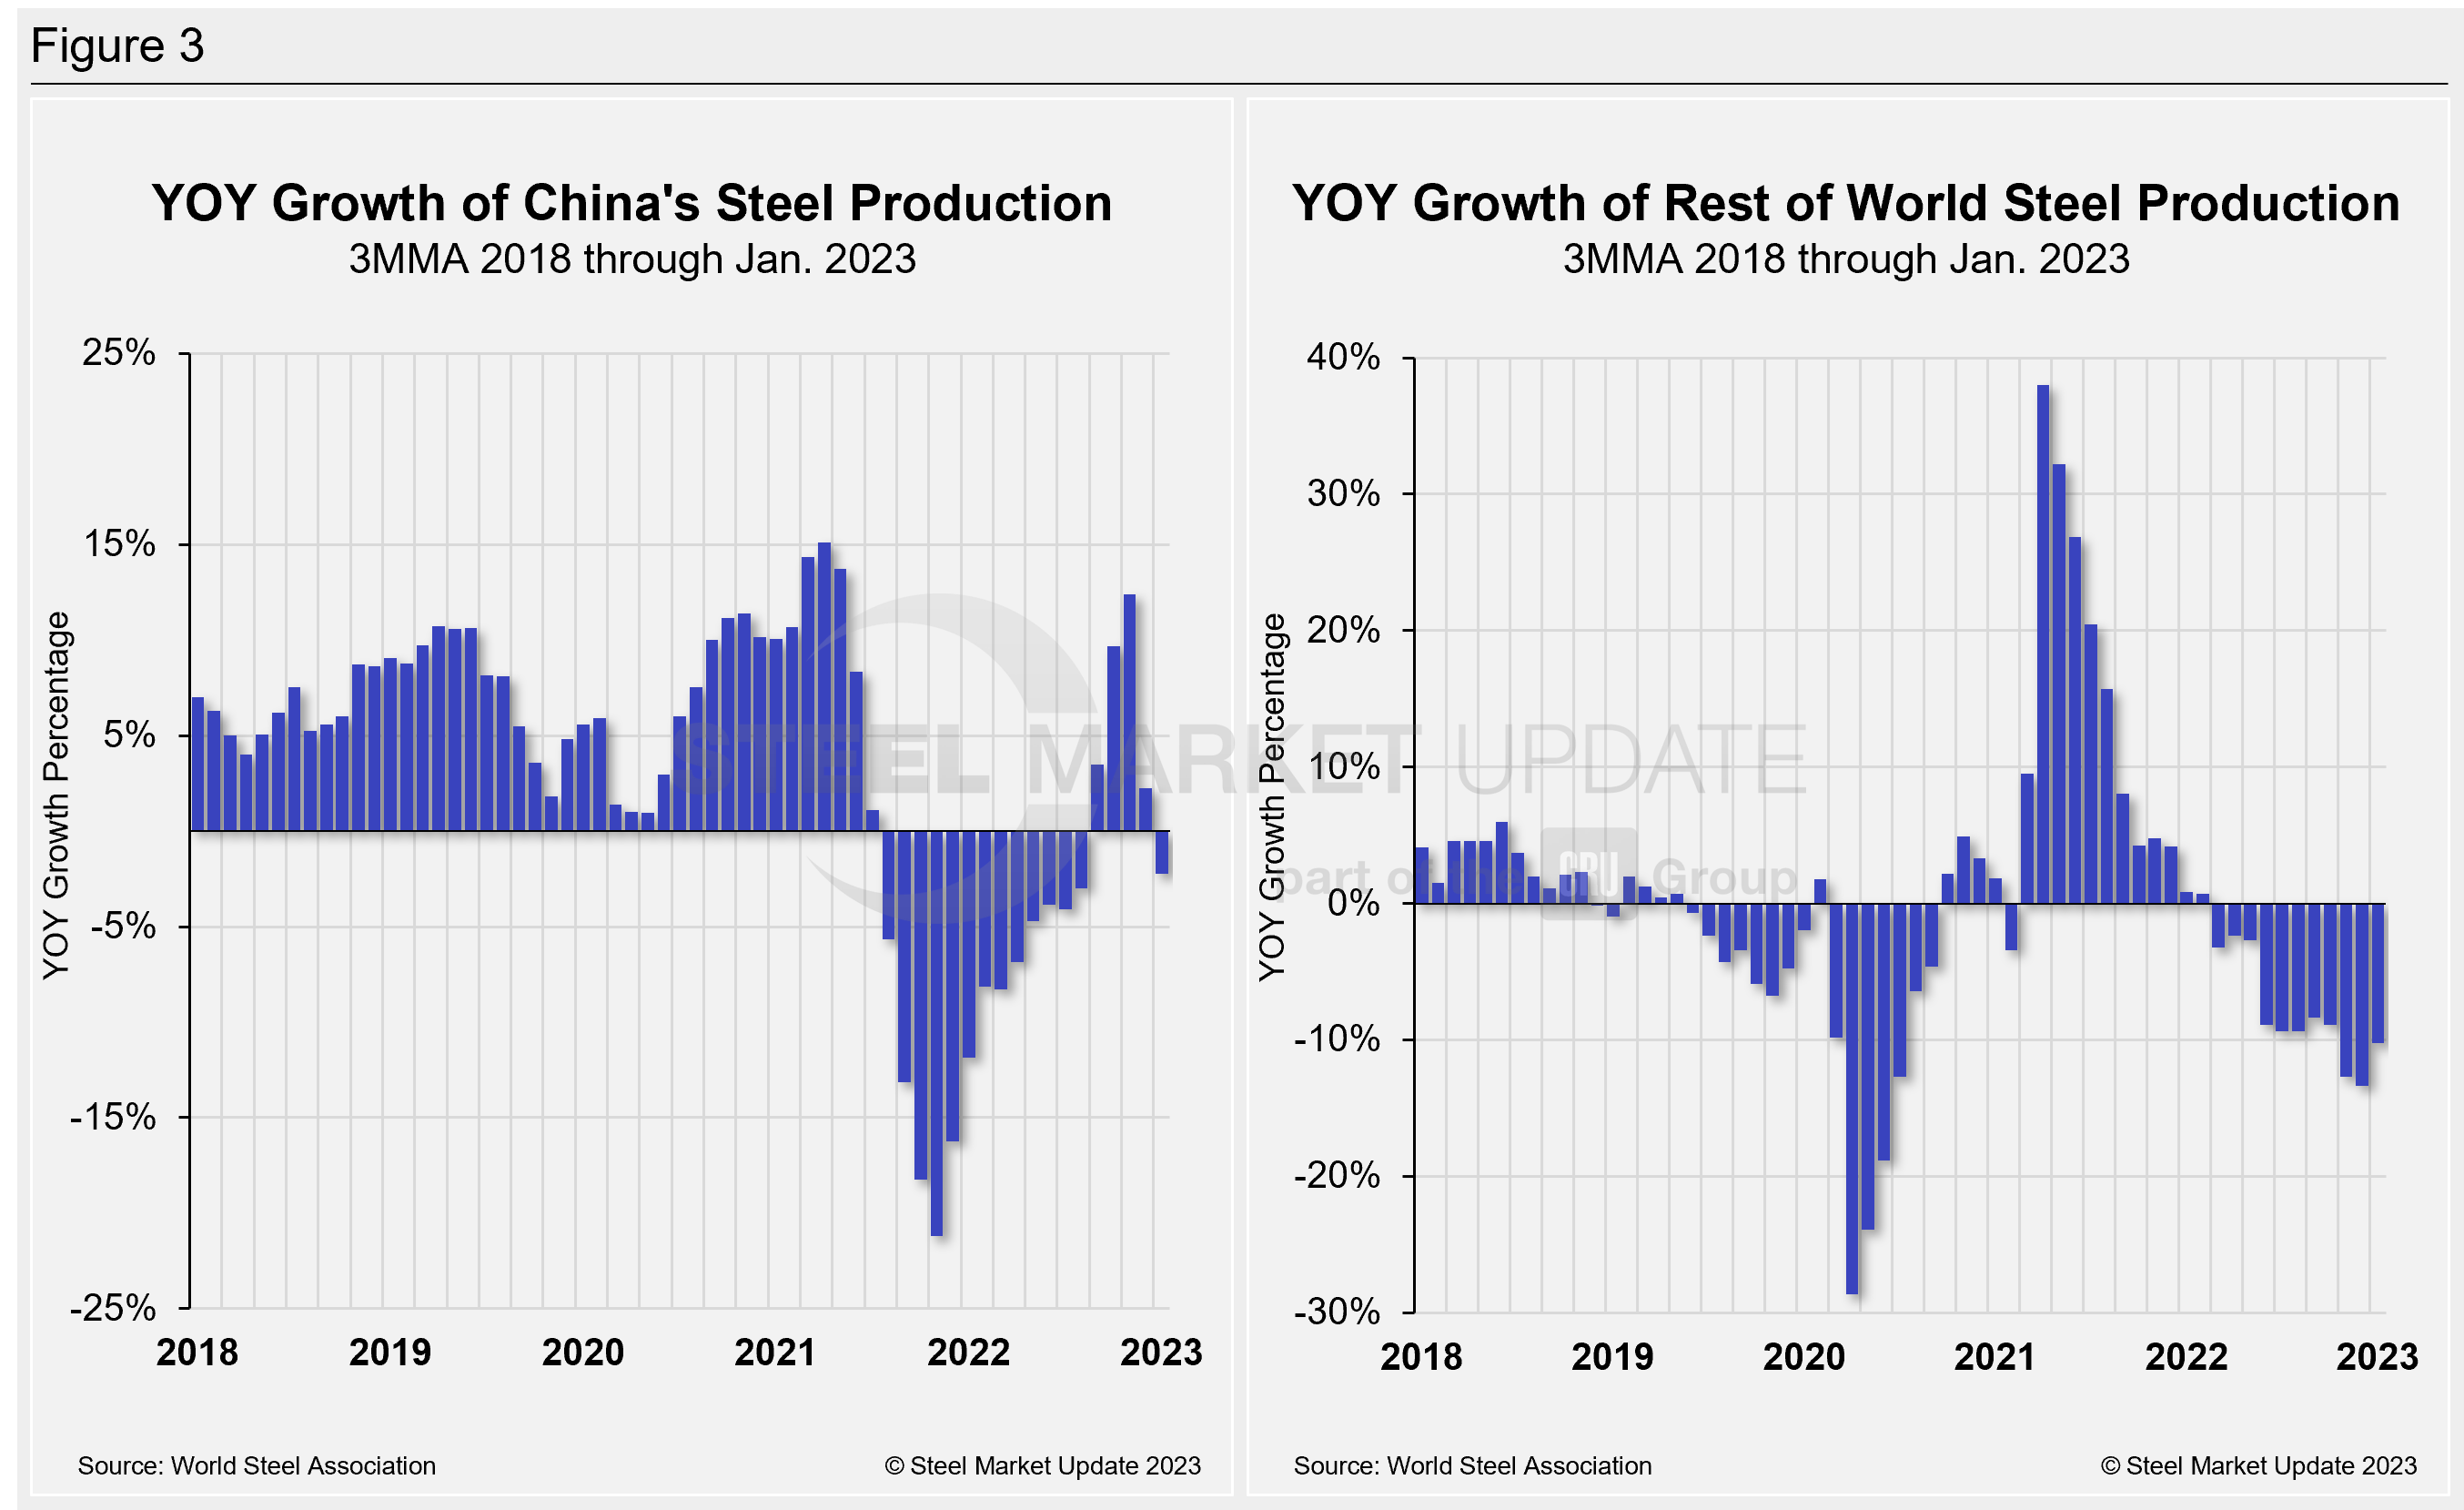
The fluctuations in China’s steel production since January 2013 vs. the growth of global steel excluding China, both on a 3MMA basis, are shown side-by-side in Figure 3. From October 2020 through December 2021, the rest of the world’s production rose sharply, reaching a peak of 38.0% in April. Since then, the rate for the rest of the world’s annual production has decreased sequentially through December. January’s result of -10.2% was a 3.1 percentage point improvement from the month prior and the first increase in 14 months. China’s annual growth rate was -1.3% in January, a 0.6-percentage point improvement MoM. Annual growth is nowhere near the +15.1% seen last April.
By David Schollaert, david@steelmarketupdate.com


