Market Data
August 8, 2023
SMU's July at a Glance
Written by David Schollaert
Steel prices saw some stability early in July as an immediate response to mill price hikes mid-June, but they eventually resumed their downward movement. Hot-rolled coil (HRC) prices ended July at $830 per ton ($41.50 per cwt) on average, having fallen by $60 per ton throughout the month.
The SMU Price Momentum Indicator for sheet products shifted from Neutral to Lower halfway through July. Despite a momentary shift to Neutral when mills first announced their price position, the momentum changed downward as the mills’ price hikes failed to raise tags. The Price Momentum on plate shifted to Neutral at the end of April, and has remined there since as the market has yet to determine a clear direction.
Raw material prices slid lower last month, continuing a trend that began in April. Scrap prices fell another $10-15 per gross ton on average in July. Despite some movement earlier in the month, zinc and aluminum spot prices were largely stable, remaining within historic levels. You can view and chart multiple products in greater detail using our interactive pricing tool here.
The SMU Steel Buyers Sentiment Index remained positive and edged up marginally during the month. Current Buyers Sentiment rose from +62 in June to +64 in July, while Future Sentiment hovered at an average of +63. Our Buyers Sentiment 3MMA Index (measured as a three-month moving average), which recovered slightly in June to +88.50, moved back down in July to +64.00.
Hot rolled lead times averaged 4.60 weeks in July, down from 4.74 weeks the month prior. SMU expects lead times to hover around current levels, but ease slightly in August as the seasonally slower summer period ends. A history of HRC lead times can be found in our interactive pricing tool.
Roughly 85% of hot rolled buyers reported in July that mills were willing to negotiate on prices, down from about 94% in June. In our Aug. 4 survey, 91% of the flat-rolled buyers we polled reported that mills were willing to talk price to secure an order.
Key indicators of steel demand remain steady overall, though nowhere near the bullish levels some had earlier in the year. And while the energy market and the construction sector continue to show signs of improvement, the slower summer has pushed demand and sentiment lower. While light-vehicle production has been steady, employment numbers did disappoint, and labor contract negotiations between the United Auto Workers (UAW) and Detroit’s Big Three automakers remain in question. Needless to say, the post-summer steel market will be closely watched.
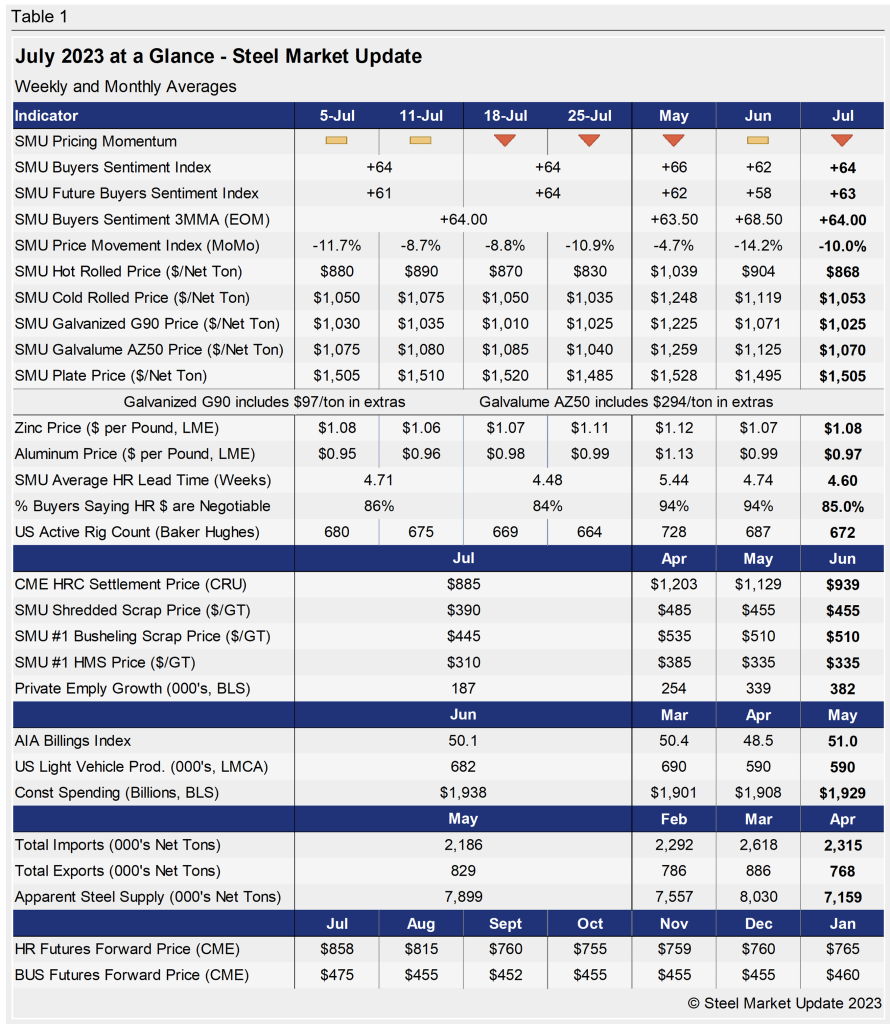
See the chart below for other key metrics for the month of July: