Market Data
December 8, 2023
SMU survey: Buyers Sentiment Indices slip
Written by Ethan Bernard
SMU’s Current and Future Steel Buyers Sentiment Indices both fell during the week of Dec. 6, based on our most recent survey data.
Every other week, we poll steel buyers about sentiment. The Steel Buyers Sentiment Indices measure how steel buyers feel about their companies’ chances of success in the current market and three to six months down the road. (We have historical data going back to 2008. Check out our interactive graphing tool here.)
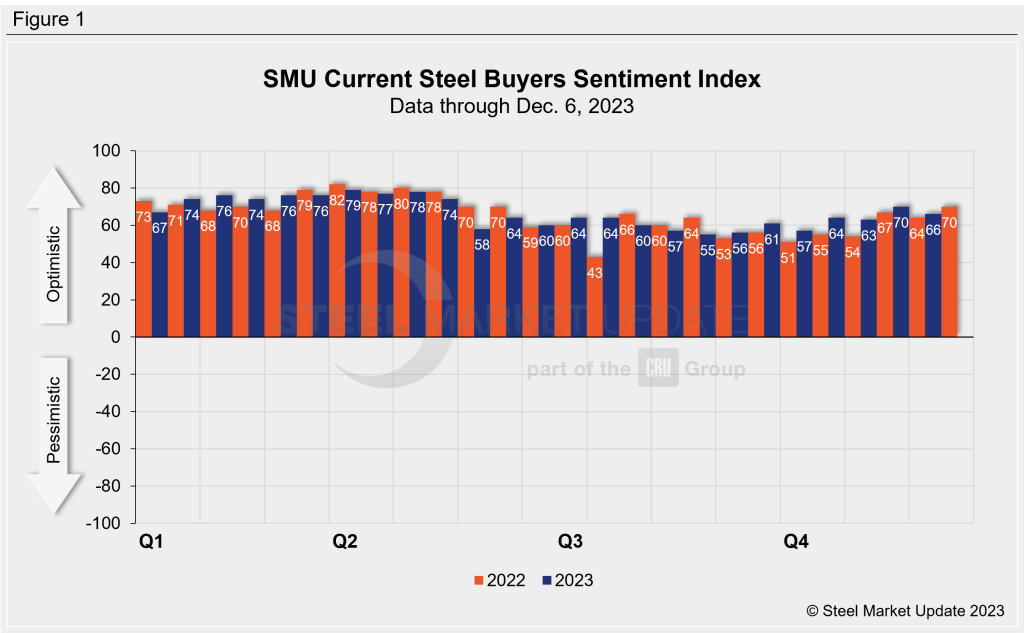
SMU’s Current Buyers Sentiment Index stood at +66 this past week, off four points from +70 two weeks prior (Figure 1). However, except for the previous market check, this week’s reading is still above any other recorded since the beginning of May.
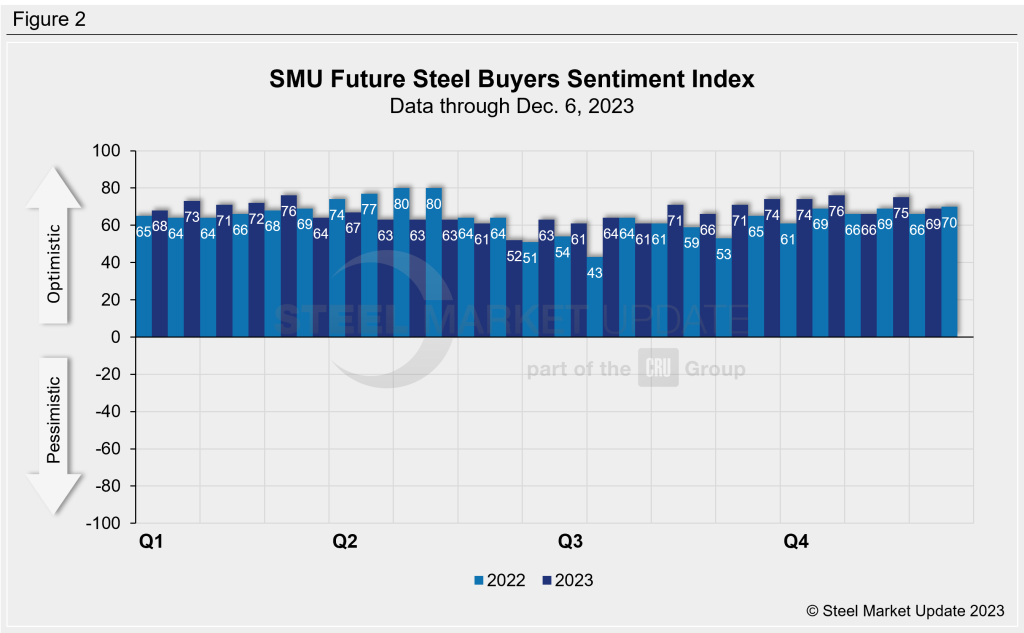
SMU’s Future Buyers Sentiment Index measures buyers’ feelings about business conditions three to six months in the future. This week, the index dropped six points from two weeks earlier to +69 (Figure 2).
Our next market check is the last of the year, so we’ll see if either current or future sentiment will crack +70 to end 2023.
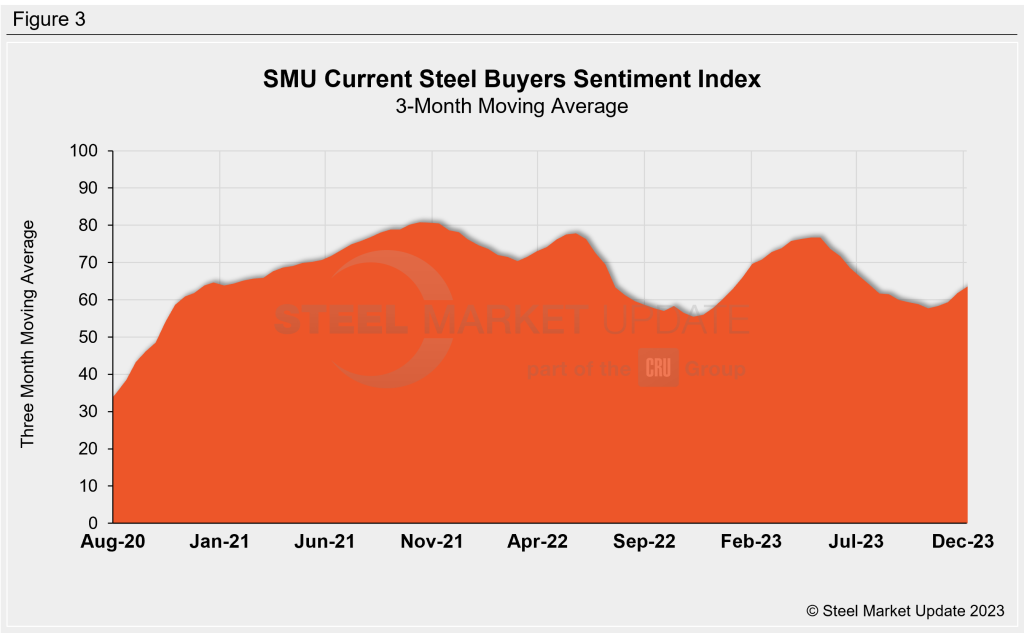
Measured as a three-month moving average, the Current Sentiment 3MMA rose to +63.50 from +61.83 two weeks earlier. (Figure 3).
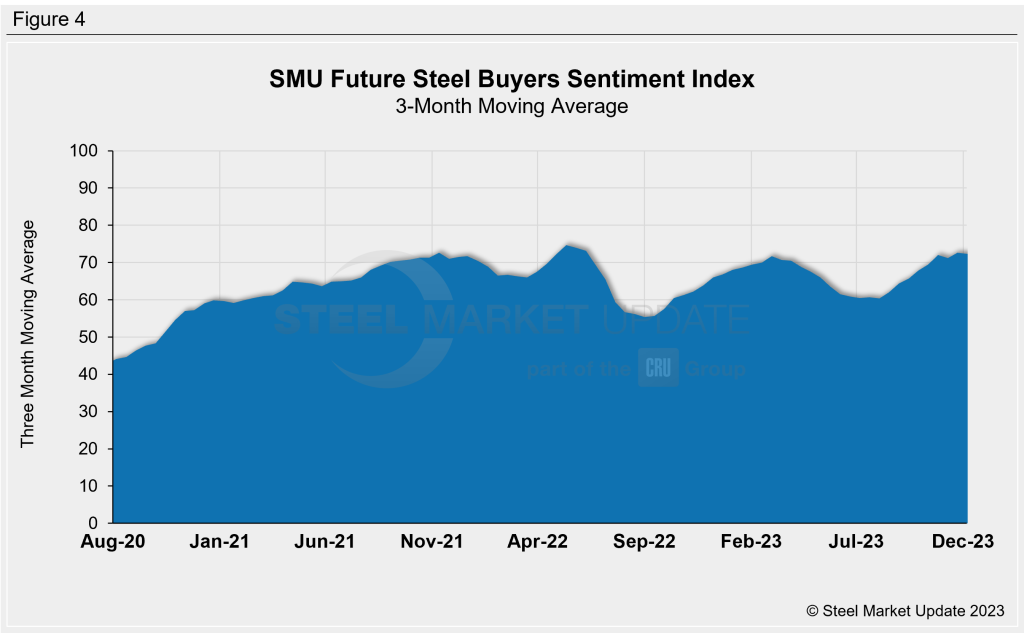
Last week’s Future Sentiment 3MMA edged down slightly to +72.33 from +72.67 at the previous market check (Figure 4).
What SMU respondents had to say:
“Who isn’t (successful) in a rising market?”
“Buyers have been encouraged to place orders ahead of increases announced in the middle of this month.”
“Price has been going up, but demand hasn’t improved.”
“Automotive is expected to be big in January and contract buying is robust.”
“We consider it a good year.”
About the SMU Steel Buyers Sentiment Index
The SMU Steel Buyers Sentiment Index measures the attitude of buyers and sellers of flat-rolled steel products in North America. It is a proprietary product developed by Steel Market Update for the North American steel industry. Tracking steel buyers’ sentiment is helpful in predicting their future behavior.
Positive readings run from +10 to +100. A positive reading means the meter on the right-hand side of our home page will fall in the green area indicating optimistic sentiment. Negative readings run from -10 to -100. They result in the meter on our homepage trending into the red, indicating pessimistic sentiment. A reading of “0” (+/- 10) indicates a neutral sentiment (or slightly optimistic or pessimistic), which is most likely an indicator of a shift occurring in the marketplace. Sentiment is measured via SMU surveys twice per month. If you would like to participate in our survey, please contact us at info@steelmarketupdate.com.