

Prices
February 1, 2024
HRC futures: A flock of canaries in the mine
Written by David Feldstein
Much has happened since we last met on Jan. 4. Cleveland-Cliffs announced a price increase on Jan. 3, lifting the futures market in the morning only for it to finish the day $20-$30 per short ton (st) below those morning highs.
On Jan. 4, the futures curve was down another $10-$28/st. And in my column for SMU that evening, I asked a question: Would those aggressive sellers be met with a short-squeeze forcing them to cover, or had the market peaked with the negative price action to start the year the proverbial canary in the coal mine?
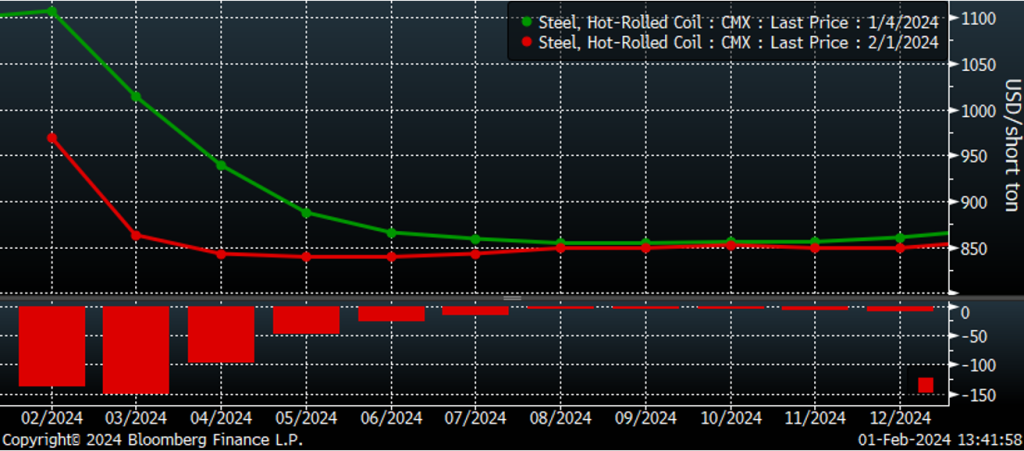
Since Jan. 4, what has felt like a flock of canaries has flown out of said proverbial mine, flattening the previously steeply backwardated futures curve to the tune of $138/st in the February future and $151/st in the March future.
CME HRC futures curve $/st
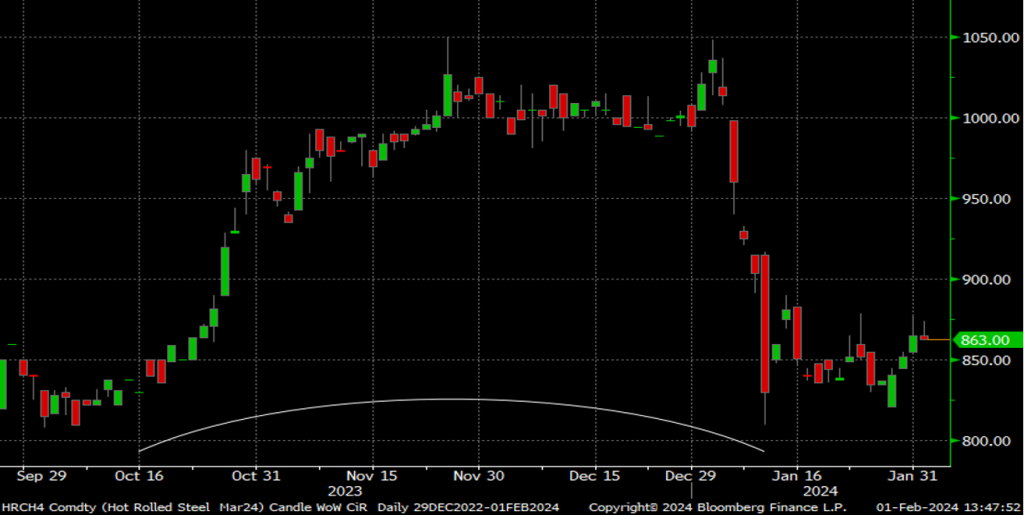
In fact, it only took four more trading days after Jan. 4 for the March future to complete its 59-day round trip from $830/st on Oct. 16 to a closing high of $1,036/st on Jan. 3 and then back to $830/s on January 10. Since then, the March future has remained stuck in a range between $820-$890/st, with each attempt at a rally failing thus far.
March CME HRC future $/st
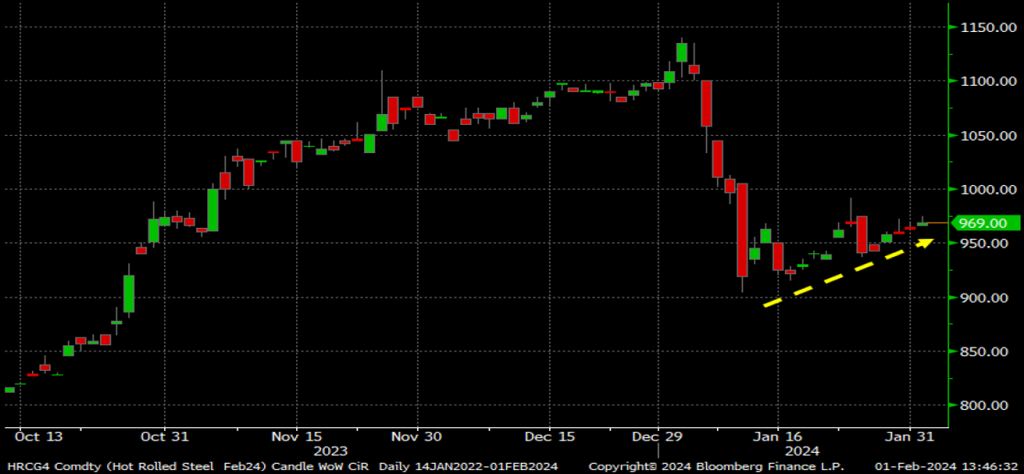
With respect to the February future, after falling from an intraday high of $1,140/st on Jan. 3 to an intraday low of $904/st on Jan. 10, it has slowly trended higher as the CRU has remained above $1,050/st.
What will the month of February bring for the Midwest HRC CRU monitor that dictates the settlement price of the CME Midwest HRC futures? The February future is indicating a number of sharp decreases in the weeks ahead. But if February’s first print sees little change WoW, expect the February future to quickly move higher. However, if the futures prove to have accurately priced the short-term, watch for a number of significant drops in the CRU.
February CME HRC future $/st
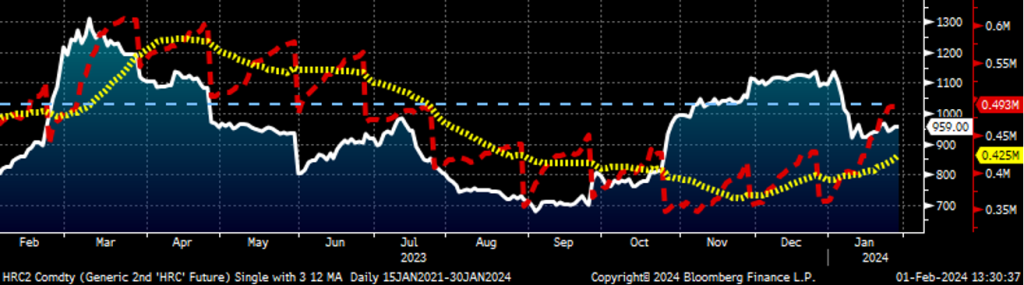
This chart stops on Tuesday, Jan. 30, to highlight January’s solid increase in open interest (the number of outstanding futures contracts, or tons in this case, across the HRC futures curve). Open interest climbed to 64,820/st MoM in January to 492,740/st. This was the highest open interest has been since last June.
Increasing open interest in a market seeing price declines is considered to be a technically strong bear market. The logic is the increasing open interests are new short positions being established. However, for every seller of a future, there is a buyer with some of those commercial players locking in fixed prices steeply discounted to the current spot price. Writing this last sentence reminds me of the day a wise steel veteran warned me of the pitfalls of applying logic to forecasting HRC prices.
Rolling second-month CME HRC future $/st and open interest (red) (22-day M.A. ylw)
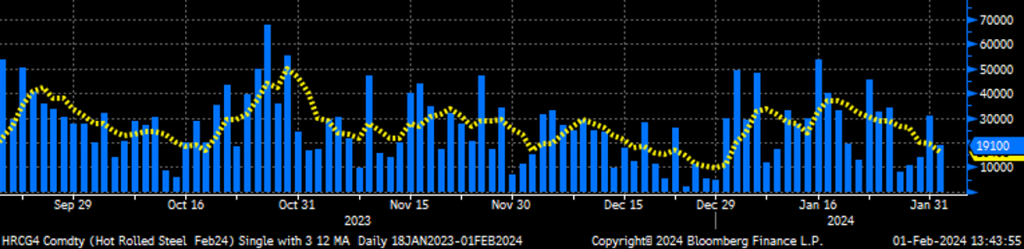
On the volume front, the first half of January saw a solid increase in daily trading volume. It has been followed since by a number of quiet days that pulled down the moving five-day average. Is this the calm before the storm? Is another sizeable move in HRC futures just around the corner, or will we see HRC futures stuck in a range in the weeks and months ahead?
February CME HRC future $/st w aggregate curve volume and five-day avg.
This is Midwest HRC – and if it ain’t going up, it’s going down! “He may run like Mays,” but he forecasts like…whoa, whoa! Well, I will again refer back to my Jan. 4 article highlighting the last sentence: “One thing that is certain is that 2024 is going to be another wild ride, so buckle your chinstrap and get those feet choppin!!”
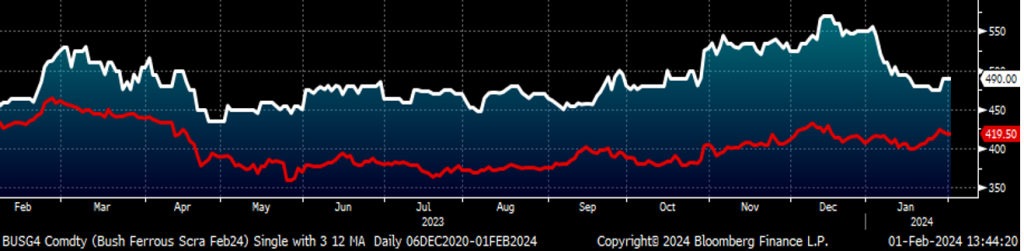
Looking forward, February’s scrap settlement will kick-off next week with preliminary settles out at the end of next week and the future expiring the Monday after the Super Bowl. So far this year, the February busheling future has followed Midwest HRC lower, falling from a high of $555 per gross ton (gt) on Jan. 4 to as low as $475/gt on Jan. 29. The spread between the February busheling and Turkish scrap future narrowed to as little as $51/gt on Monday before the February future adjusted higher to $490/gt. Similar to the February HR future, the busheling future signaled it went a little too far, too fast.
February CME busheling future $/lt rolling and LME Turkish scrap future $/mt
Disclaimer: The content of this article is for informational purposes only. The views in this article do not represent financial services or advice. Any opinion expressed by Mr. Feldstein should not be treated as a specific inducement to make a particular investment or follow a particular strategy, but only as an expression of his opinion. Views and forecasts expressed are as of date indicated, are subject to change without notice, may not come to be and do not represent a recommendation or offer of any particular security, strategy or investment. Strategies mentioned may not be suitable for you. You must make an independent decision regarding investments or strategies mentioned in this article. It is recommended you consider your own particular circumstances and seek the advice from a financial professional before taking action in financial markets.


