

Analysis
February 21, 2024
North American auto assemblies recover in January
Written by David Schollaert
North American auto assemblies recovered in January after a usual seasonal slowdown at year-end, according to LMC Automotive data. The result was driven by improved production across the region vs. December’s output.
Assembly recovery and continued improvements in supply during the second half of 2023 have pushed retail inventory levels in January to roughly 1.6 million units. The result is a 3.3% increase vs. the prior month, and a 38.1% boost year on year (y/y).
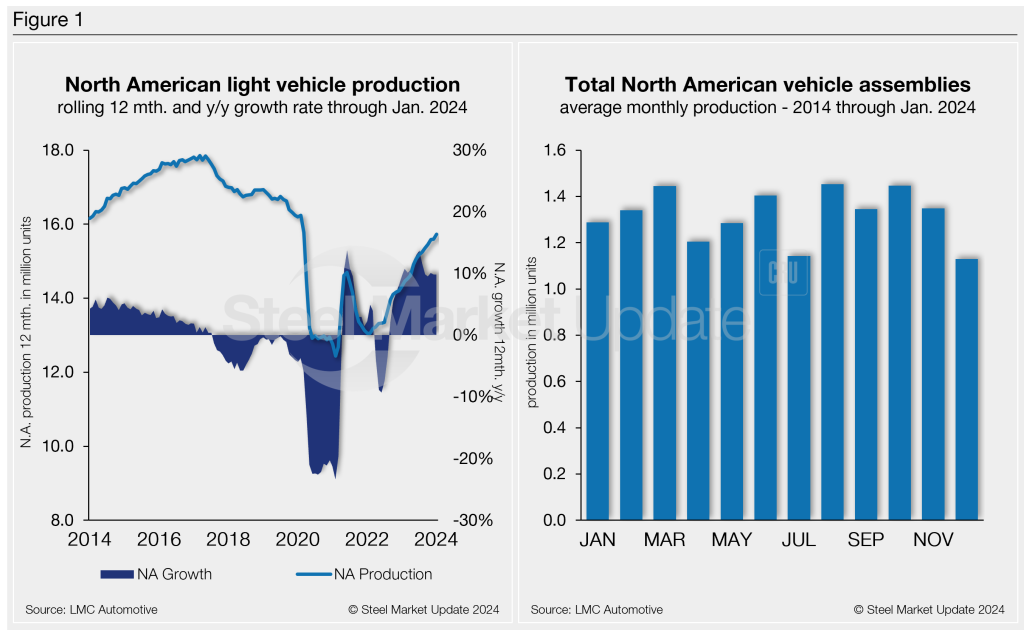
North American vehicle production, including personal and commercial vehicles, totaled 1.3 million units in January, a 24.2% gain from 1.05 million units in December. That’s also nearly 11% ahead of the 1.18 million produced one year ago.
Below in Figure 1 is North American light-vehicle production since 2014 on a rolling 12-month basis with a y/y growth rate. Also included is the average monthly production, which includes seasonality since 2014.
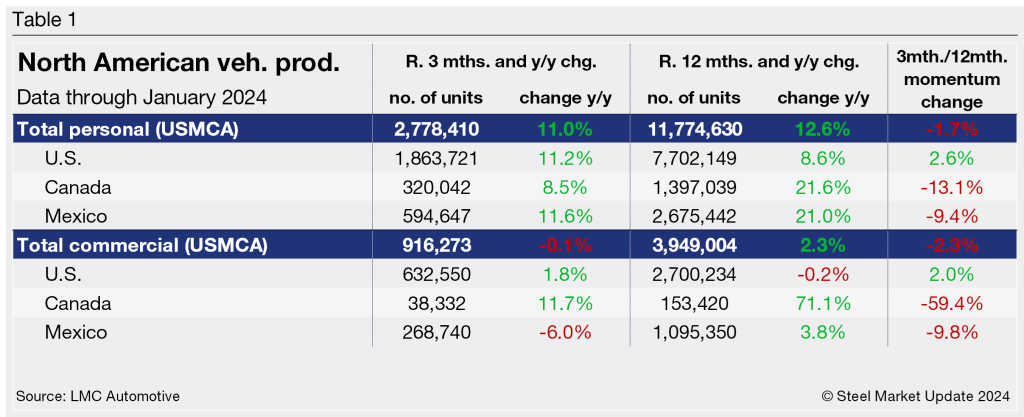
A short-term snapshot of assembly by nation and vehicle type is shown in the table below. It breaks down total North American personal and commercial vehicle production into US, Canadian, and Mexican components. It also includes the three- and 12-month growth rates for each and their momentum change.
For the three months and 12 months through January, the growth rate for total personal and commercial vehicle assemblies in the USMCA region is up by double-digits. The momentum change, however, remains slightly behind.
Personal vehicle production
The longer-term picture of personal vehicle production across North America is shown below. The charts in Figure 2 show the total personal vehicle production for North America and the total for the US, Canada, and Mexico.
In terms of personal vehicle production, the region saw a 25% month-on-month (m/m) boost in January, after declining by 22% the month prior. The result was also a 14% gain vs. the period one year ago.
The US saw the largest increase in units produced while Mexico’s percentage gain led the way in January vs. December. The US was up 104,784 units (+18.8%), followed by Mexico, up 71,646 units (+49.2%), while Canada produced 22,461 more units (+26.6%) m/m.
Production share across the region was largely unchanged. The US saw personal vehicle production share of the North American market edge up marginally to 67.1%. Both Mexico and Canada saw its share slip to 21.4% and 11.5%, respectively.
Commercial vehicle production
Total commercial vehicle production for North America and the total for each nation within the region are shown in the first chart in Figure 3 on a rolling three-month basis. Commercial vehicle production in the US and Mexico and their y/y growth rates, as well as the production share for each nation in North America, are also shown.
North American commercial vehicle production was up 21% in January with a total of 319,495 units produced during the month, an increase of 55,564 units m/m. The gain was driven by the US, which saw a 23.9% boost in commercial vehicle assemblies in January, producing 43,737 more vehicles m/m.
Canada produced 11,486 light commercial vehicles last month, a 5.2% increase from December’s 10,921 total units. January marked Canada’s 27th straight month of commercial vehicle assemblies after ceasing production for nearly two years from Jan. 2020 through Oct. 2021.
Mexico also reported a double-digit production growth in January vs. December, up 16.1% and producing 11,262 more vehicles over the same period.
The overall increase put the commercial production growth rate just 1.8% for the region last month, a strong reversal from a -8.9% rate in December.
The market share across the region was largely unchanged. The US was up 3.1 percentage points, with a total share of 69%, followed by Mexico with a 26.8% share, and Canada with at 4.2% share in May.
Presently, Mexico exports just under 80% of its light-vehicle production, with the US and Canada as the highest-volume destinations.
Editor’s Note: This report is based on data from LMC Automotive for automotive assemblies in the US, Canada, and Mexico. The breakdown of assemblies is “Personal” (cars for personal use) and “Commercial” (light vehicles with less than 6.0 metric tons gross vehicle weight rating; heavy trucks and buses are not included).


