SMU Data and Models
![](https://www.steelmarketupdate.com/wp-content/uploads/sites/2/images/Newsletter_Images_2016/Jun_2016/cosco_shipping.jpg)
February imports ease from seven-month high
Written by Brett Linton
March 28, 2024
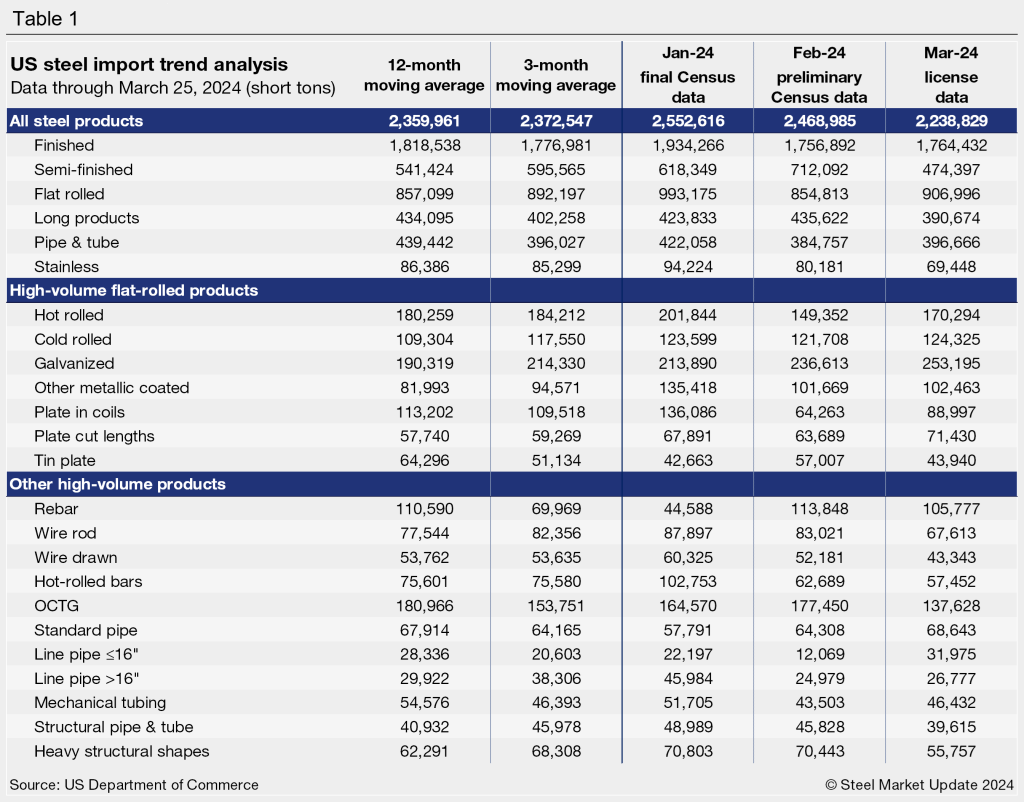
After reaching a seven-month high in January, steel imports fell back 3% in February, according to preliminary Census data released earlier this week. Though down month on month (m/m), February imports were strong compared to levels seen over the past few months, with the second-highest rate recorded since June 2023.
The US Commerce Department’s preliminary count shows 2.47 million short tons (st) of steel products entered the country last month. February levels were down from 2.55 million st in the first month of the year, but up from 2.10 million st in December 2023.
March import licenses through March 25 totaled 2.24 million st, down 9% from February. (Note that license data is still being collected so March levels could fluctuate from here).
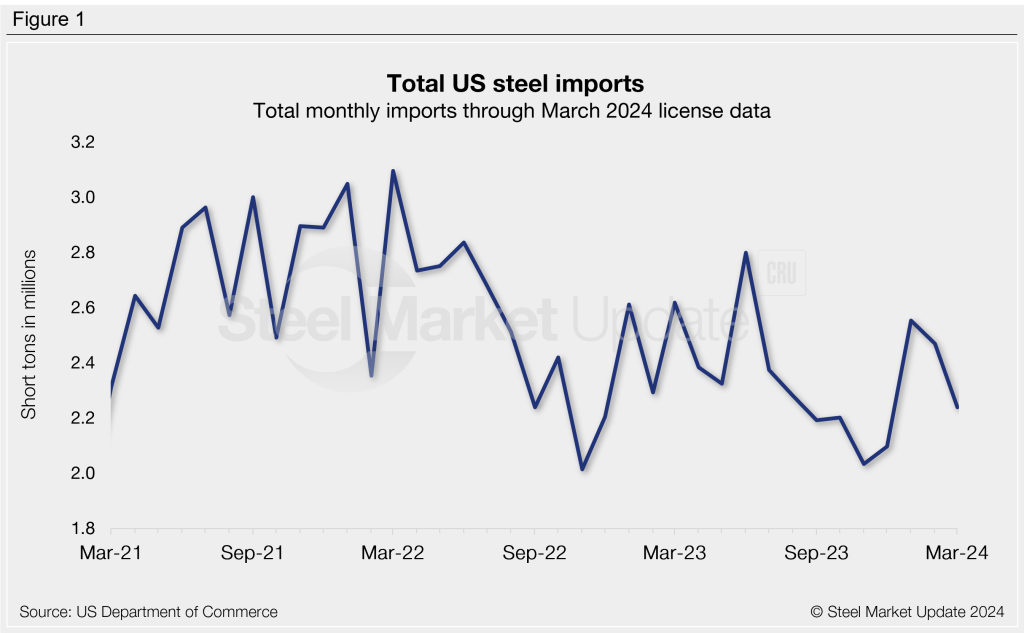
![](https://www.steelmarketupdate.com/wp-content/uploads/sites/2/2024/03/imports-f1-3.28.24-1024x633.png)
Imports as a 3MMA
Looking at imports on a three-month moving average (3MMA) basis can smooth out the variability in monthly readings. On a 3MMA basis, imports through preliminary February data rose to a six-month high of 2.37 million st.
March’s 3MMA through the 25th of the month was 2.42 million st. Figure 2 shows the strong rally after imports slowed in the latter part of 2023.
![](https://www.steelmarketupdate.com/wp-content/uploads/sites/2/2024/03/imports-f2-3.28.24-1024x633.png)
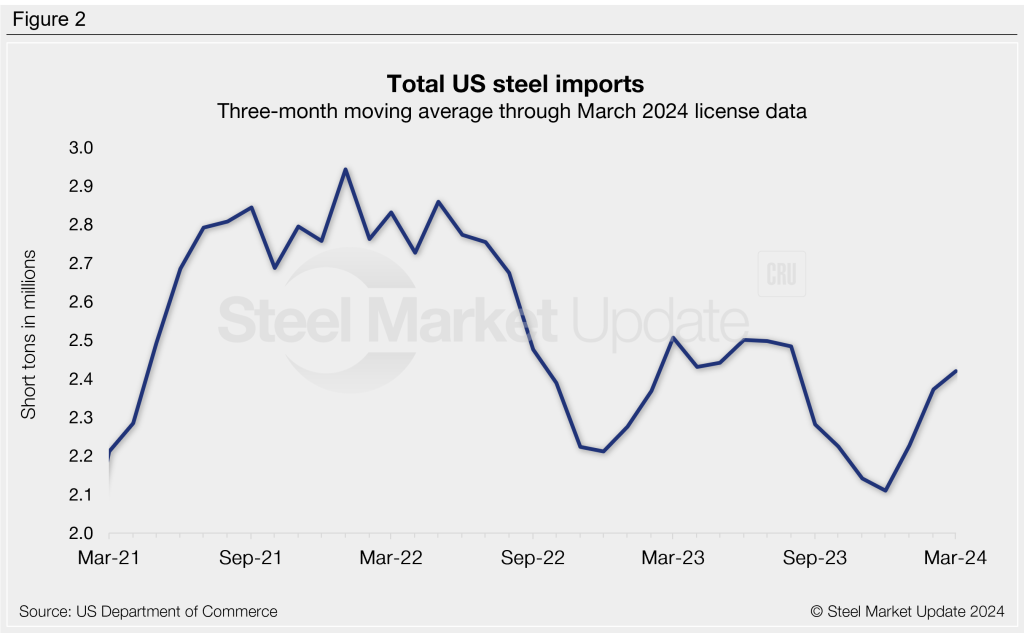
Semi-finished and finished steel
Recall imports of semi-finished steel had rallied 36% higher from December to January. Levels carried higher into February, jumping another 15% to 712,092 st. March licenses currently report 474,397 st of semi-finished material coming into the country, potentially down 33% from February levels.
Meanwhile, finished steel imports eased 9% in February to 1.76 million st. Finished imports had risen 18% m/m in January. The latest March tally is at 1.76 million st, in line with February figures.
The American Iron and Steel Institute (AISI) estimated the finished steel import market share to be 21% in February, down from 22% in January.
![](https://www.steelmarketupdate.com/wp-content/uploads/sites/2/2024/03/imports-f3-3.28.24-1024x633.png)
Flat-rolled steel
After falling to a seven-month low in November, flat-rolled steel imports jumped in December and again in January to reach a 17-month high of 993,175 st. Imports slipped 14% m/m into February to 854,813 st but are still in line with levels seen over the last year and a half. March licenses are currently up 6% m/m to 906,996 st.
![](https://www.steelmarketupdate.com/wp-content/uploads/sites/2/2024/03/imports-f4-3.28.24-1024x633.png)
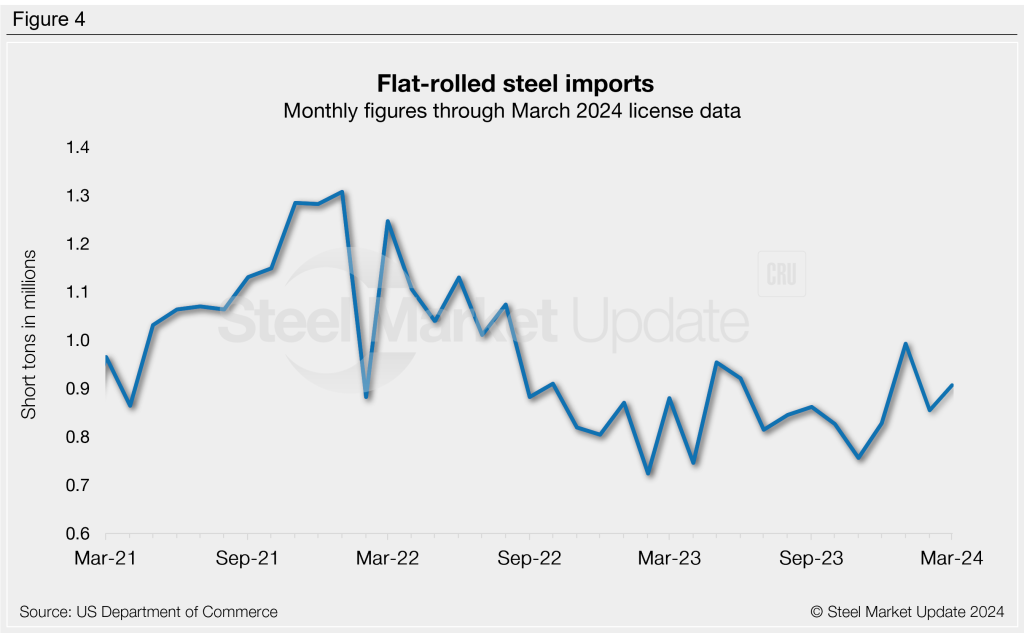
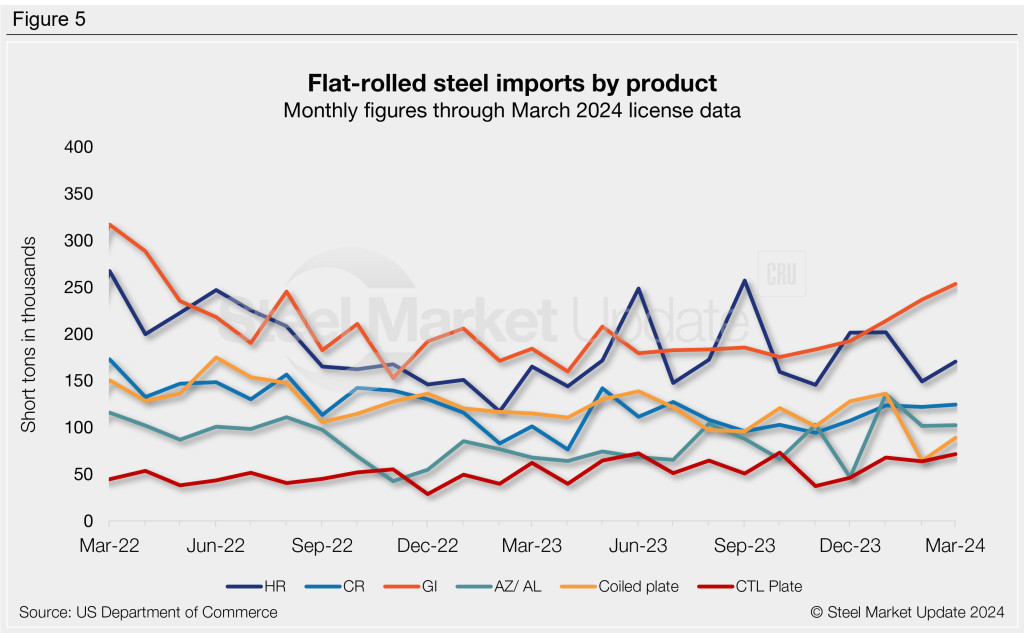
Figure 5 shows flat rolled imports of popular products. Most products declined from January to February, aside from galvanized (+11%). The largest monthly drop was seen in plate in coils (-53%), followed by hot-rolled coils (-26%) and other metallic coated (-25%). March licenses show a rebound across the board, with notable recoveries in plate in coils (+38%), hot rolled (+14%), and plate cut lengths (+12%).
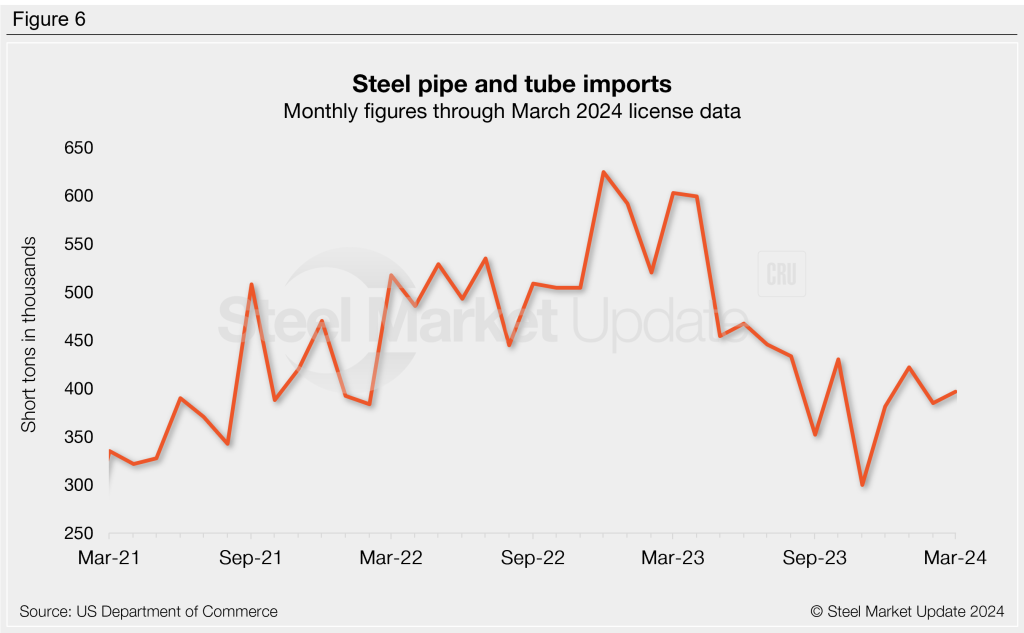
![](https://www.steelmarketupdate.com/wp-content/uploads/sites/2/2024/03/imports-f5-3.28.24-1024x633.png)
Pipe & tube
February’s preliminary count of pipe and tube imports eased 9% m/m to 422,058 st. March levels are at 396,666 st through the latest license data, up 3% m/m. Pipe and tube imports have been substantially lower over the last few months compared to years prior.
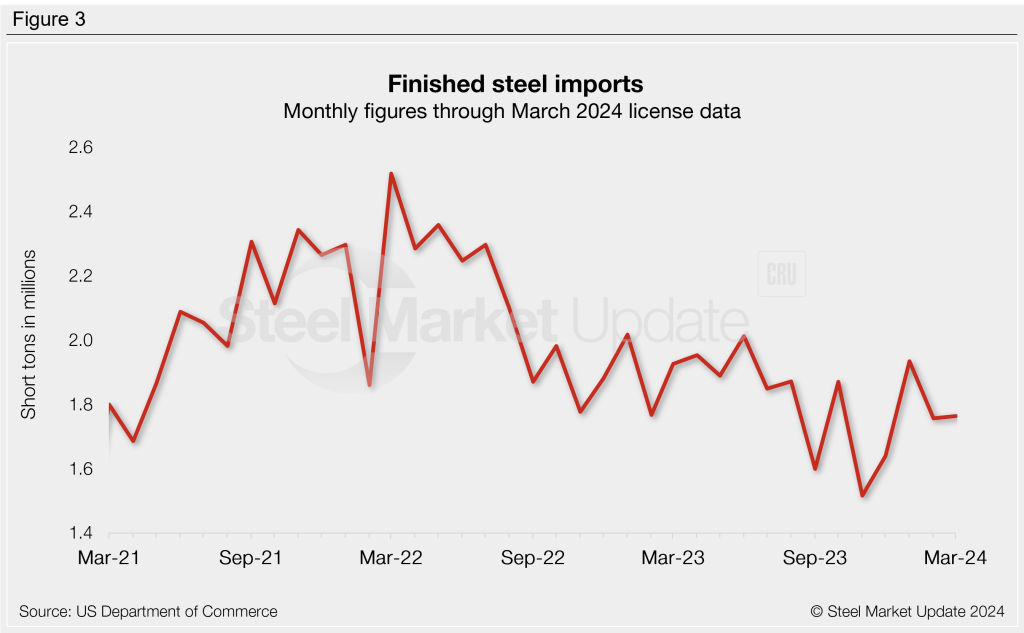
![](https://www.steelmarketupdate.com/wp-content/uploads/sites/2/2024/03/imports-f6-3.28.24-1024x633.png)
Imports by product
The chart below provides further detail into imports by product, highlighting high-volume steel products.
![](https://www.steelmarketupdate.com/wp-content/uploads/sites/2/2024/03/imports-t1-3.28.24-1024x802.png)
![](https://www.steelmarketupdate.com/wp-content/uploads/sites/2/2024/04/SMU_BL_headshot-V4-150x150.png)
Brett Linton
Read more from Brett LintonLatest in SMU Data and Models
![](https://www.steelmarketupdate.com/wp-content/uploads/sites/2/images/Featured_News_Icons/Premium1.png)
Steelmaking raw material prices ease in July
The majority of steelmaking raw material prices declined in June, following the same trend seen in May, according to SMU’s latest analysis.
![](https://www.steelmarketupdate.com/wp-content/uploads/sites/2/2024/01/cropped-SMU_Mobile_final.png)
SMU price ranges: HR declines moderate. Are we near a bottom?
SMU’s sheet price ranges slid again this week. But the declines were more pronounced on tandem products whereas prices for hot-rolled coil held roughly steady.
![](https://www.steelmarketupdate.com/wp-content/uploads/sites/2/images/Featured_News_Icons/Premium1.png)
Some SMU Key Market Indicators improve, others remain near historic lows
SMU’s Key Market Indicators include data on the economy, raw materials, manufacturing, construction, and steel sheet and long products. They offer a snapshot of current sentiment and the near-term expected trajectory of the economy. All told, nine key indicators point lower, 16 are neutral, and 13 point higher. One thing worth noting: The nine indicators pointing lower are all lagging indicators. Many of those pointing upward are leading indicators.
![](https://www.steelmarketupdate.com/wp-content/uploads/sites/2/2024/01/cropped-SMU_Mobile_final.png)
SMU survey: Steel Buyers’ Sentiment Indices rebound
SMU’s Steel Buyers’ Sentiment Indices both saw improvement this week. Current sentiment ticked higher but remains near the four-year low seen earlier this month. Future Sentiment continues to indicate that buyers are optimistic for future business conditions.
![](https://www.steelmarketupdate.com/wp-content/uploads/sites/2/images/Featured_News_Icons/Premium1.png)
SMU market survey results now available
The latest SMU market survey results are now available on our website to all premium members. After logging in at steelmarketupdate.com, visit the pricing and analysis tab and look under the “survey results” section for “latest survey results.” Historical survey results are also available under that selection. If you need help accessing the survey results, or if your […]