Analysis
September 9, 2025
Steel imports tumbled further in July and August
Written by Brett Linton
US steel imports declined for the second consecutive month in July, according to recently finalized US Commerce Department data.
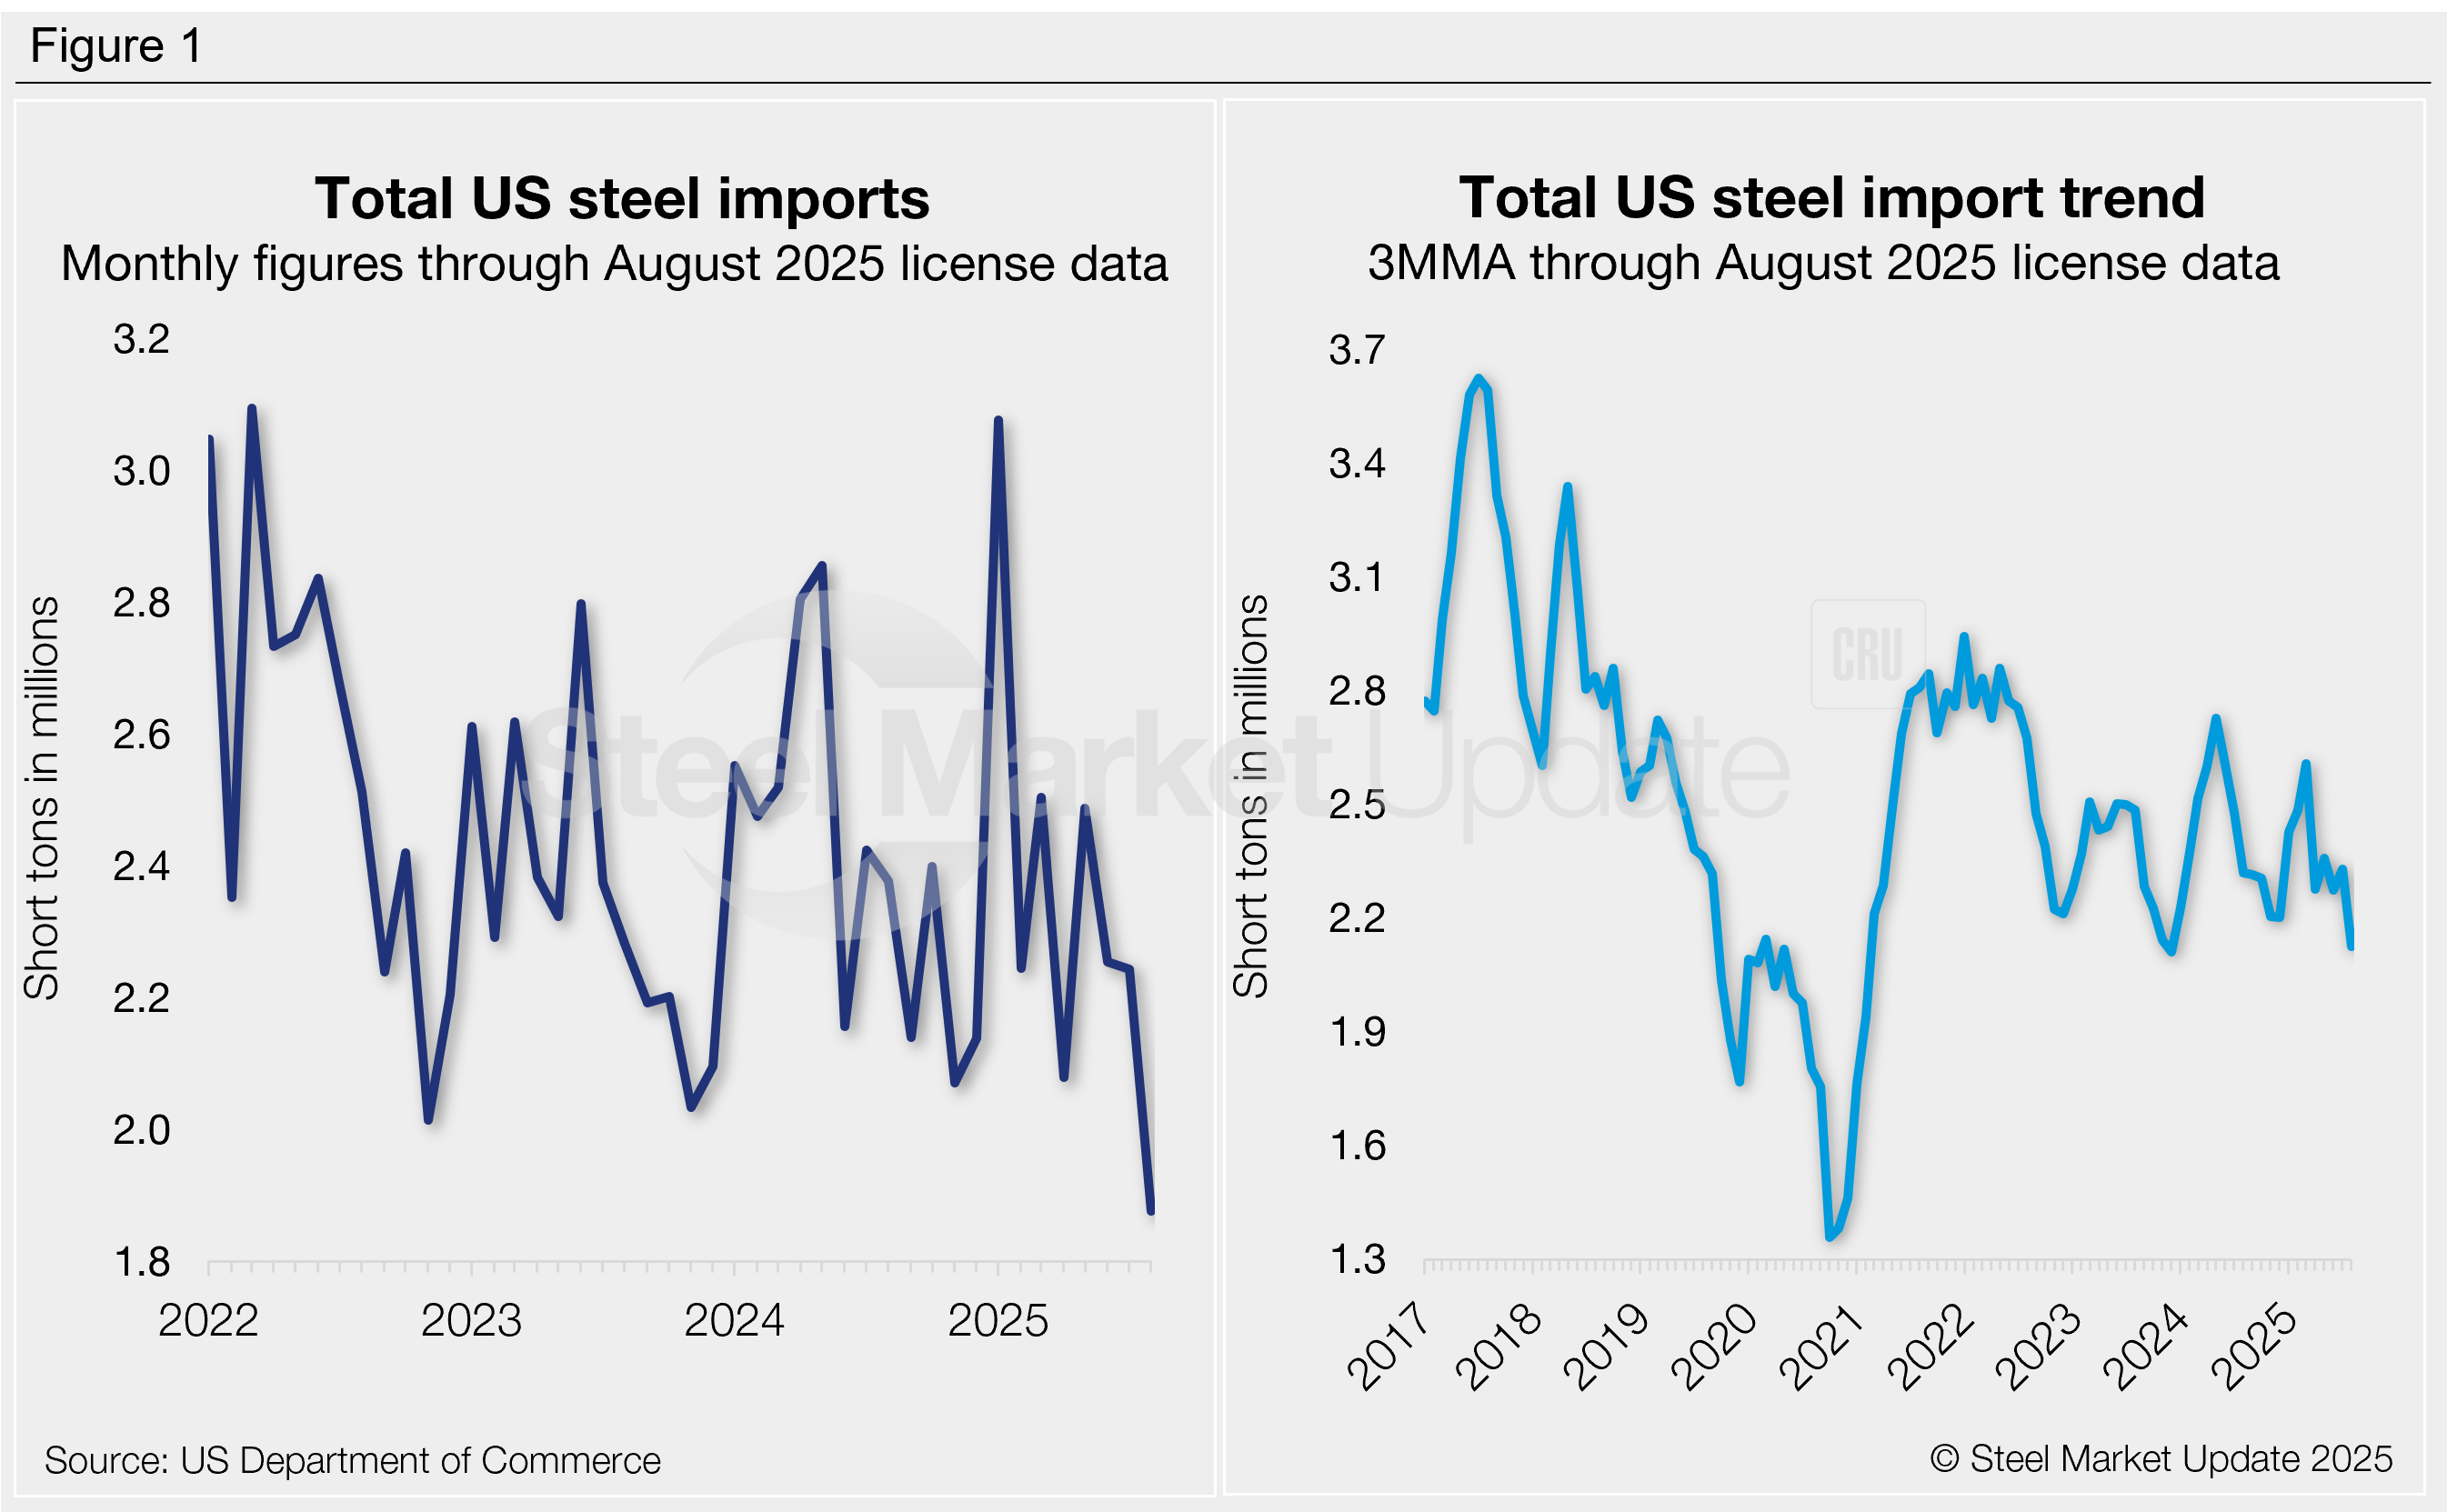
The total volume of steel products that entered the country in July eased to 2.24 million short tons (st), the second-lowest monthly rate recorded this year. Preliminary August license figures suggest imports fell 16% further to 1.88 million st, potentially the lowest rate seen since December 2020.
Recall that imports spiked to a two-and-a-half-year high of 3.08 million st in January. Import volumes have tapered off since then (Figure 1, left).
Two-thirds of the steel that entered the country in July came from just six countries: South Korea (15%), Brazil (13%), Canada (13%), Mexico (11%), Taiwan (6%), and Germany (5%). Other major suppliers included Japan, India, Egypt, the Netherlands, Australia, the United Arab Emirates, Romania, and Vietnam, each contributing 2-3% of the total. Combined, these 14 countries accounted for 82% of all July imports.
To explore steel import data by country, category, or specific product, visit the International Trade Administration’s Steel Import Monitor.
Import trends
To better highlight trends, import data can be analyzed as a three-month moving average (3MMA) to smooth out monthly variations (Figure 1, right). On this basis, 3MMA imports have trended lower following the 10-month high seen in March (2.61 million st). The 3MMA ticked up to 2.33 million st in July then slipped through preliminary August figures to a 20-month low of 2.12 million st. For comparison, imports averaged 2.41 million st per month in 2024 and 2.35 million st per month in 2023.
Imports by product
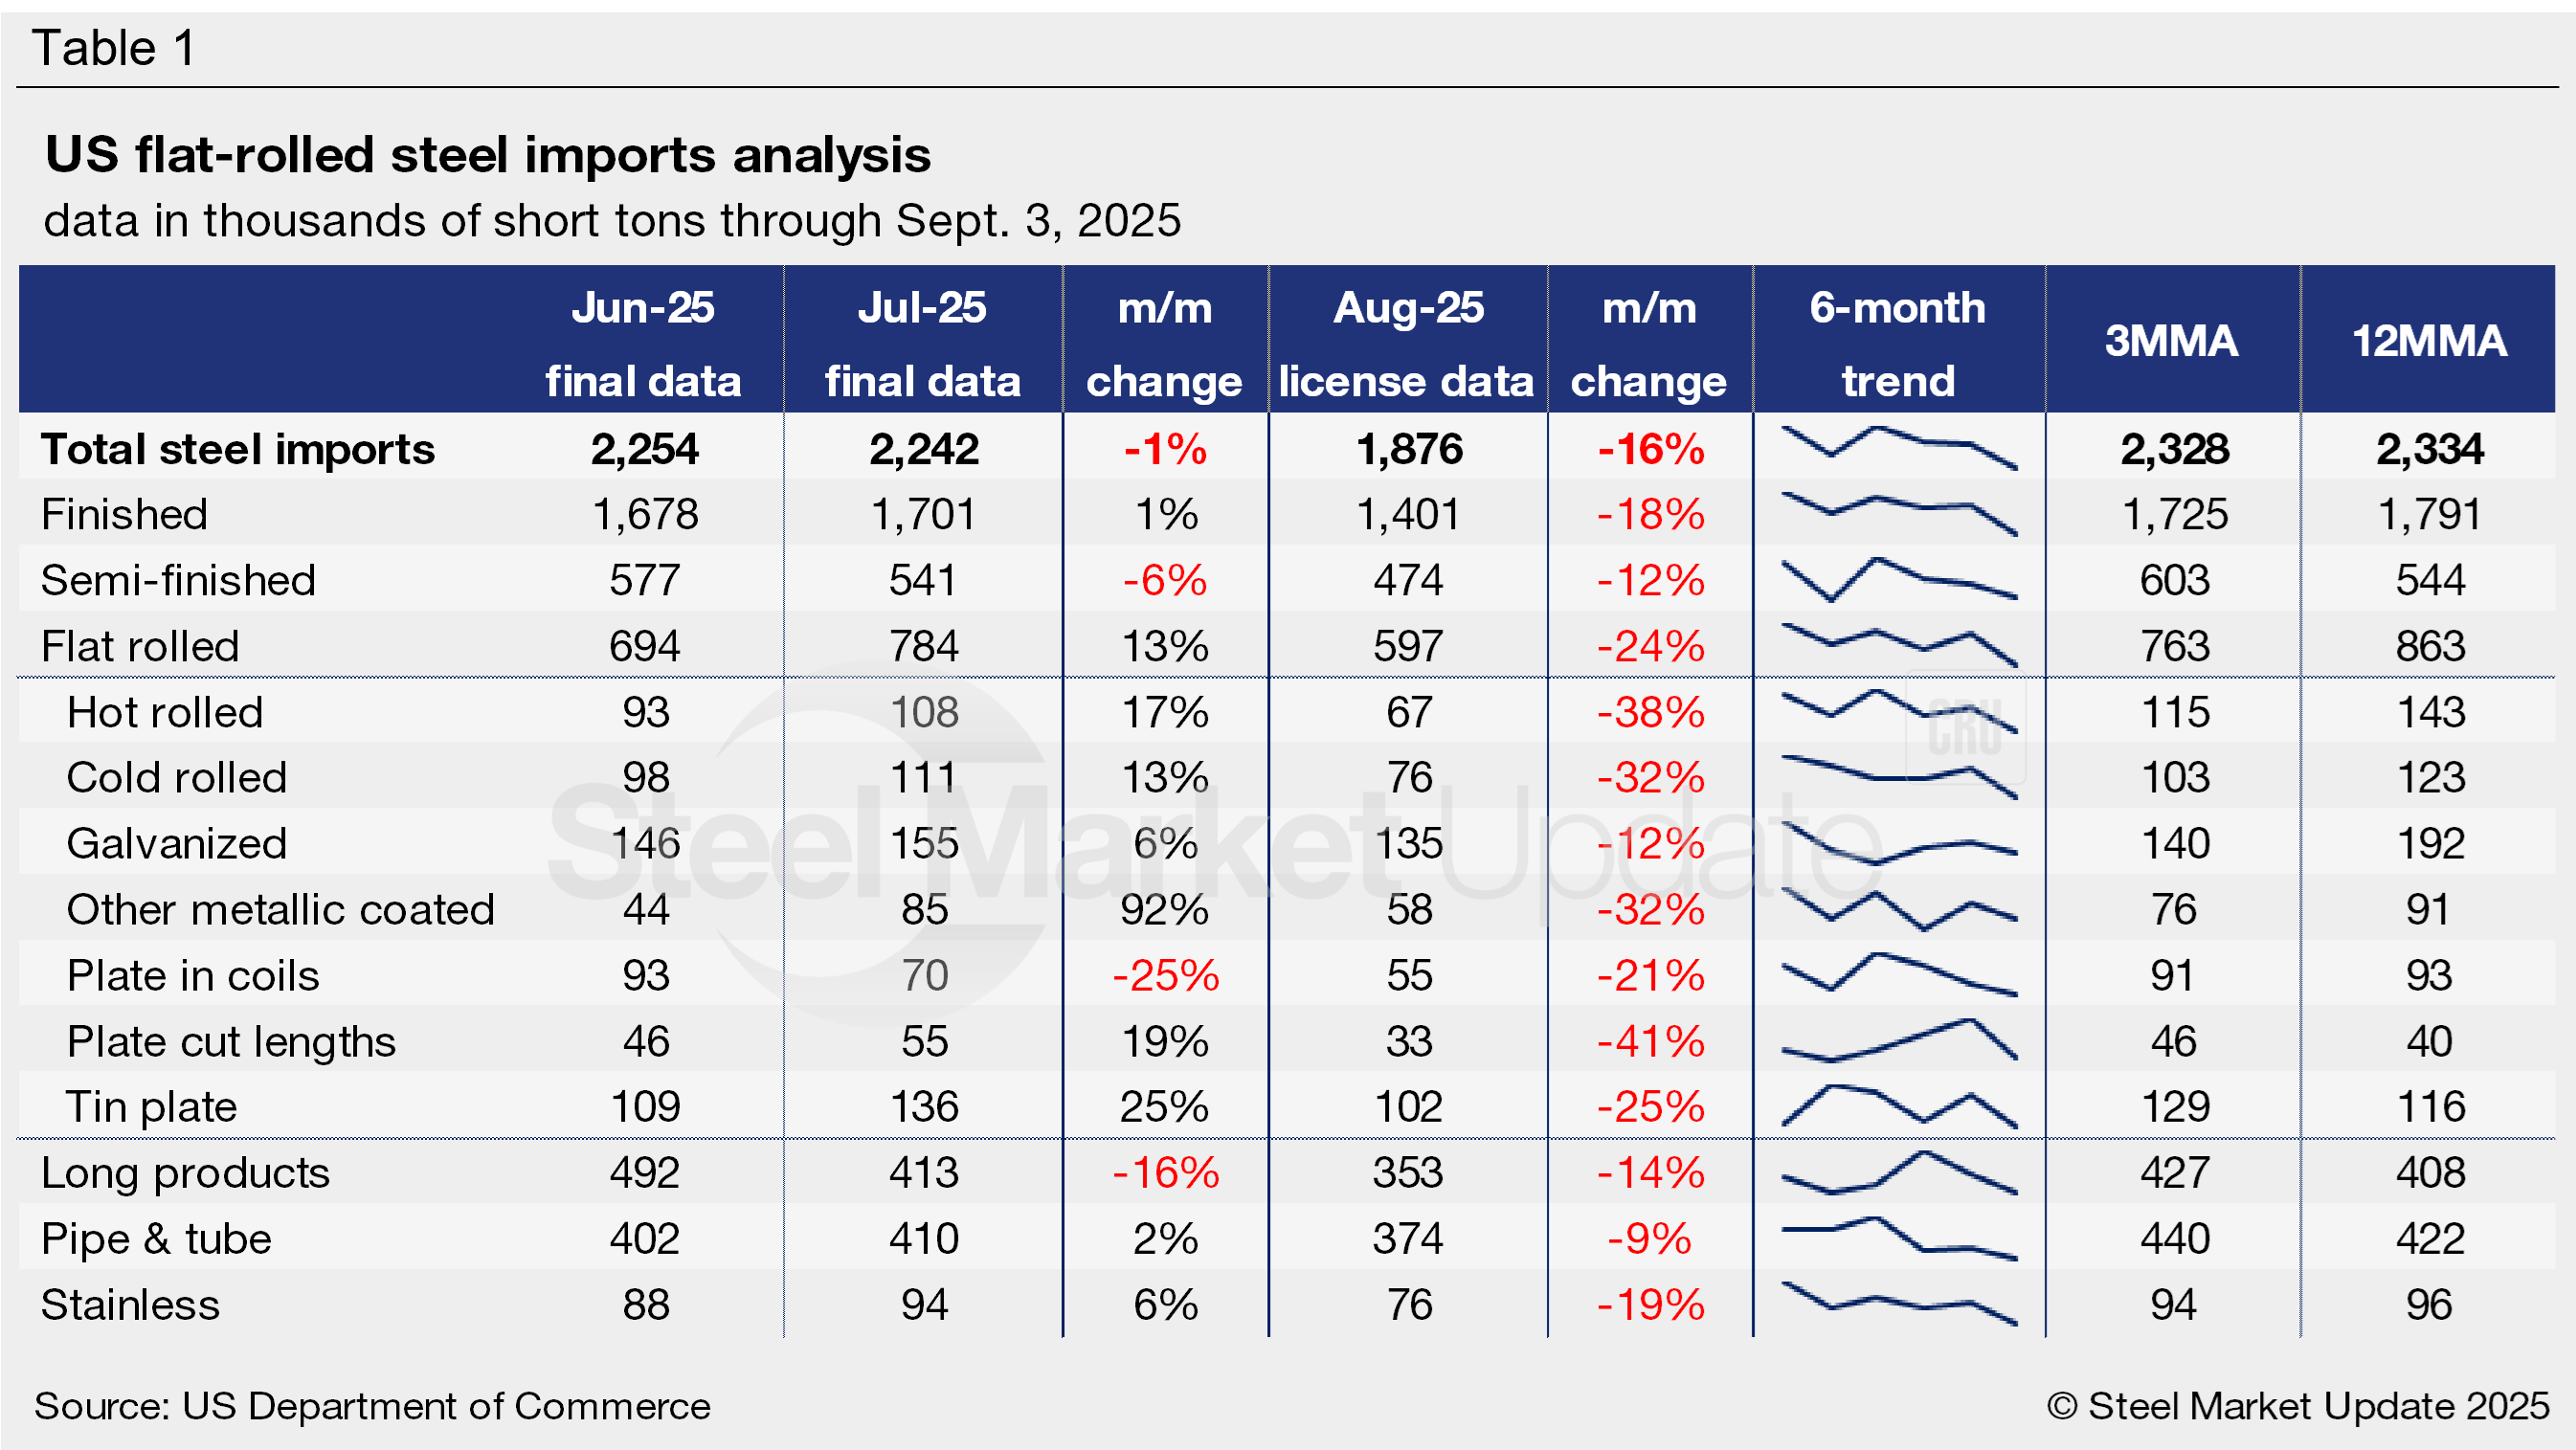
Table 1 highlights high-volume steel product imports (click to expand). Note that the 3MMA and 12MMA columns are calculated through final July data. For deeper analysis, visit our Steel Imports page.
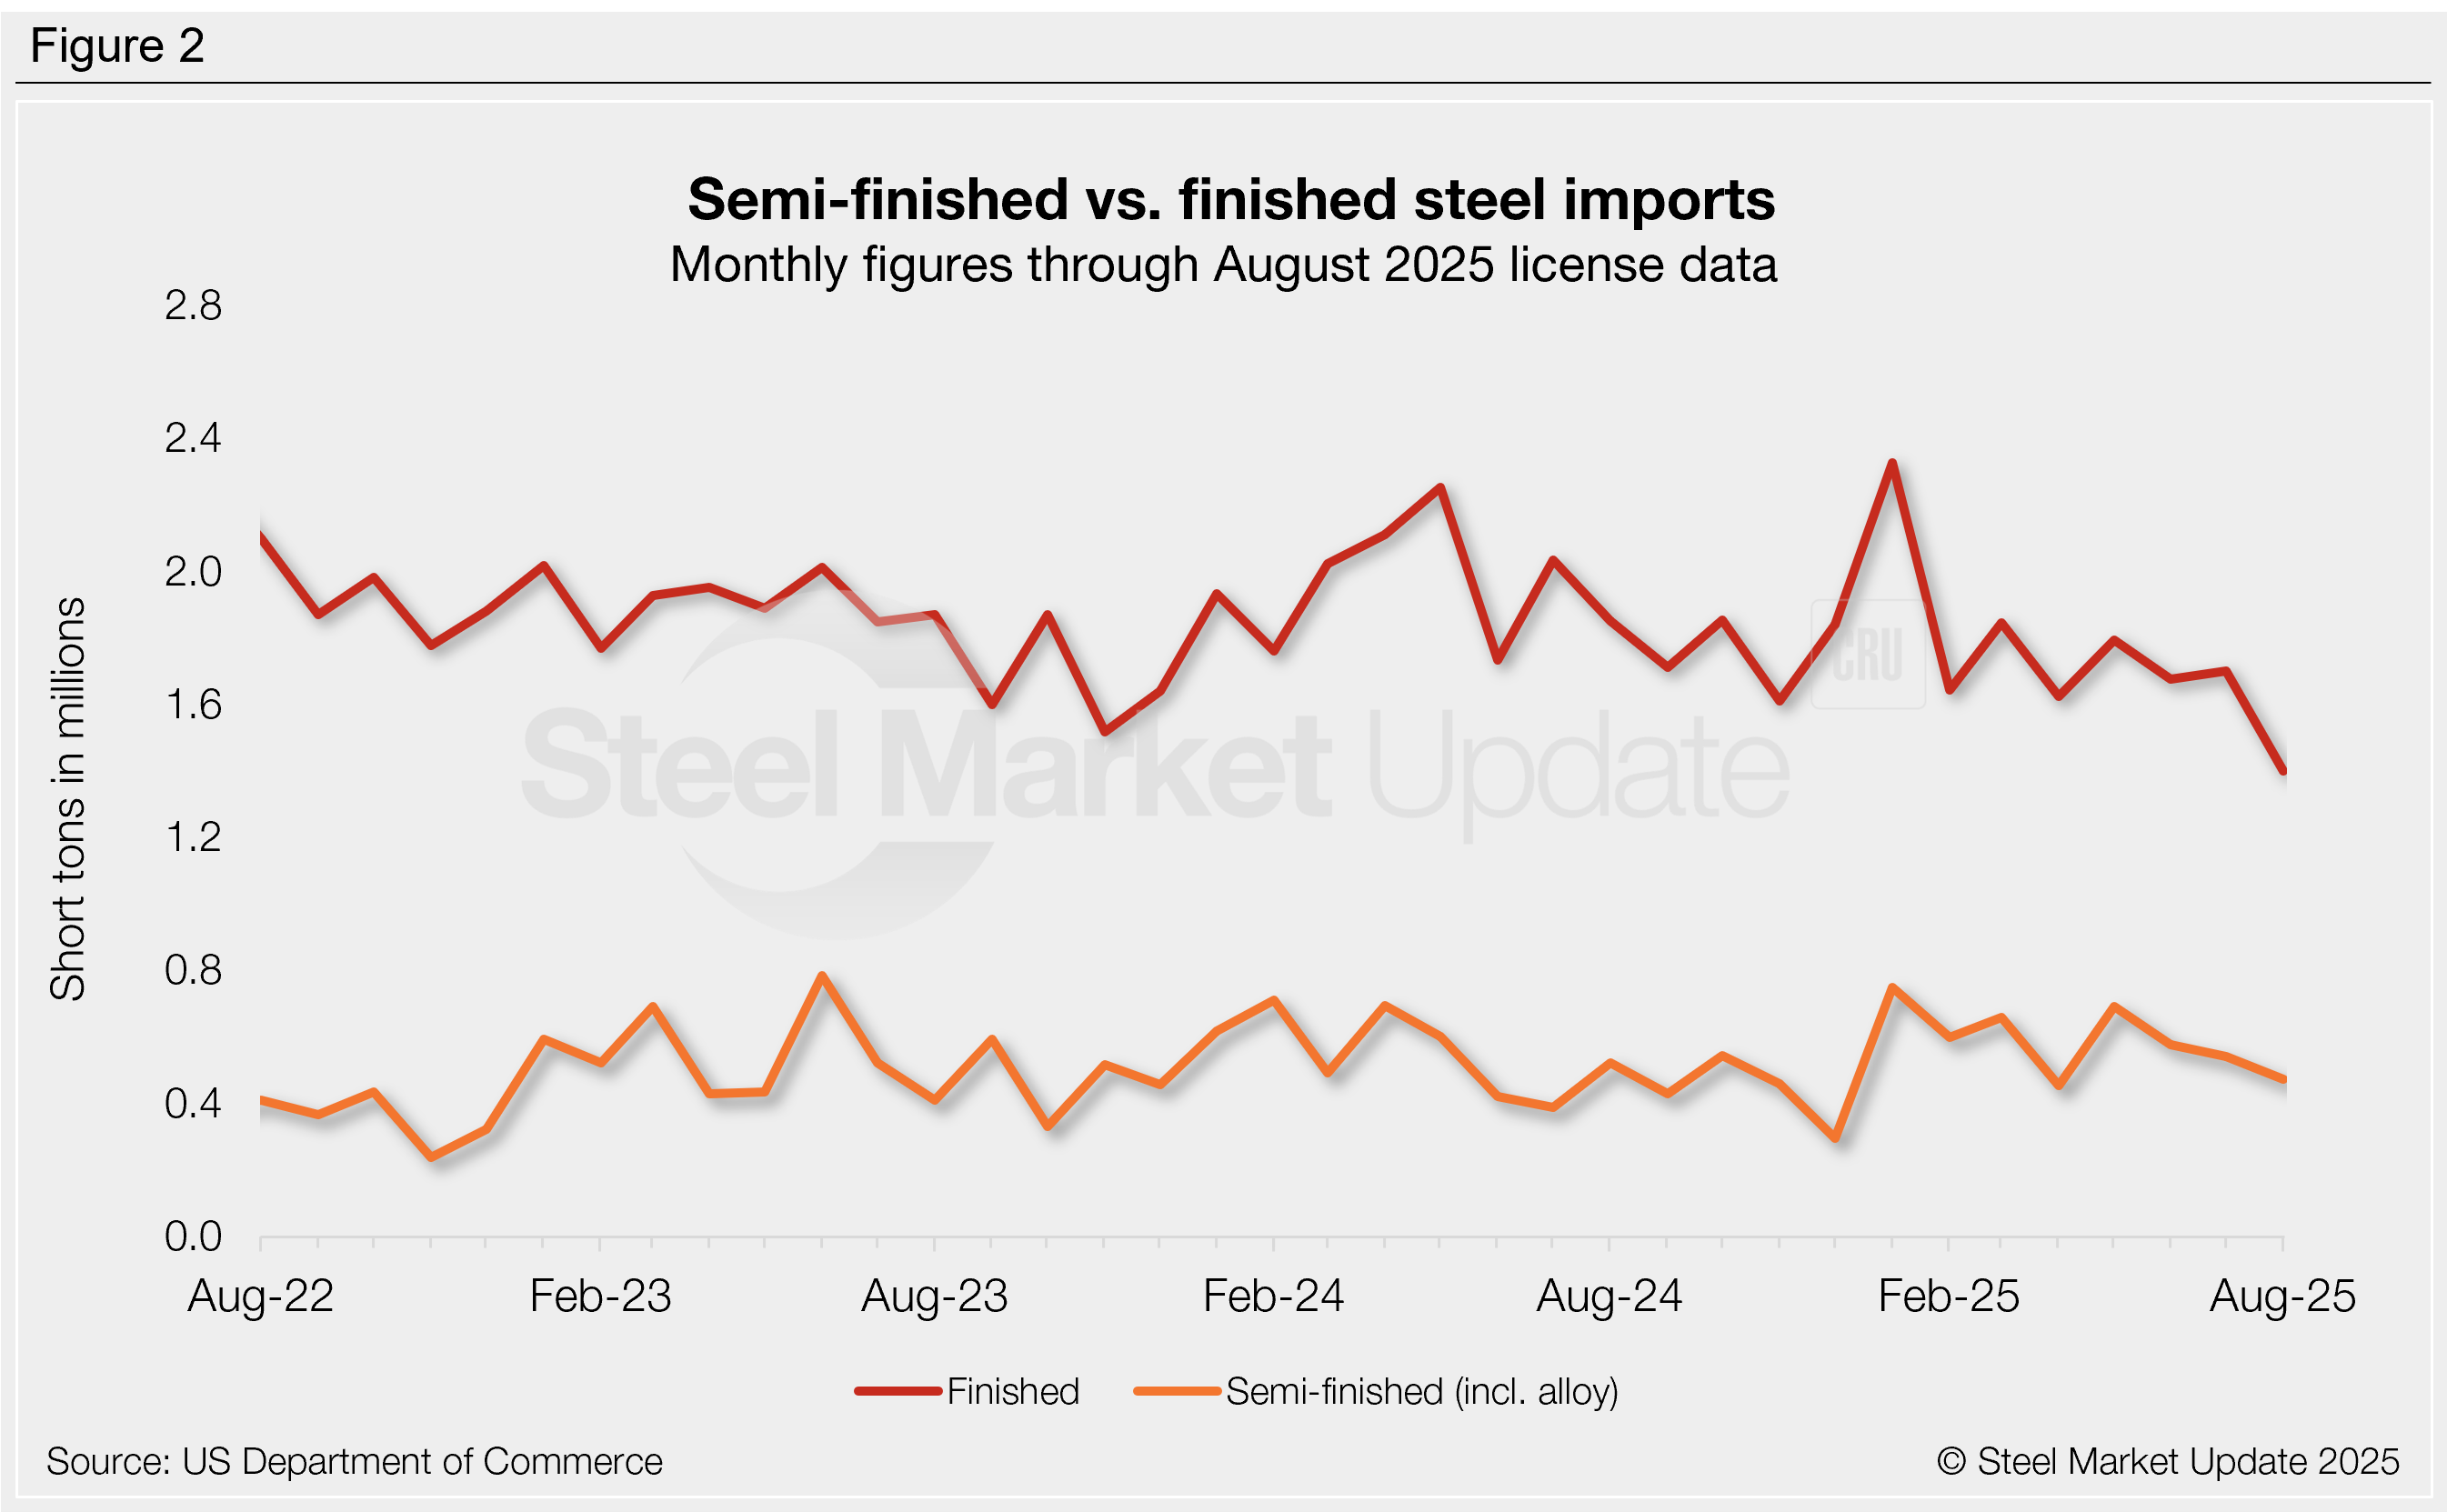
Finished vs. semi-finished imports
Total imports of finished steel products rose 1% m/m to 1.70 million st in July, accounting for 76% of monthly imports (Figure 2). August finished licenses are currently down 18% from July to 1.40 million st (75% of total imports), the lowest monthly rate since January 2021. Across the first eight months of 2025, finished imports have averaged 1.75 million st per month (75% of total imports), down from 1.96 million st per month (78%) across the same period of 2024.
Semi-finished imports (mostly slabs to be further processed by a mill) fell 6% m/m in July to 541,000 st. August licenses are currently down another 12% to 474,000 st, the lowest volume seen this year. For reference, semi-finished imports have averaged 593,000 st per month in 2025 to date, up from an average of 557,000 st in the first eight months of 2024.
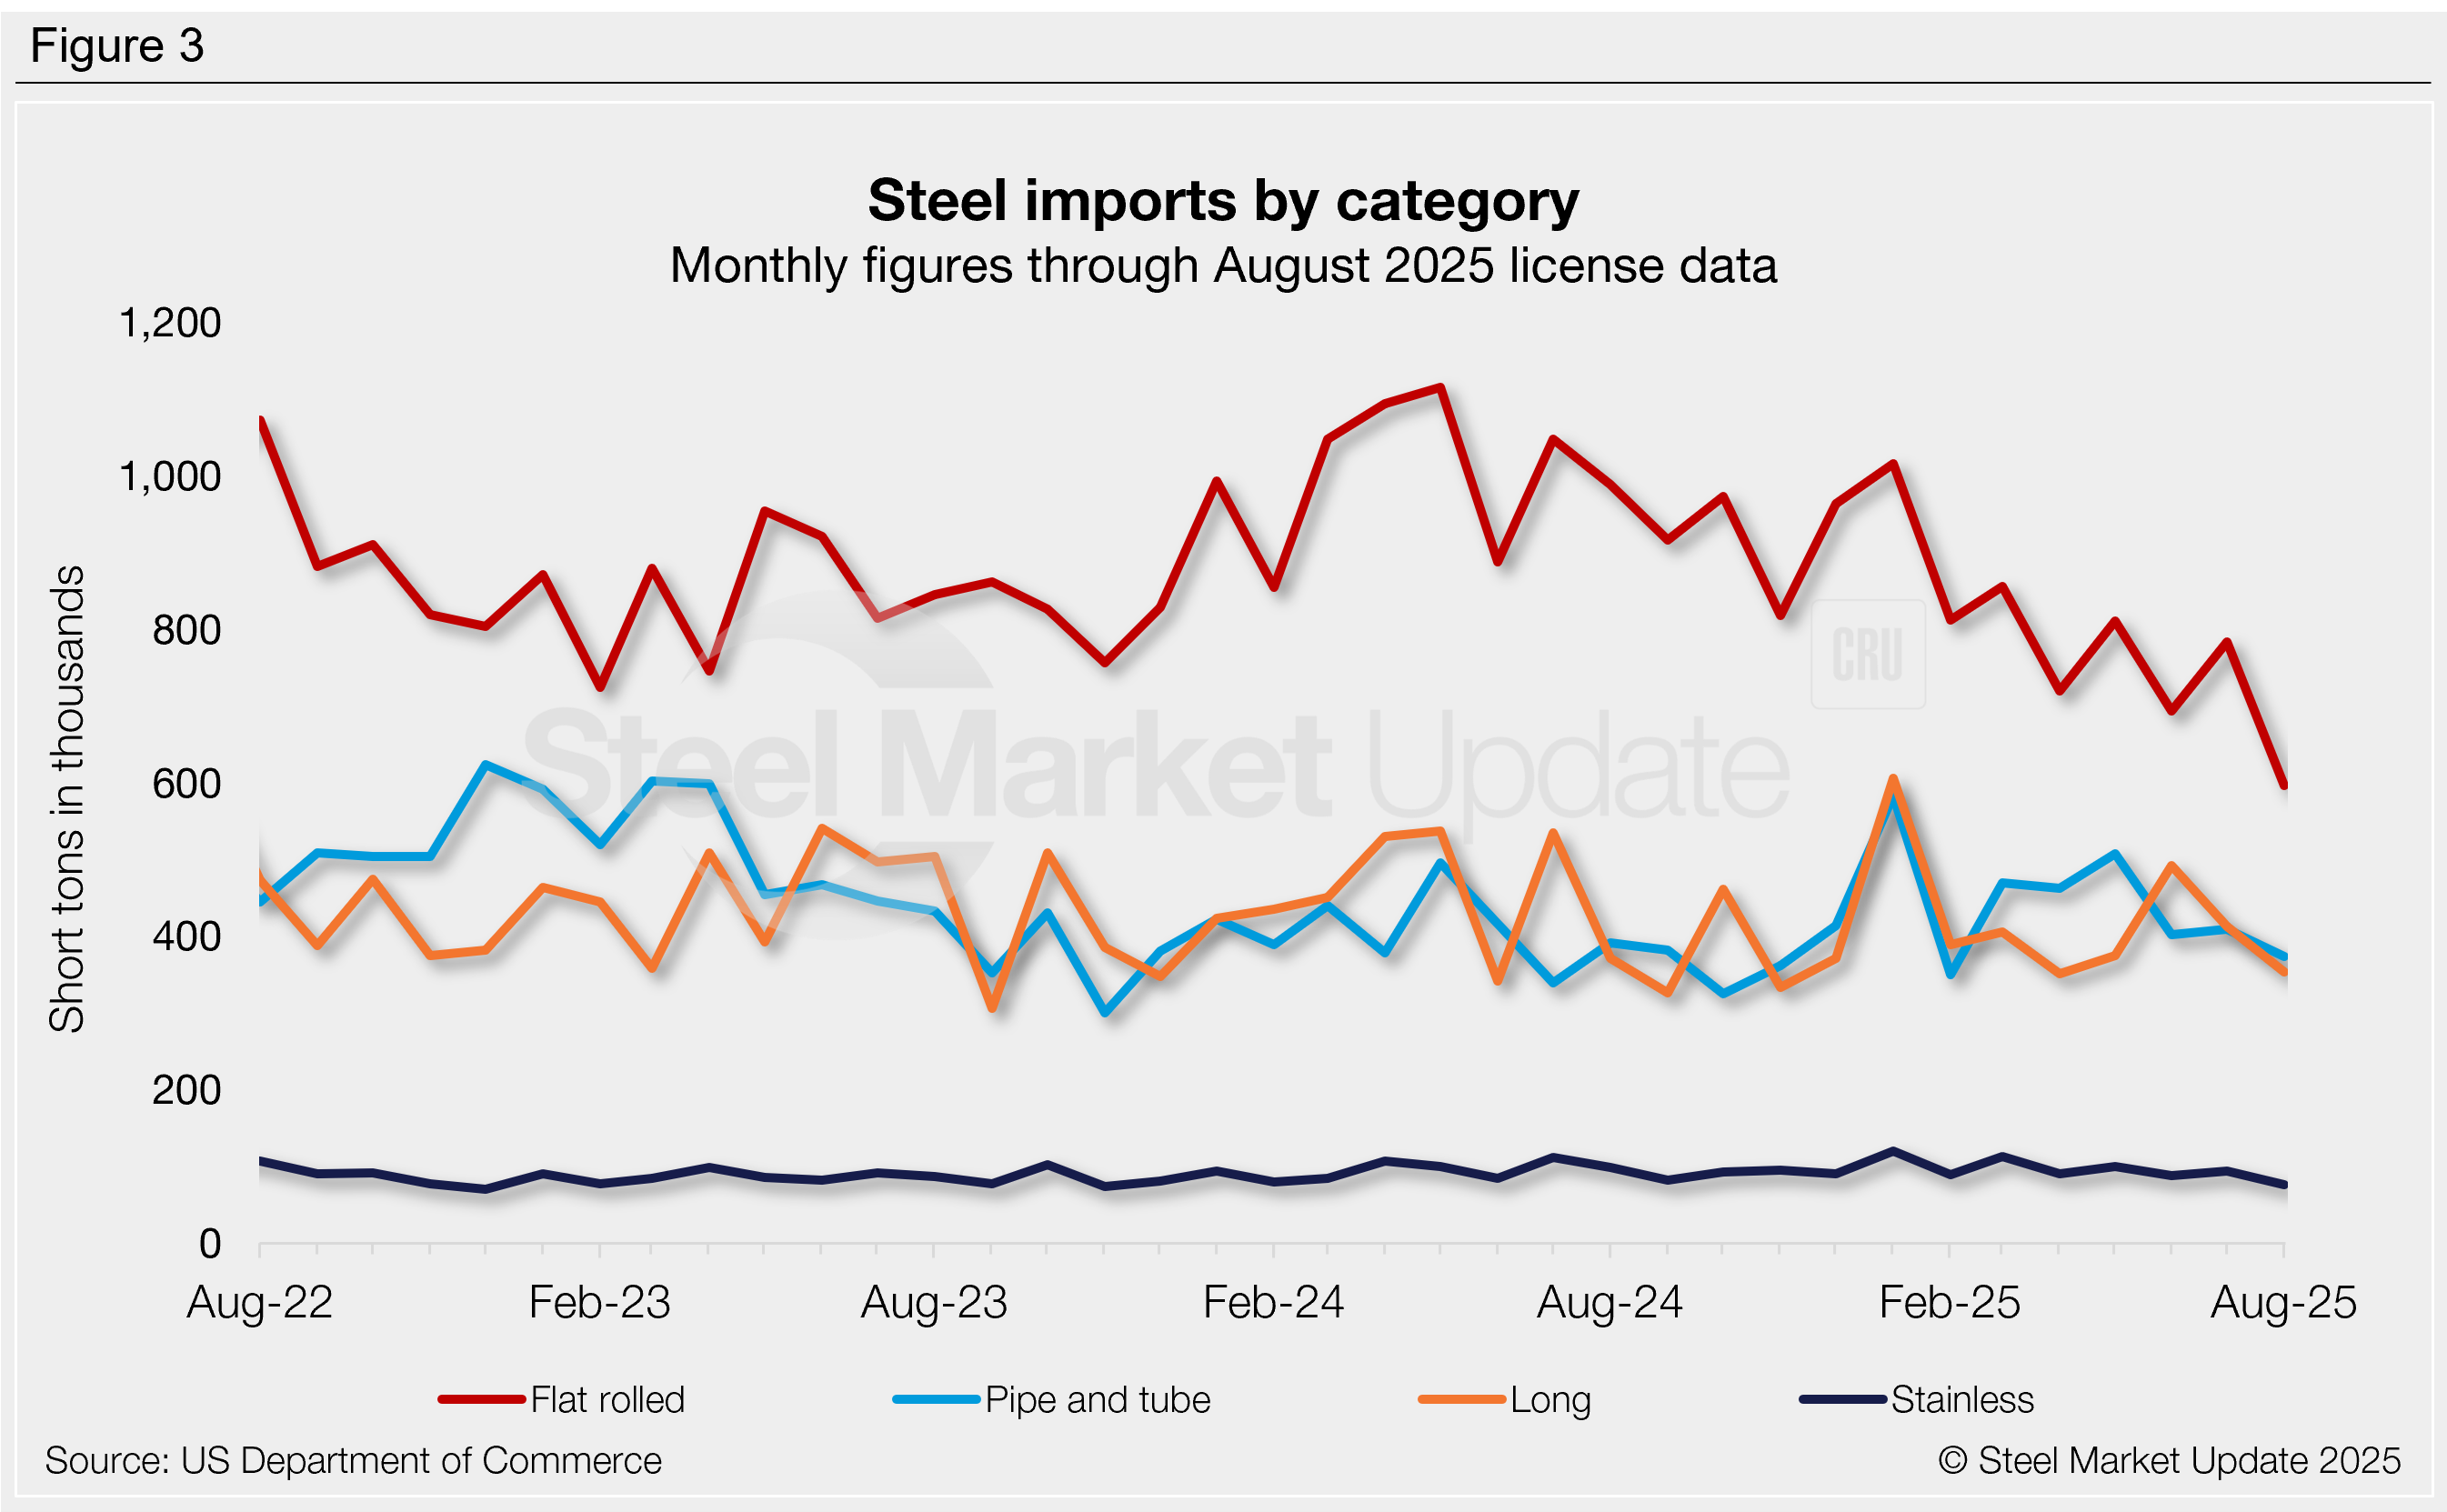
Imports by category
Figure 3 shows monthly imports by popular steel product categories. Notable shifts include:
- Flat-rolled imports rebounded 13% in July, previously at the lowest volume recorded since January 2021. August licenses are currently back down 24% to the lowest monthly rate in our six-year data history.
- Long products fell 16% in July and declined another 14% in August, potentially the lowest rate seen in nine months.
- Pipe and tube recovered 2% in July then slipped 9% in August to a six-month low.
- Stainless rose 6% in July following June’s nine-month low. August licenses are back down 19% to a potential 20-month low.
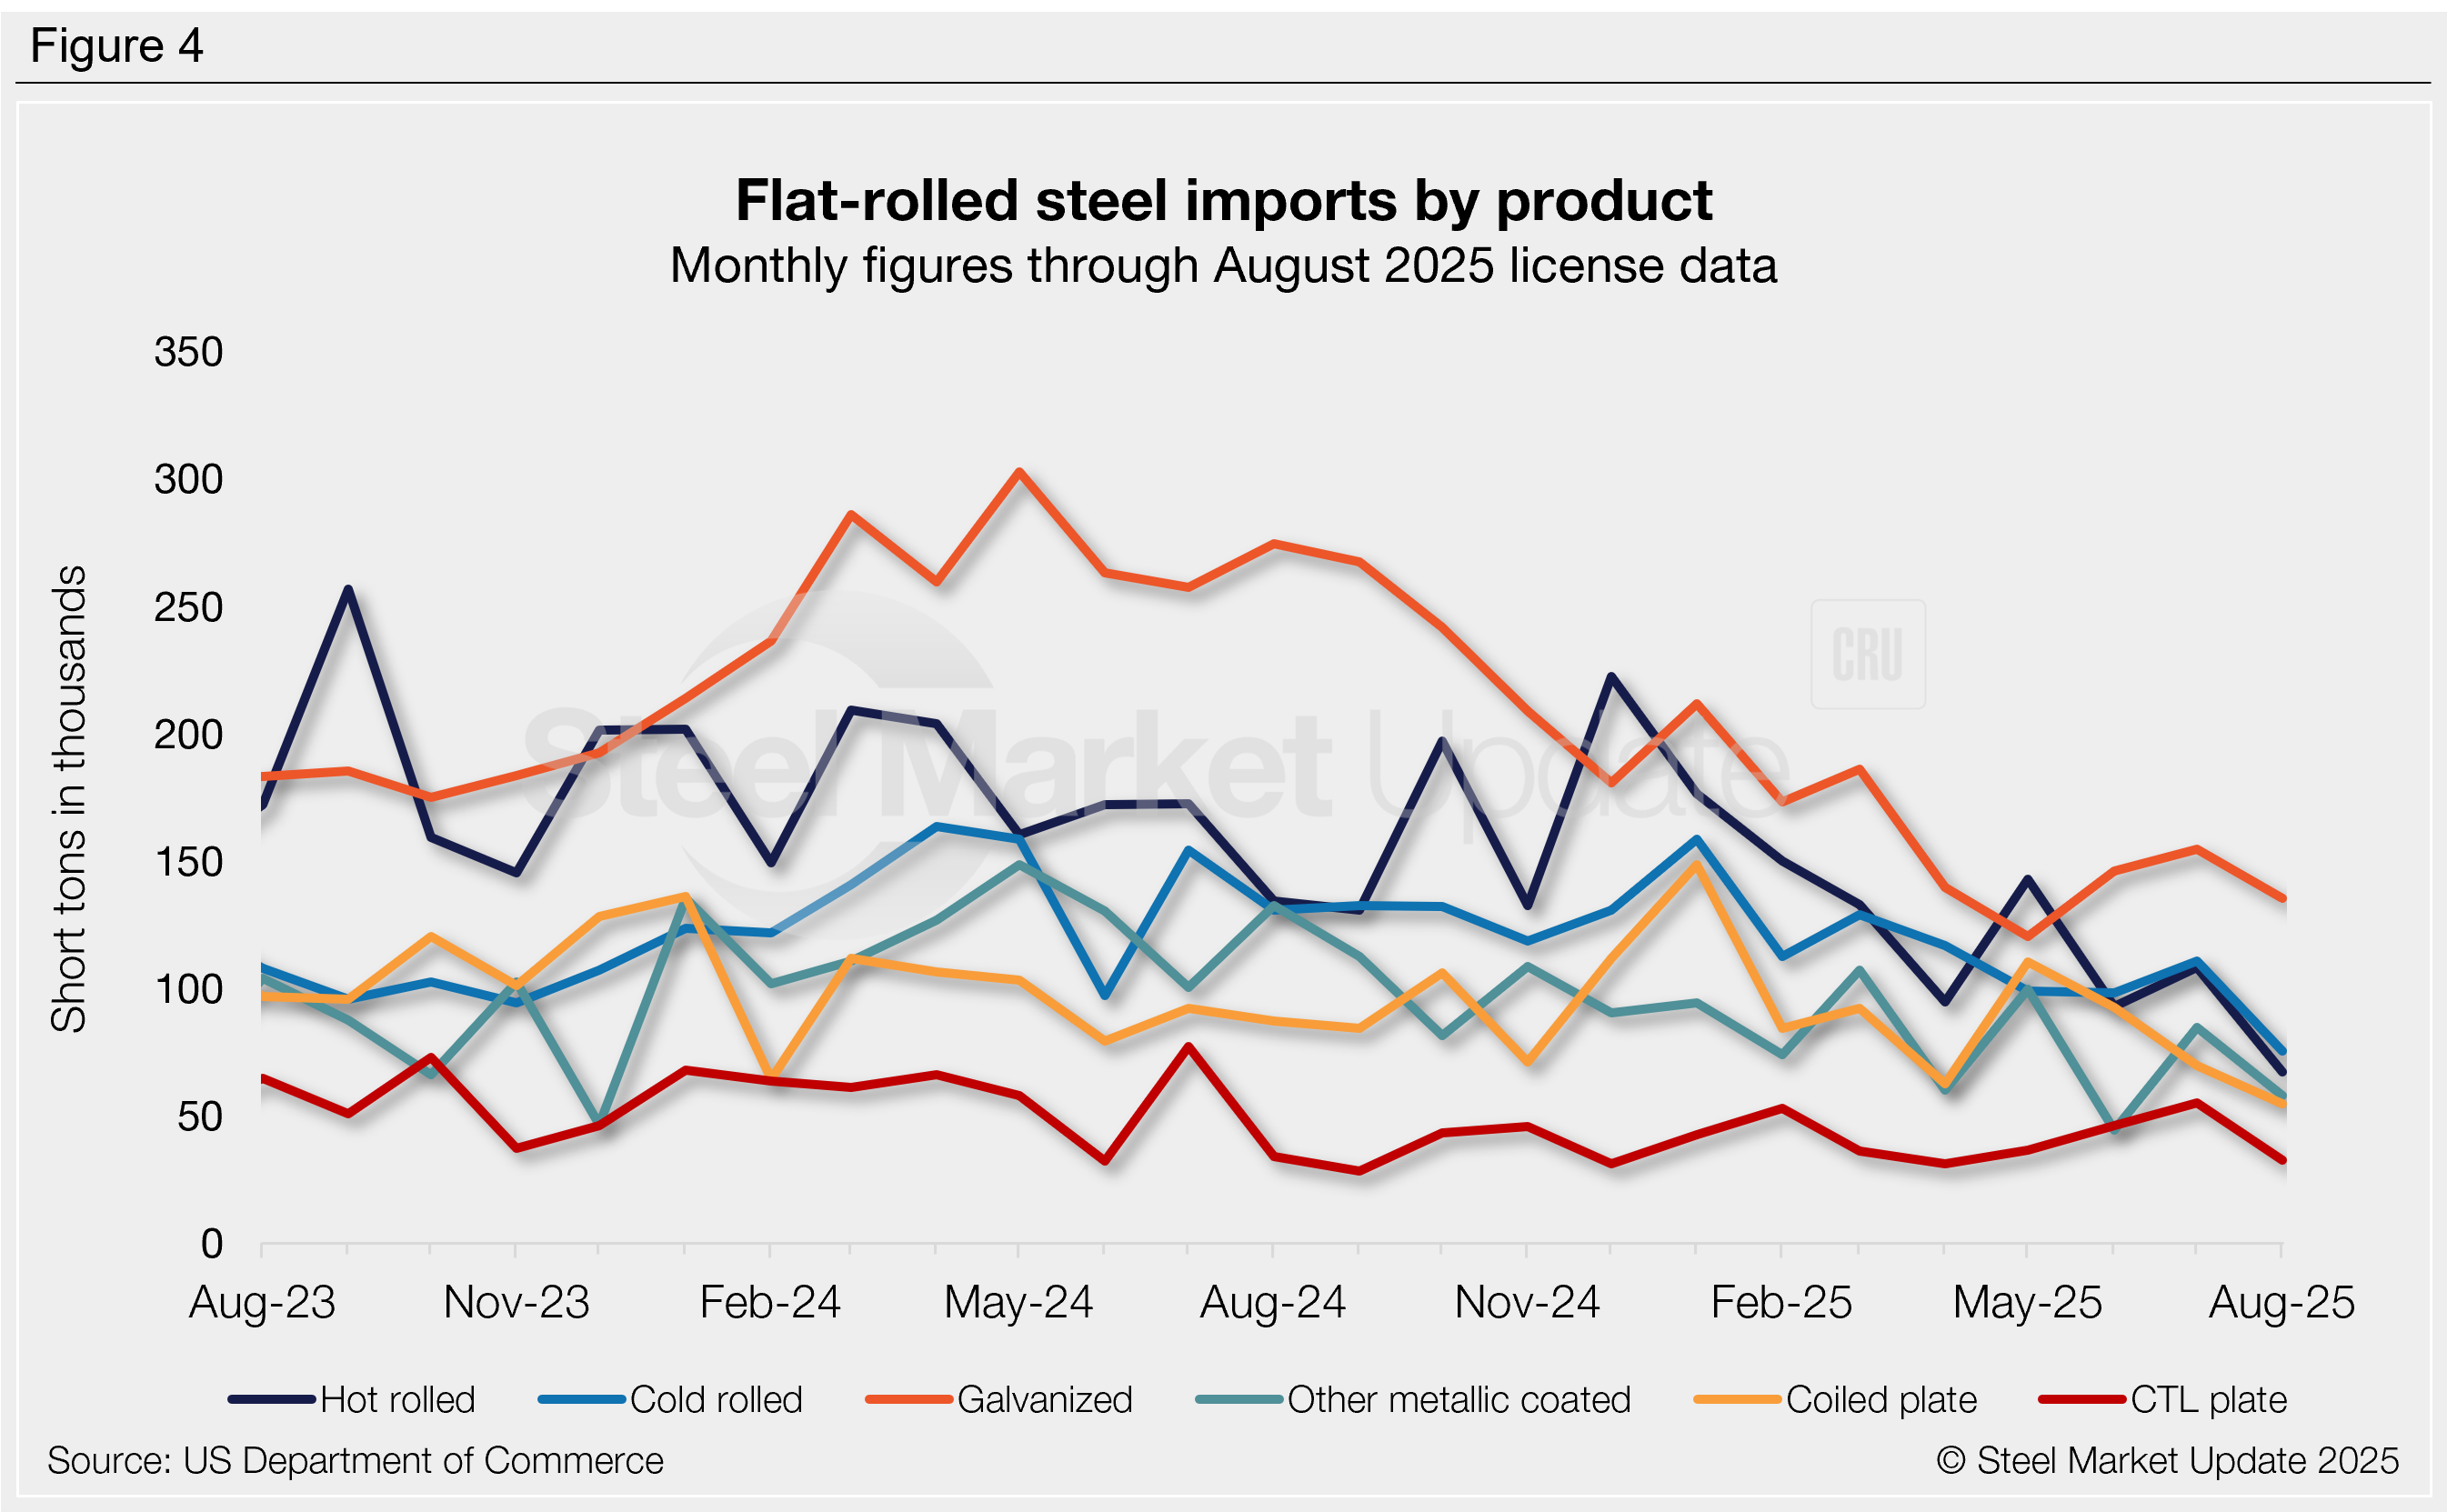
Flat-rolled imports
Figure 4 tracks flat-rolled imports for six popular sheet products. Most products increased from June to July aside from coiled plate. Through the latest August license data, all products tumbled back down, with many falling to multi-year lows. Key highlights:
- Hot-rolled coil imports rose 17% m/m in July then fell 38% in August, the lowest rate recorded in our 27-year data history.
- Cold-rolled coil increased 13% in July but slipped 32% in August to the lowest level since January 2021.
- Galvanized recovered 6% in July then fell 12% in August to one of the lowest rates since the 2020 pandemic.
- Other-metallic coated (mostly Galvalume) rebounded 92% in July following June’s near-three-year low. August licenses are back down 32%.
- Coiled plate fell 25% in July and slipped another 21% in August to a near five-year low.
- CTL plate increased 19% in July to a one-year high, then tumbled 41% in August.
- Tin plate jumped 25% in July. Those gains were erased in August, down 25% to a nine-month low.