

Product

August 19, 2013
Cold Rolled Imports by Port & Country
Written by John Packard
Cold rolled sheet imports June 2013 and YTD by source and port of entry.
This is one of an expanded series of analyses, exclusive to the Steel Market Update that is designed to provide a much more comprehensive view of actual volume by product. In the future, this data will be available to our Premium members only.
This data will enable a steel buyer or manager to see exactly what foreign steel came into his immediate vicinity and where it came from. This series of reports includes hot rolled, cold rolled, HDG and other metallic coated, (mainly Galvalume). We will publish these in the same format in four consecutive issues of the Steel Market Update. All volumes referenced are in short tons.
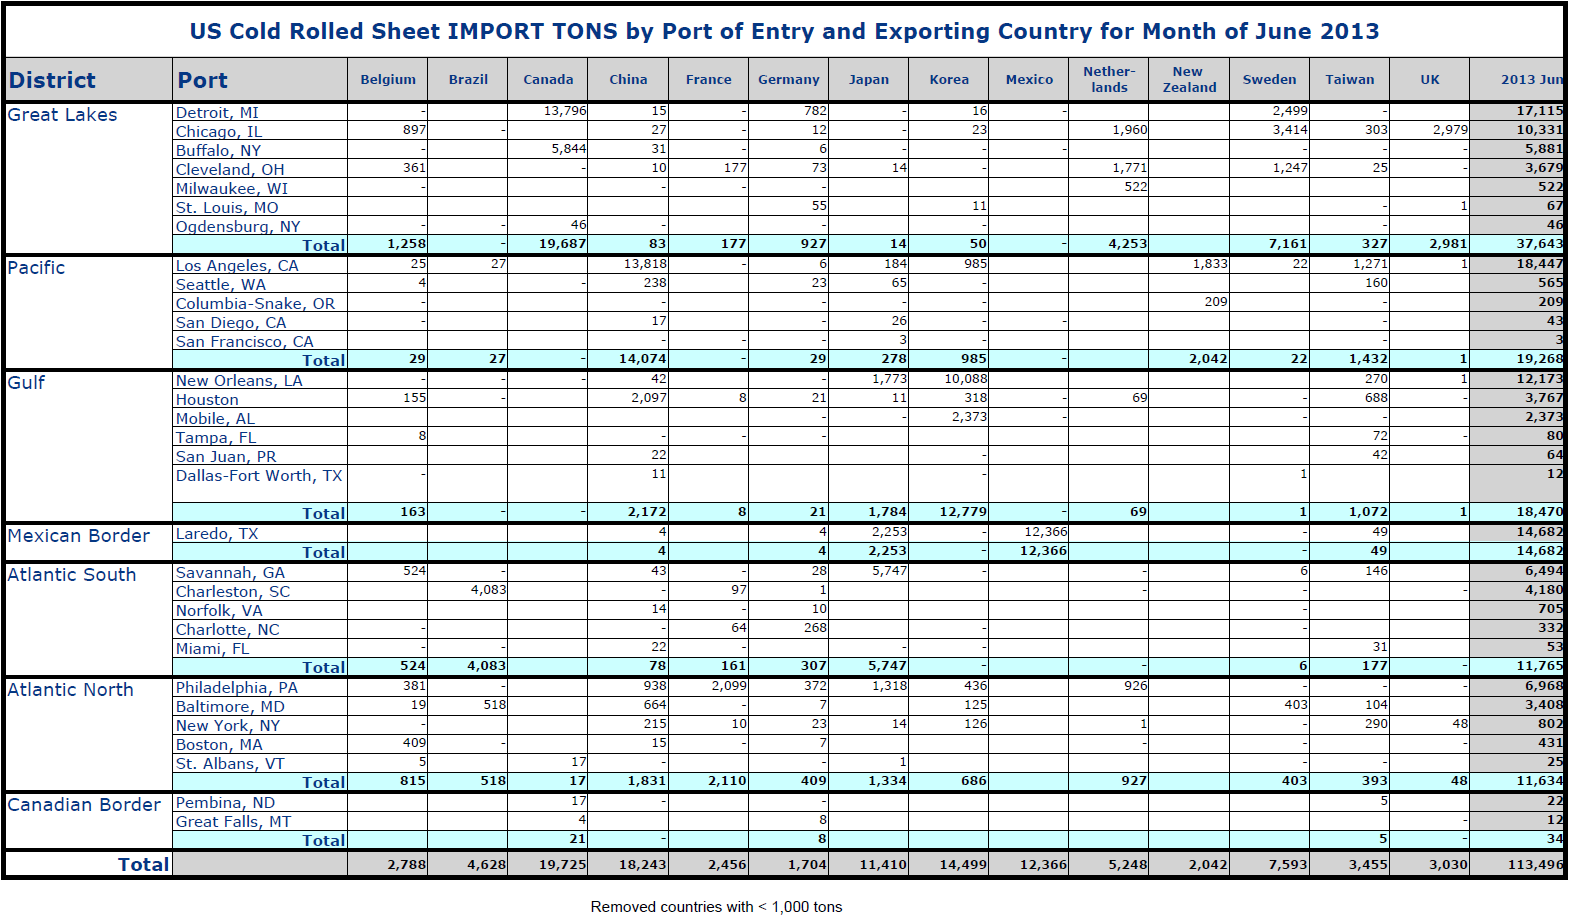
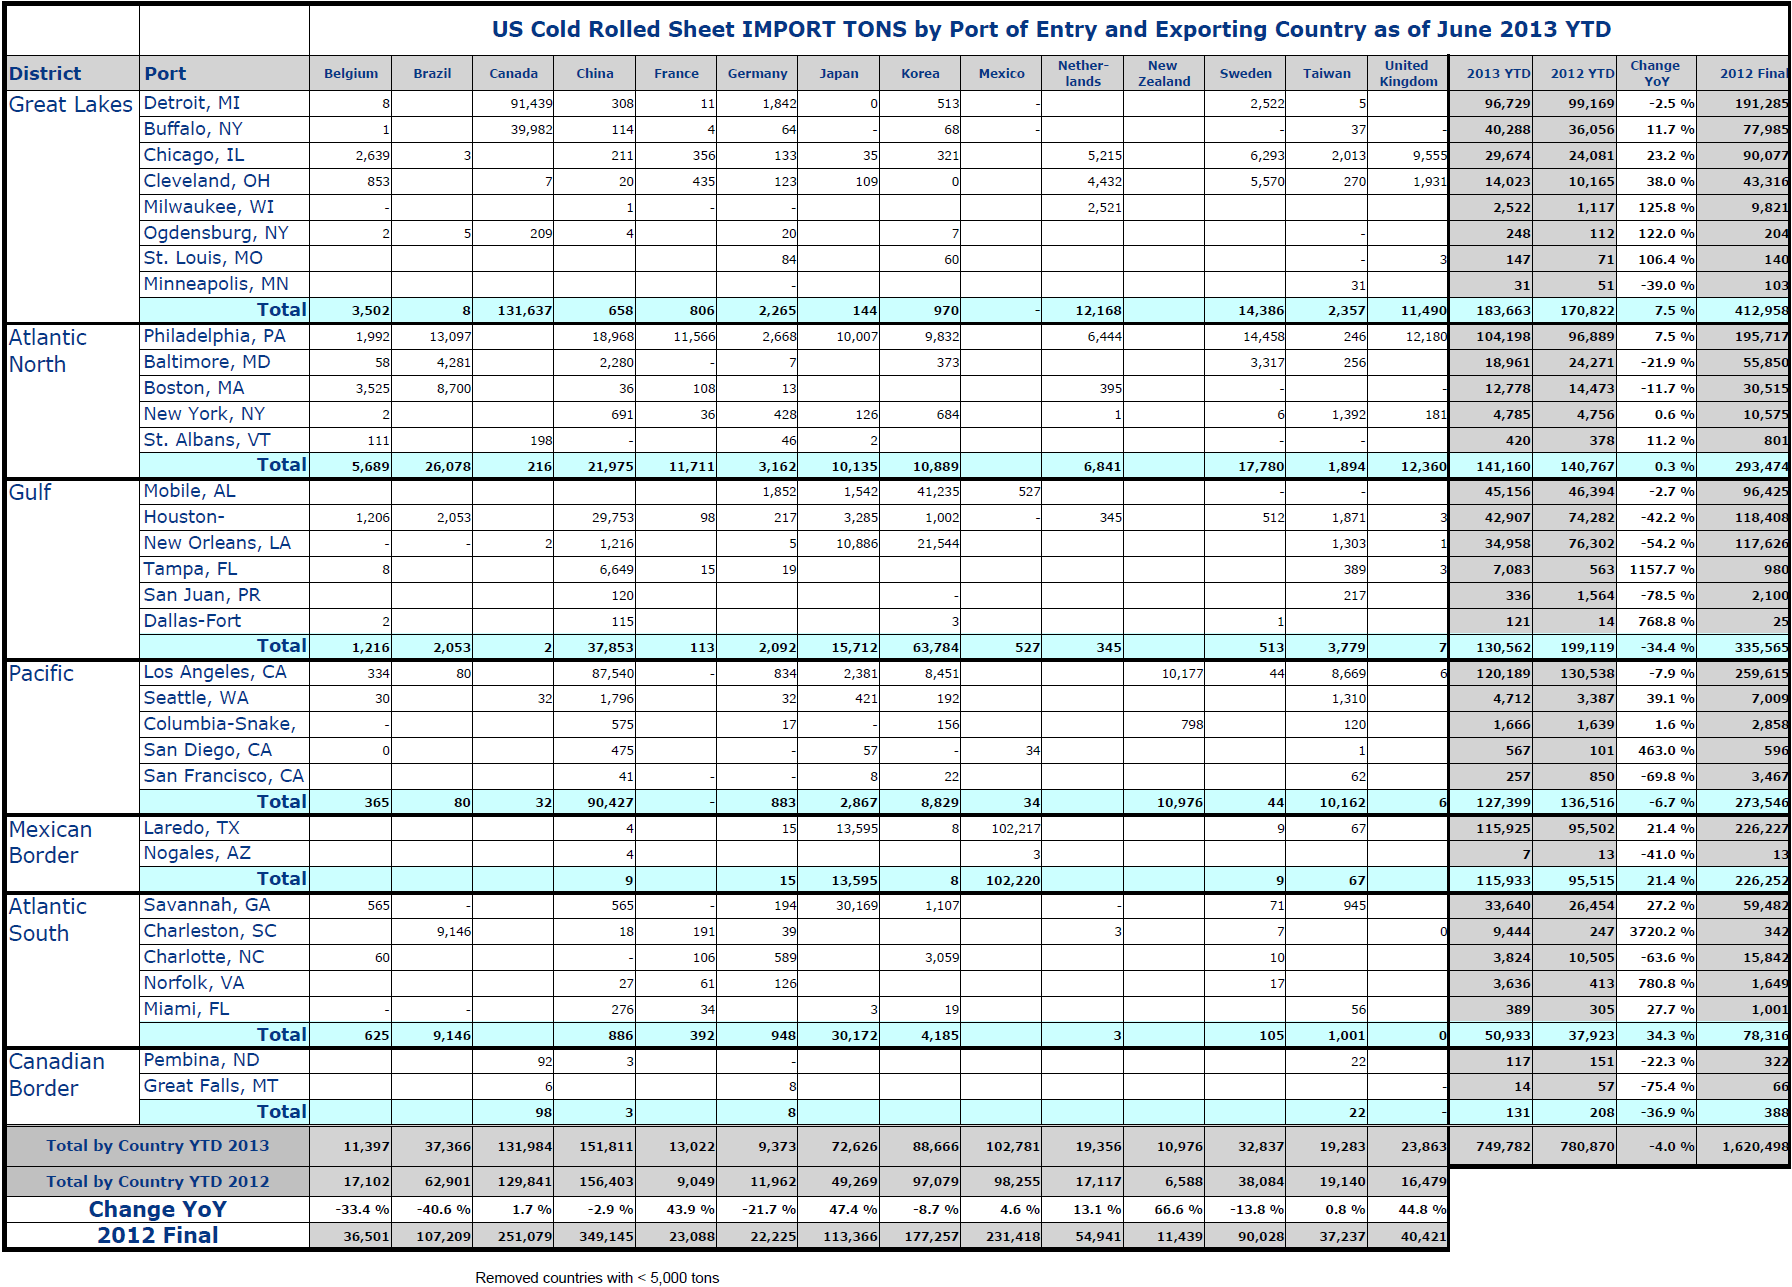
In Tables 1 and 2, the smaller volume sources have been removed to make the tables more readable. Totals are correct.
Total CR sheet tonnage in June was 113,496 tons, down 3.4 percent from May and down by 14.4 percent from June last year. Table 1 shows the detail by port of entry and country of origin for the June tonnage. Canada and China were the 1st and 2nd sources with 19,725 and 18,243 tons respectively. Almost all of the Canadian tonnage came in through Detroit. Los Angeles and Houston received 13,818 tons and 2,097 from China respectively. The Great Lakes received the most tonnage in June with 19,687 tons from Canada and 7,161 tons from Sweden. Korea put 12,779 tons into the Gulf, mainly through the port of New Orleans.
Table 1 and Table 2 are much too comprehensive for a detailed description. If you are a buyer and want to know what came into the ports closest to you and what the sources were, then this information can be read directly from the tables.
In 2013 YTD through June 749,782 tons entered the US, down by 4.0 percent from the first half of 2012. In the first half China was the largest source with 151,811 tons followed by Canada with 131,984 tons. Significant changes this year are Brazil down by 40.6 percent and Japan up by 47.4 percent. Major districts of entry through June were the Great Lakes with 183,663 tons, up by 7.5 percent from last year. The Gulf coast has experienced a 34.4 percent decline from last year.
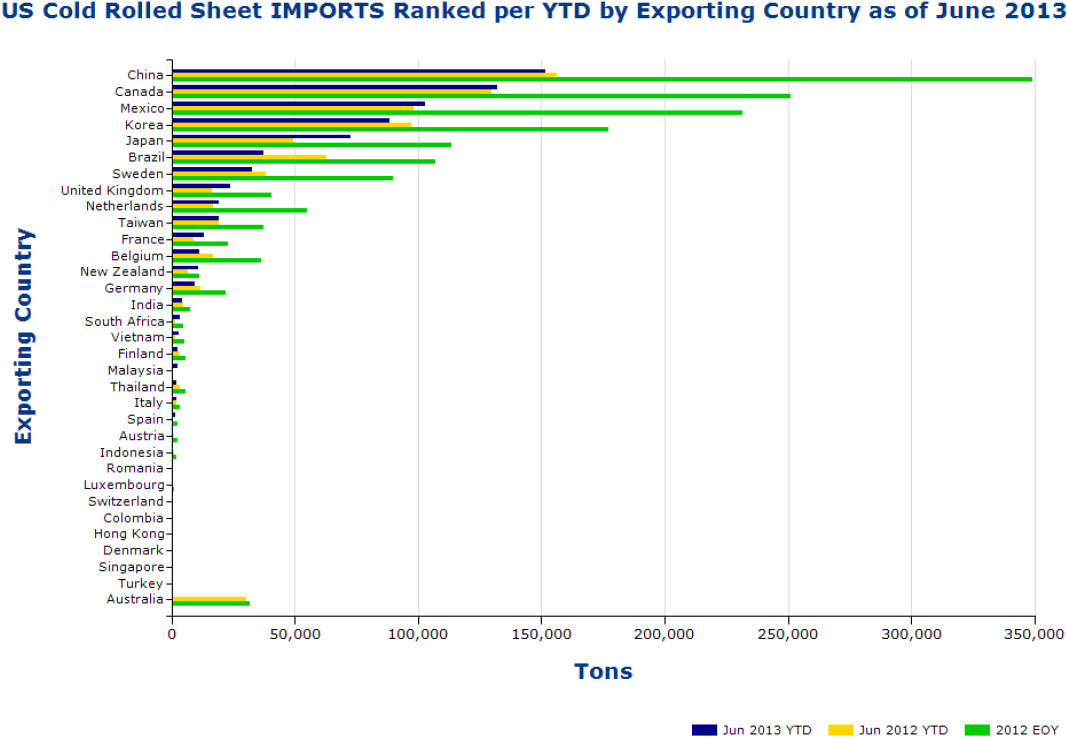
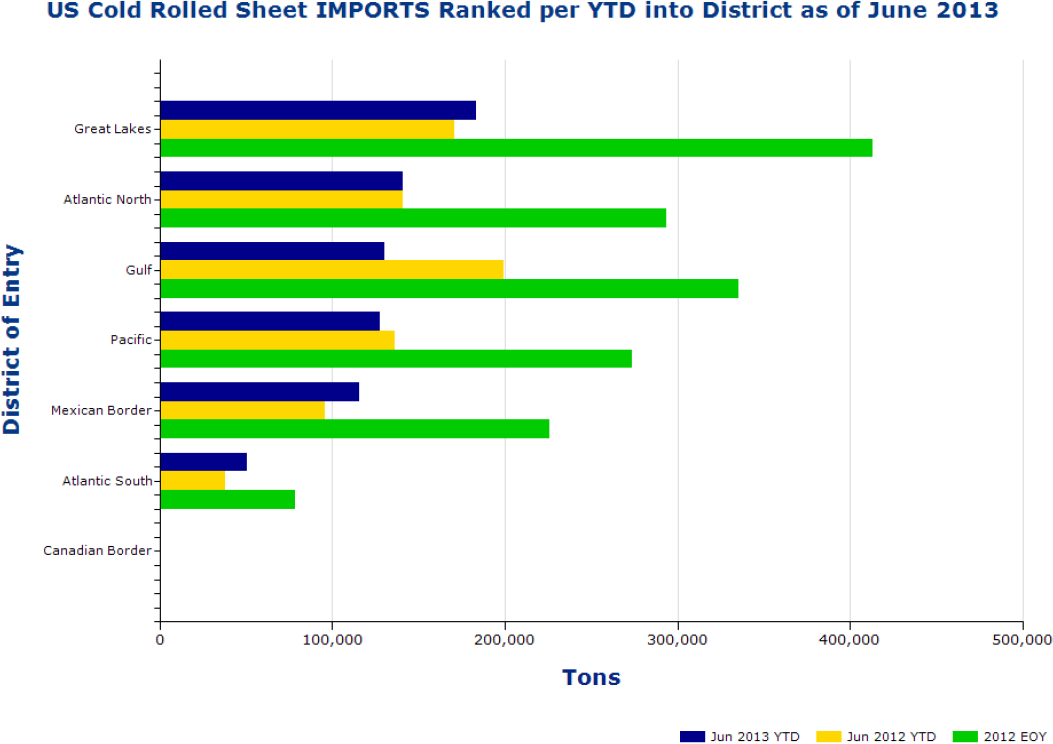
Volume YTD by source and by district of entry are shown graphically in Figures 1 and 2. The green bars indicate the final 2012 tonnage in each case. Countries and ports are ranked by the 2013 YTD tonnage. Figure 1 shows that the major sources, China, Canada and Mexico are tracking with last year while Figure 2 shows only the Gulf coast region has seen a significant change from 2012.


