

Market Data

June 3, 2014
Key Market Indicators on June 1st 2014
Written by Brett Linton
An explanation of the Key Indicators concept is given at the end of this piece for those readers who are unfamiliar with it.
The total number of indicators considered at present is thirty five, the Chicago Fed Mid-West Manufacturing Index is still on hold to enable the staff to complete a major re-vamp of the structure of their report. Please refer to Table 1 for the view of the present situation and the quantitative measure of trends.
The present situation changed slightly for our estimate of the general economy and changed significantly for our view of the flat rolled market. This was a net change of + 1 to the indicators, classified as poor by historical standards, and a net change of -1 to the indicators, considered historically good. Thirteen of the indicators based on historical standards were positive on May 29th and twelve were negative with ten considered to be close to the historical norm. Nine of the twelve negative indicators were in the steel long products and construction sectors. It makes sense that these two groups would be in harmony. This broad look confirms that it is construction that is holding steel demand lower than is normal at this time in a cyclical recovery.
The present situation of the general economy is barely OK with three indicators positive, three neutral and two negative. This is an increase of one in the negative category as we have re-classified consumer debt which has returned to an all-time high from neutral to negative.
Both the SMU buyer’s index and the SMU service center excess are currently positive. Service centers took in 252,000 tons less than they shipped which we interpret as positive for prices going forward as their inventories are lean. The steel buyer’s sentiment index is at an all-time high at 50.33. The buyer’s index leans heavily to the flat rolled sector so does not conflict with our view of the two main steel sectors described below.
Present situation indicators for long products are significantly worse than for flat rolled and were unchanged from last month. Capacity utilization and mill shipments are both negative for long products as are net imports and service center shipments. The scrap price and scrap export indicators are positive and service center inventories are considered to be in line with historical norms.
Present situation indicators for plate and sheet products in summary had one indicator positive, one negative and four neutral. There were significant changes in May with a net decrease of one in the positive category and an increase of one neutral measure. We have re-classified the price of iron ore from positive to neutral as the Iodex index of 62 percent Fe delivered North China fell to below $100 / dmt. We consider this to be a negative trend for the same reason as we described for scrap above. Last August Goldman Sachs forecast that the price of iron ore would decline to $85 in 2015 and so far that estimate looks reasonable. Net imports of flat products were re-classified from neutral to negative based on the final March data. Service center shipments were re-classified negative to neutral.
There was no change in our view of the present situation of either construction or manufacturing in May. Five of the negative present situation indicators relate to construction; none of the manufacturing indicators are currently negative, four are positive and two are neutral.
The quantitative analysis of the value of each indicator over time is shown in the “Trend” column of Table 1. The trends of data released in May improved by one in the positive column to a total of 27 out of 35 heading in the right direction. This is the best result in the 14 months that we have performed this analysis. (Please note in most cases this is not May data but data that was released in May for previous months.)
Only two out of eight trends in the general economy trended negative in May, this was an increase of one which was rising consumer debt. We regard this debt situation as negative because a large portion is consumer loans which will detract from future consumption. Other indicators in this section continued on their previous trajectory.
The trend of the SMU steel buyer’s sentiment index continued to be positive and reached an all-time high in the second half of May. The trend of service center surplus changed from positive in April to negative in May. This was because the apparent deficit declined from 352,000 tons to 251,000 tons. We regard a deficit as a positive because it points to lean inventories and higher future prices. However, by this logic bigger is better and the deficit declined therefore the trend was negative.
In the long product steel sector in May five of seven indicators were trending in the right direction which was an increase of one from the April result. Shipments at both the mill and service center levels changed from declining to increasing, both on a three month moving average basis year over year. The price of Chicago shredded, which had declined in March, recovered by $10 in April and then declined by a further $15 in May. We consider a declining scrap price as negative as it suggests a weakening global and domestic market.
Of the six flat rolled steel indicators there was a decline of one in the positively trending indicators resulting in a balance of three positive and three negative. In April the price of iron ore increased by $5.50 but in May declined by $17.50 breaking through the $100 level. Capacity utilization increased from 80.5 in February to 82.4 in March, but shipments on a year over year basis declined. Both are three month moving averages. March is the latest mill shipment data available from the AISI. Net imports of sheet products on a 3MMA basis continued to increase in March, up 11.9 percent from February. Service center shipments and inventories continued to trend in a positive direction through April. Service center tons / day shipments have now trended positive for nine straight months.
Construction trends in the last month improved from four of six positive in the April data to six of six positive in May. Nonresidential and residential construction starts both returned to a positive trend in the results published in May which was for April starts. We hoped that the decline in our report last month was weather related and it looks now as though that was probably the case.
In the manufacturing sector all indicators trended positive in the May data which was an improvement of one as the ISM manufacturing index returned to positive growth.
The key indicators analysis confirms our experience that the present situation of the long products market driven by construction is in the doldrums but that the flat rolled market is much healthier. However trends in long products in the May data were better than for flat rolled. SMU has several benchmark analyses that show steel demand to be below the historical norm for this stage of a recovery. This is because the recession in non residential and housing construction was so extreme that it will be years before the 2007 levels are regained. In addition, government funded infrastructure work is still depressed.
We believe a continued examination of both the present situation and direction will be a valuable tool for corporate business planning.
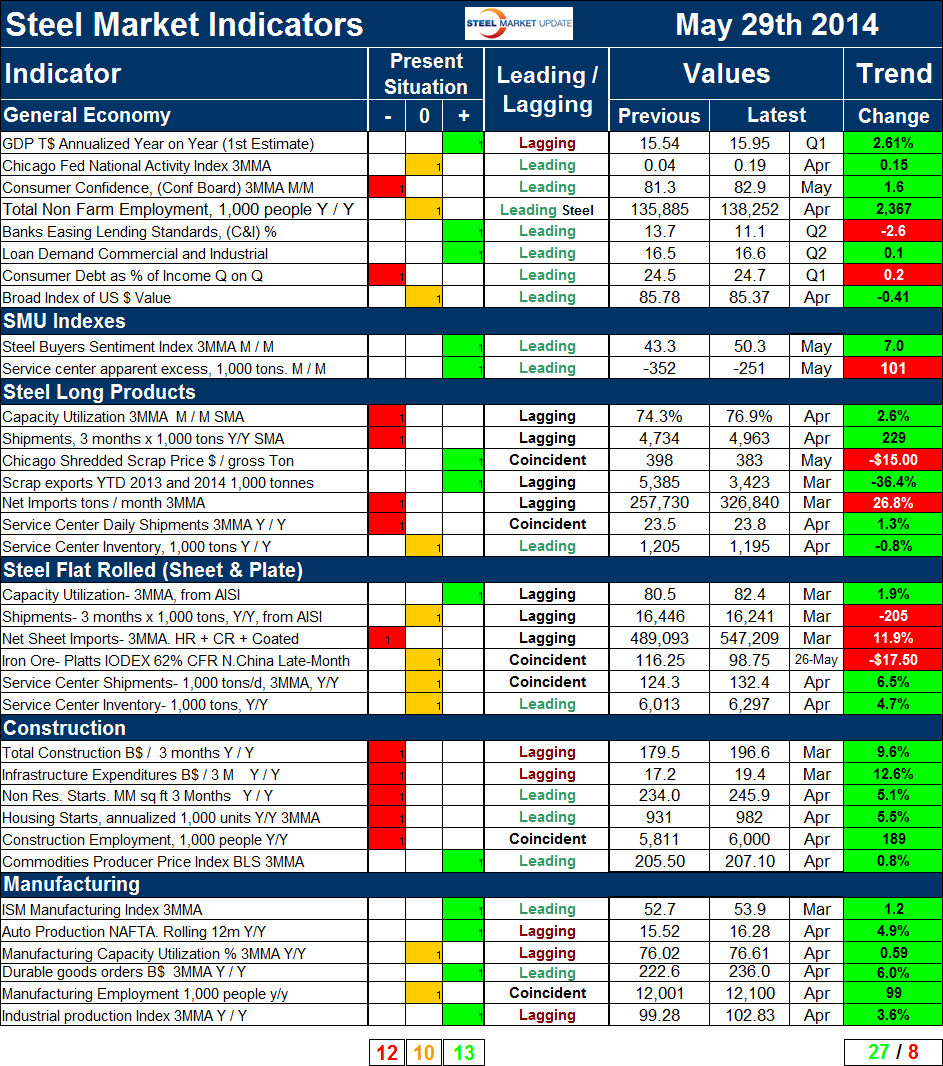
Explanation: The key indicators chart is designed to give a snapshot of the steel market on a specific date. The chart is stacked vertically to separate the primary indicators of the general economy, of proprietary Steel Market Update indices, of both flat rolled and long product market indicators and finally of construction and manufacturing indicators. The indicators are classified as leading, coincident or lagging as indicated.
Columns in the chart are designed to differentiate between the current situation and the direction in which the market is headed. The present situation is sub-divided into, below the historical norm (-), (OK), and above the historical norm (+). The “Values” section of the chart is a quantitative definition of the market’s direction. In cases where seasonality is an issue, the evaluation of market direction is made on a three month moving average basis and compared year over year to eliminate this effect. Where seasonality is not an issue concurrent periods are compared. The date of the latest data is identified in the third values column. Values will always be current as of the date of publication. Finally the far right column quantifies the trend as a percentage or numerical change with color code classification to indicate positive or negative direction.


