Market Data

August 10, 2014
SMU Key Market Indicator Data Point Moved to "Unsatisfactory"
Written by Peter Wright
If we start with the premise that the consumer is almost 70 percent of GDP and that steel consumption is closely correlated with GDP, then consumer behavior and, in particular, debt is very relevant to our future businesses. Consumer spending is driven by income and both the perception of current debt and willingness to take on more. The Federal Reserve reports of personal income and credit outstanding are important pieces of the jigsaw puzzle of steel demand, past present and future.
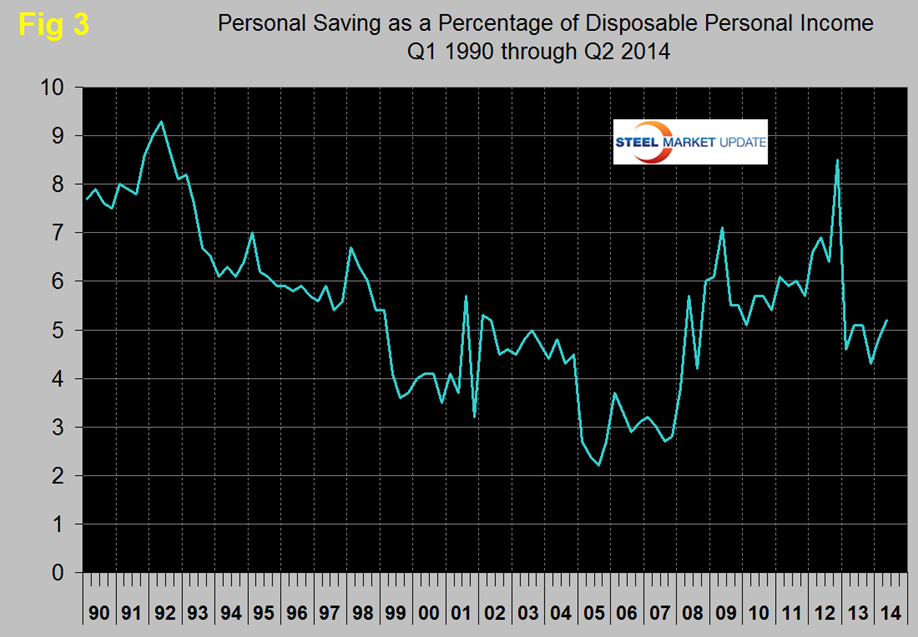
The change in the mix of consumer debt between installments (big ticket items) and revolving (credit cards) since the recession has been remarkable. In 30 months through June, installment loans have grown by 21.2 percent and revolving loans by only 3.8 percent, (Figure 1). Consumers have clearly learned their lesson regarding the predatory nature of credit card lending and this sector has barely expanded in over three years. Installment debt now stands at $2.3 trillion over half of which is for student loans.
On Friday the Armada Executive Intelligence Brief reported as follows; “Consumer Credit Mixed in June. Consumer’s used credit more guardedly in some ways, and more liberally in others. Fears of a credit bubble in student loans and automobiles were not abated in June as consumers increased borrowing in those sectors (non-revolving credit) by $16.3 billion, far less than expected. We saw consumer revolving credit increase by $941 million, well short of the $1.74 billion gain in May. Changes are a bit less extravagant than we saw in the mid 2000’s, and certainly less volatile than they were during the Great Recession and immediately right after. This is partly due to the management of credit by banks and a portion due to the desire of many consumers to “get their house in order” coming out of the recession. Bank lending standards are tighter than they were prior to the recession and many consumers saw their credit drop in volatility as we have seen in the past two years.”
The structure of the increasing debt level is not of much help to steel providers in terms of increased consumption and it appears to us at SMU that the student loan situation is already at an unsustainable level and could precipitate the next taxpayer bailout and financial crisis.
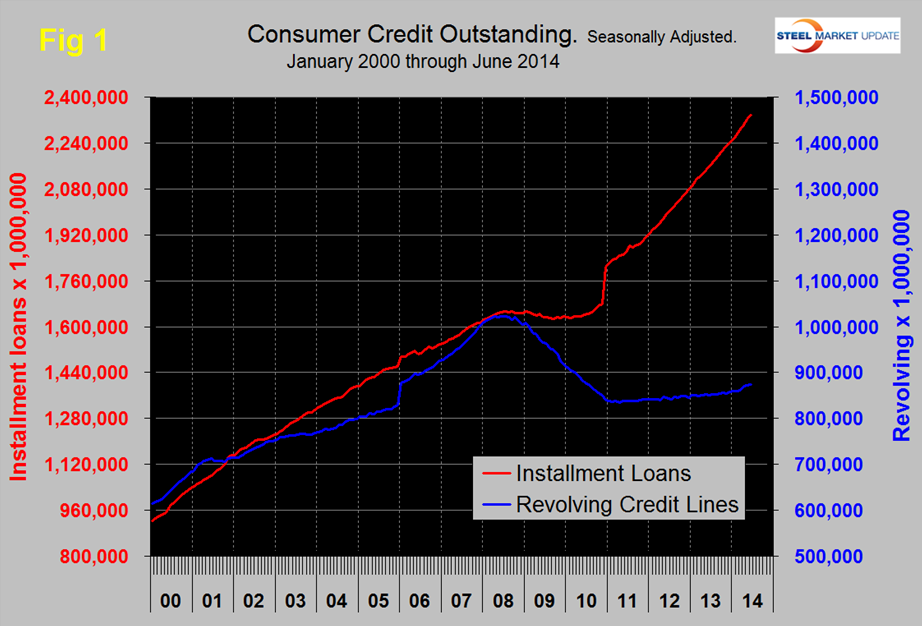
In the mid-2000s about 2 percent of GDP was created by consumer borrowing using both credit cards and their home equity as a piggy bank. This boosted consumer demand and steel consumption. The ratio of consumer debt to personal disposable income rose from its long term range of 16 to 20 percent to over 24 percent, (Figure 2). This is only installment and revolving loans and does not include home mortgages. This ratio declined after the recession but is now at an all-time high having passed the previous peak of Q3 2007. This is a data point that we track in our Key Market Indicators analysis which is published at the end of each month for our Premium subscribers. On the basis of this latest data we have re-classified consumer debt as an unsatisfactory indicator at its present level.
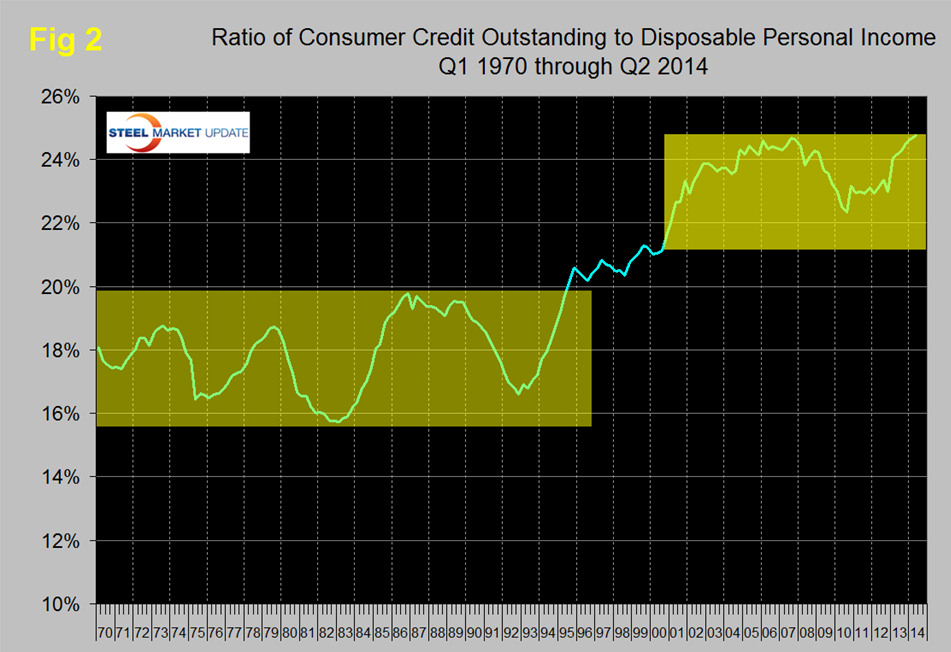
Consumer savings as a percentage of disposable personal income in 2013 and 2014 have returned to the level that pertained in the early 2000s, (Figure 3). Ultimately savings are invested which drives productivity, GDP and steel consumption.