

Market Data
August 19, 2014
US Steel Service Centers Apparent Inventory Deficit Drops
Written by John Packard
One of the Steel Market Update proprietary products is our U.S. Service Center Apparent Inventory Excess/Deficit report and forecast. Once per month, SMU analyzes the MSCI flat rolled steel shipments and flat rolled steel inventories and we calculate whether the steel distributors are either over-inventories (excess) or under-inventoried (deficit) based on our proprietary formula. We then go one step further and for our Premium Level subscribers we produce a forecast as to where we believe service center shipments and inventories will be in the coming months. Our new free trial subscribers also get access to this data.
Service center flat rolled shipments rose by 7 percent or, 1 percent more than we had forecast when we last produced our Apparent Excess/Deficit report for our Premium subscribers. Flat rolled shipments in July averaged 108,800 tons per day up from the 101,700 tons per day shipped last July.
At the end of June we calculated service centers were short flat rolled inventory by 351,000 tons (-351,000). By the end of July the inventory deficit had been reduced by 158,000 tons and now stands at -193,000.
Our forecast for July was -229,000 tons after making an inventory adjustment of 200,000 tons to accommodate the excess foreign steel moving into distributors inventories.
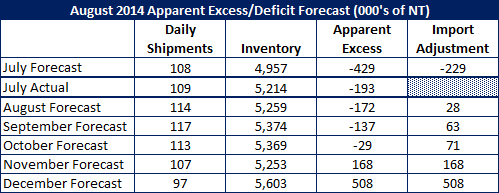
As we look at August through September shipment and inventory levels for flat rolled, we are forecasting 6 percent growth in shipments year-over-year. This takes the daily shipment rate for August up to 114,000 tons per day. We are also projecting that the growth will remain at 6 percent for the balance of the year and we will adjust as the market changes. The daily shipment rate shown in our table above includes a 6 percent growth rate.
Steel Market Update is forecasting that the inventory deficit will be eliminated by the end of August. With an Excess of +28,000 tons the distributors inventories should be essentially “balanced” at the end of August.
Based on our projected shipments and receipts (including adding extra tons to accommodate foreign receipts in August, September and October) we are forecasting service center inventories to be in a slight excess position (between zero and +100,000 tons) for August, September and October and then for the excess to grow in November and December…
There is more to this article which can be accessed by our Premium Level subscribers as well as our free trial subscribers (no credit cards required). If you would like to continue please register for a free trial and you can find the balance of the article in our Premium Newsletter Archives which is under the “Newsletter” tab once you are logged into the website as a new free trial member.


