Market Data

July 22, 2015
SMU Forecasting Apparent Excess to Drop in July
Written by John Packard
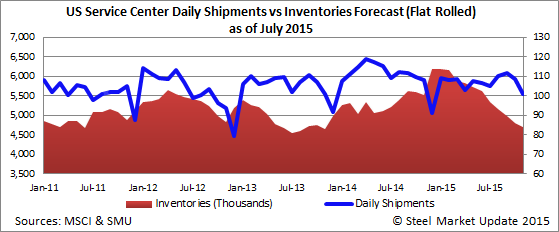
Last month, Steel Market Update forecast that June steel service center shipments of flat rolled steel would total 2,430,000 tons. The actual number, according to MSCI data, came in at 2,339,000 tons or 91,000 tons fewer than our forecast.
The daily shipment rate for June, which is more accurate than keeping tabs on total month shipments as the number of days will vary from month to month and year to year, was 106,300 tons. This is 7.6 percent lower than the 115,000 tons per day seen last June.
Our forecast for flat rolled steel shipments for June was based on the daily averaged of shipments during the month over the past three years. We did not put in any reduction due to changes in demand and subsequently our number was off by 3.9 percent.
SMU forecast that receipts into the warehouses would remain at 100,000 tons per day which is slightly lower than the 102,000 tons per day seen in May. Actual receipts were 101,500 tons per day and flat rolled inventories totaled 5,607,500 tons at the end of June.
The MSCI called out service center inventories of flat rolled as being 2.4 months supply, down from 2.7 months reported at the end of May.
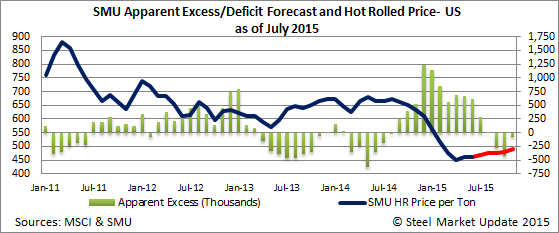
Steel Market Update looks at the market slightly differently. Based on our model we calculated the amount of Apparent Excess inventory to be +617,000 tons. This is down 56,000 tons from the prior month but is well off the +405,000 tons we forecast at one month ago. The miss was due to shipments being weaker than the three year average and receipts continuing to be higher than anticipated which was most likely due to increased order patterns in April due to low domestic steel prices. In May, prices found the floor and rebounded by about $20 per ton which should impact July and August receipts.
SMU Forecast for July & beyond
First, let’s talk about what logic we are using to determine our shipping and then receipt forecast.
We are working with the three year average for shipments and then determining if there needs to be an adjustment made based on the short-term trend.
We look at calendar year 2014 in total (all twelve months) and determined that for the year shipments were 6.3 percent higher than the 3 year average of service center shipments prior to 2014.
As we look at forecasting shipments for the month of July 2015 we go back and compare last year (July 2014) against the three year average and found that shipments one year ago where 8.5 percent higher than the average. July also performed better than the 6.3 percent total for the calendar year. July was also better than what was seen during the first six months 2014 where the average daily shipment rate was up 5.5 percent over its three month average.
Now we take a look at the trend for 2015 which is radically different than what we saw during the first six months 2014 (+5.5 percent). For the first six months 2015 the average daily shipment rate was 3.6 percent lower than the three year average. Over the last 3 months the daily shipments have been 5.7 percent lower than the 3 year average. However, that is a deceptive number because the data looks like this:
April – down 8.1 percent
May – down 5.2 percent
June – down 3.9 percent
So, we have actually seen an improving trend going into the month of July. The question is how comfortable are we that the improving trend will continue?
We looked back and found that over the past four years, July has out-performed its 3 year average.
Our forecast for July 2015 shipments is that the month will be +2 percent above its three year average. The three year daily shipping average is 103,100 tons per day. SMU is forecasting the daily rate will be 105,200 tons per day for a total monthly shipments of 2,314,000 tons.
The 105,200 tons per day would be 3.3 percent lower than July 2014 daily shipment rate.
Receipts
The three year daily receipt average for the month of July is 101,600 per day. This would be in line with the June actual at 101,500 tons per day.
However, we are seeing a destocking trend against the 3 year average for receipts. For the first six months of 2015 the average has been for the daily receipt rate to be 8 percent lower than the 3 year average.
Over the past three months we have seen the daily receipt rate against the 3 year average:
April – down 16.7 percent
May – down 0.7 percent
June – down 7 percent
We believe the move to continue destocking will continue and we believe that July daily receipts will be lower than the three year average that we have seen over the past six months: lower by 8 percent.
Taking our daily shipment rate forecast for July and receipt rate and then comparing the results to our model for what we have determined to be a balanced inventory level for the month of July, we are forecasting service centers will still have an Apparent Excess of flat rolled steel at the end of July. However, our forecast is calling for the excess to be +288,000 tons, down from the +617,000 tons we just reported for June.
Here is how our forecast looks for July through November 2015:
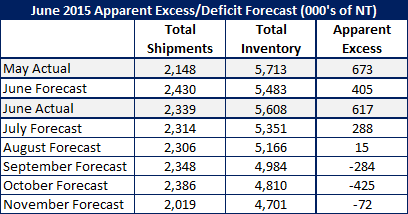
If our forecast is even remotely correct, we would expect a surge in reordering to take place in late August and into September. Our price forecast for the moment is to expect a stable market with the potential for upside risk in flat rolled prices as we get into the month of September.