

Prices

August 4, 2015
Flat, Long, and Semi-Finished Steel Imports Analysis
Written by Peter Wright
Licensed data for July was updated on August 4th through the Steel Import Monitoring System of the US Commerce Department. Steel Market Update publishes several import reports ranging from this very early look using licensed data to the very detailed analysis of final volumes by district of entry and source nation which is available to our premium members.
![]() The early look, the latest of which you are reading now has been based on three month moving averages (3MMA) using July licensed data and June preliminary and May final data. We recognize that the license data is subject to revisions but believe that by combining it with earlier months in this way gives a reasonably accurate assessment of volume trends by product as early as possible. The main issue with the license data is that the month in which the tonnage arrives is often not the same month in which the license was recorded. In 2014 as a whole our data showed that the reported licensed tonnage of all carbon and low alloy products was 2.3 percent less than actually receipts, close enough we believe to confidently include licensed data in this current update. Total rolled product licensed imports in the single month of July were 2,440,697 short tons which was 3.8 percent more than the June preliminary result. On this basis flat rolled was up by 4.8 percent, long products up by 12.6 percent and pipe and tube down by 13.3 percent. At SMU we prefer not to dwell on single months results because of the extreme monthly variability that can occur in individual products. In the comments below we use three month moving averages to get a more representative picture.
The early look, the latest of which you are reading now has been based on three month moving averages (3MMA) using July licensed data and June preliminary and May final data. We recognize that the license data is subject to revisions but believe that by combining it with earlier months in this way gives a reasonably accurate assessment of volume trends by product as early as possible. The main issue with the license data is that the month in which the tonnage arrives is often not the same month in which the license was recorded. In 2014 as a whole our data showed that the reported licensed tonnage of all carbon and low alloy products was 2.3 percent less than actually receipts, close enough we believe to confidently include licensed data in this current update. Total rolled product licensed imports in the single month of July were 2,440,697 short tons which was 3.8 percent more than the June preliminary result. On this basis flat rolled was up by 4.8 percent, long products up by 12.6 percent and pipe and tube down by 13.3 percent. At SMU we prefer not to dwell on single months results because of the extreme monthly variability that can occur in individual products. In the comments below we use three month moving averages to get a more representative picture.
Figure 1 shows the 3MMA through July licenses for semi-finished, flat and long products.
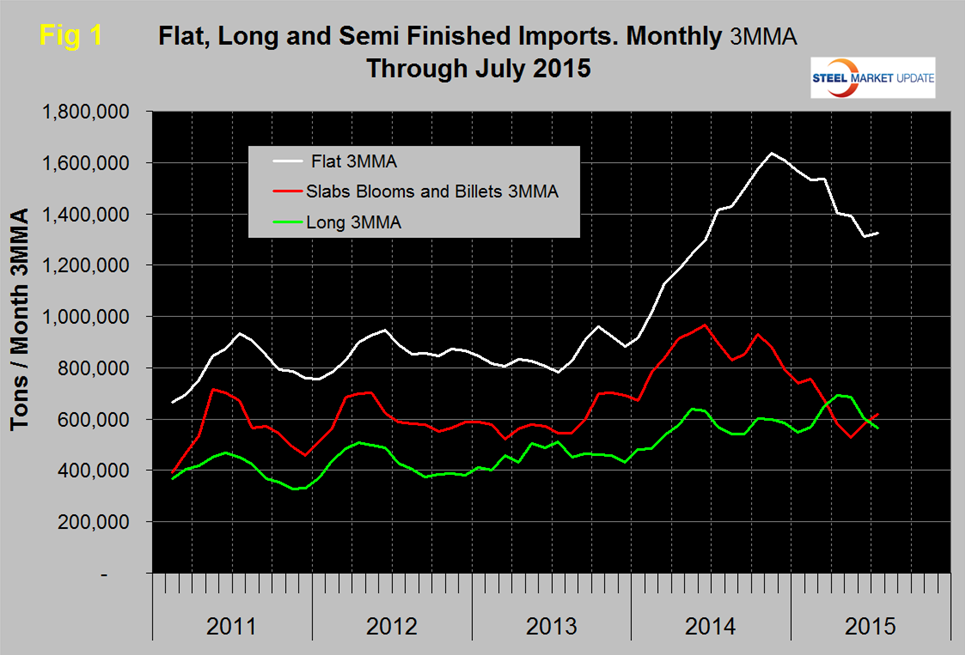
Flat includes all hot and cold rolled sheet and strip plus all coated sheet products including tin-plate plus both discrete and coiled plate. The 3MMA of flat rolled imports peaked at 1,634,000 tons in November last year and has since declined to 1,324,000 tons in July. Last October the 3MMA of semi-finished imports was 930,000 tons and this volume declined to 619,000 tons in July. Long product imports have been stuck in the range 519,000 tons and 772,000 tons since March last year with no particular trend evident.
Figure 2 shows the trend of sheet and strip products since January 2011 as three month moving averages.
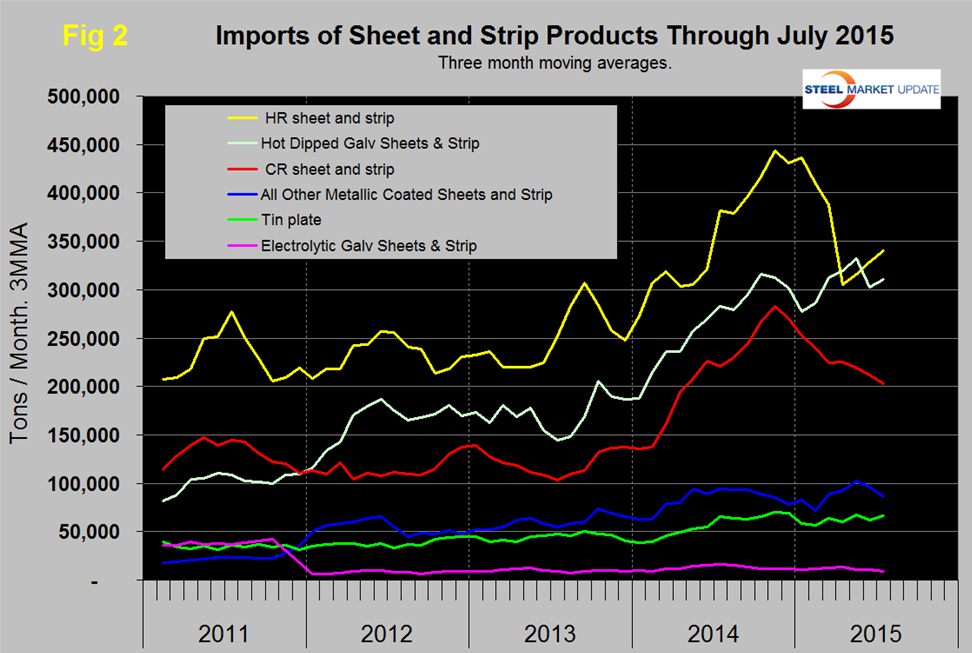
Of the big three tonnage items, HR, CR and HDG, hot rolled which was down by 21.2 percent in April steadily increased in May through July. Cold rolled peaked at 283,000 tons in November and has since decreased to 203,000 tons in July. Hot dipped galvanized imports increased in February through May, decreased by 8.9 percent in June then increased by 2.6 percent in July. All other metallic coated, (mainly galvalume), peaked in May at 102,000 tons and through July had declined to 86,000 tons. Tin plate had been trending up for all of 2014 but has been range bound this year. Electro-galvanized keeps on rolling along with little change in three years.
Table 1 provides an analysis of major product groups and of sheet products in detail.
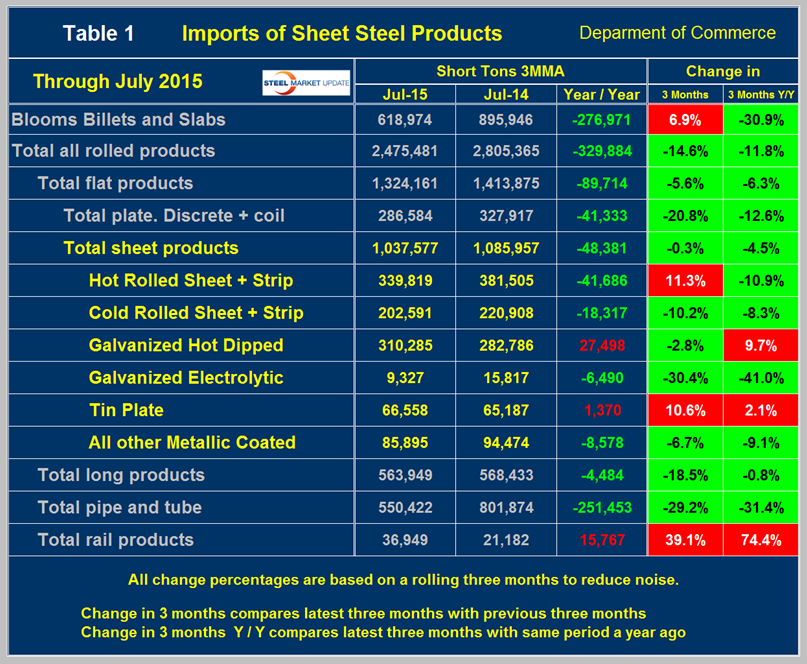
It compares the average monthly tonnage in the latest three months through July with both three months through April, (3M/3M) and May through July last year, (Y/Y). Semi-finished slabs and billets were up by 6.9 percent 3M/3M but down by 30.9 percent Y/Y. The total tonnage of hot worked products was 2,475,481 tons in July on a 3MMA basis, down by 329,884 tons from July last year. The three moving average was down by 14.6 percent from the average of three months through April and down by 11.8 percent from a year ago. These trends indicate that in the big picture the peak of import volume has passed but this is not necessarily true for individual products. The color codes in Table 1 for the three month and year over year change show which products are improving and which are still experiencing import volume increases.
Table 2 shows the same analysis for long products.
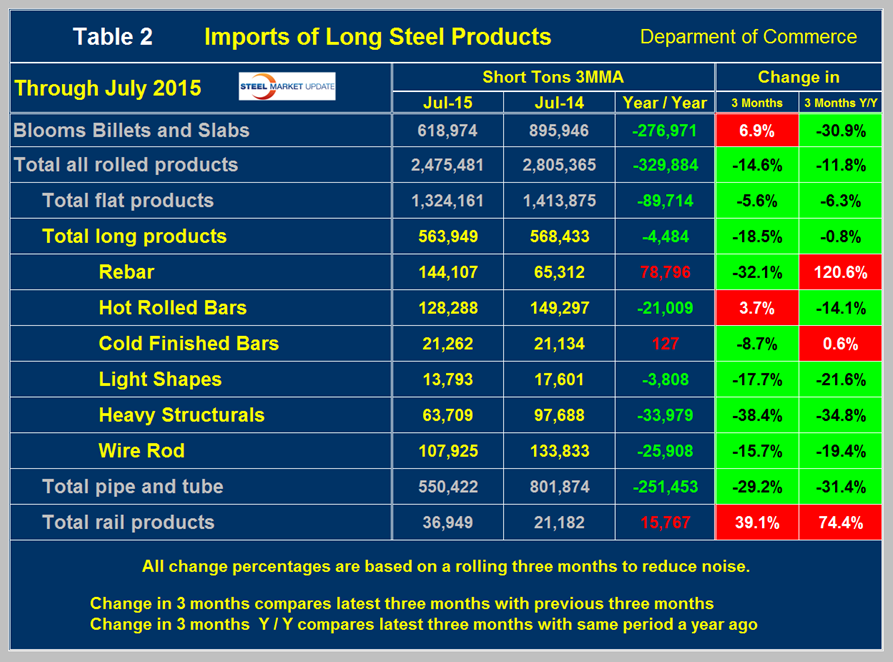
For total long products the tonnage was down by 18.5 percent 3M/3M and by 0.8 percent Y/Y. In the 3M/3M comparison, the only product having an import increase was hot rolled bars. Imports of pipe and tube declined by 29.2 percent 3M/3M but rail products were up by 39.1 percent.
Figure 3 shows the import market share of long and flat products through May which is the latest data available for total steel supply.
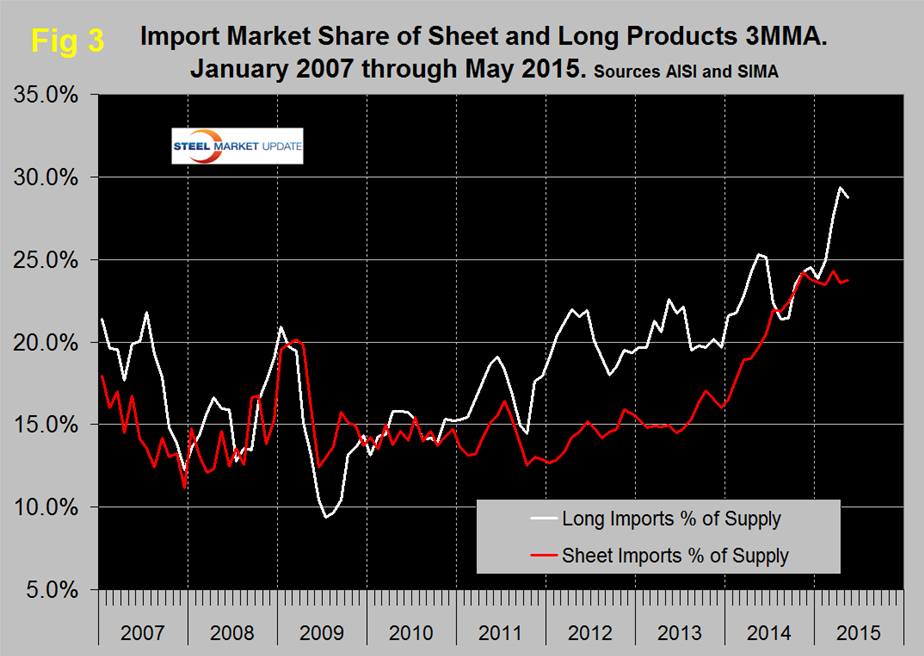
For long products the import share skyrocketed in January through April but declined slightly in May. The import market share for sheet products has stabilized in the last nine months and now stands at 23.7 percent.


