Market Data

September 21, 2015
Service Center Sheet Apparent Excess Jumps to +839,000 Tons
Written by John Packard
We finally got our Flat Rolled Steel Service Center Apparent Excess/Deficit Inventory forecast model back on track. As we mentioned last month, SMU had been operating under a much more optimistic frame of mind and this past month we pulled back on our expectations and by doing so we came very close to nailing both flat rolled steel shipments and inventory levels out of the U.S. flat rolled steel service centers.
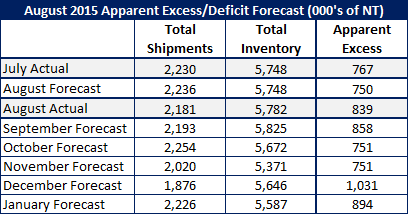
For the month of August we forecast that daily shipments would be 5 percent lower than last year and that total shipments would equal 2,236,000 tons. Actual shipments were slightly lower with total tonnage being 2,181,000 tons. We missed our shipment forecast by 55,000 tons.
Total inventories came in slightly higher than what we had forecast for the month of August. Carbon sheet inventories were reported by the MSCI at 5,782,000 tons versus our forecast of 5,748,000 tons. We missed hitting our inventory number by 34,000 tons…
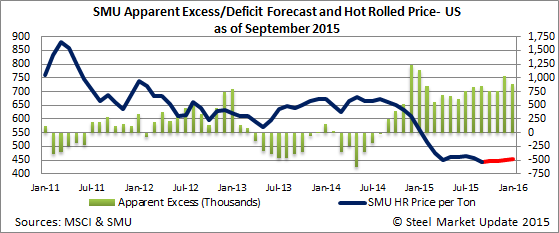
Based on our balanced inventory model we now have the U.S. steel service centers holding an Apparent Excess of sheet inventories totaling 839,000 tons. This is higher than last month (767,000 tons) and a little higher than we had forecasted a month ago. Our forecast was for inventories to continue at high levels (750,000 tons) but the combination of lower shipments and slightly higher receipts accounted for the difference between the actual number and our forecast.
Forecast
We are not going to go against the trend for shipments which has been slowing. As Peter Wright mentioned in his MSCI analysis, “The fact that the single month y/y growth comparison is worse than the three year comparison is an indication that momentum is negative and growth is slowing.”
Over the past six months the average negative growth pattern compared to the 3 year average for service center shipments has been minus 6.5 percent (-6.5 percent). The negative growth pattern began in March (-1.6 percent) then April (-6.6 percent), May (-8.3 percent), June (-9.1 percent), July (-6.6 percent) and now August at -7.0 percent. Will September continue to show negative shipments year over year? We believe the trend will continue.
September has 21 shipping days this year (same as last year). Last year (2014) flat rolled service centers shipped an average of 111,700 tons per day which was down slightly from August and represented a 1.2 percent growth over the previous year (2013).
We forecasted last month that shipments would be down 5.0 percent year over year for the months of August, September, November and December. We are going to get even more conservative and reduce our estimates to reflect what we have seen over the past six months (compared to the three year average) and reduce shipments to -6.5 percent compared to the previous year
This takes September daily shipment rate to 104,400 tons per day or a total of 2,181,200 tons of shipments over the 21 days in September.
We have been very close with our receipt forecast and we are going to continue with the minus 5 percent (below the three year average) for the months of September and October and increase it to minus 10 percent in November, December and January. Even with the lower receipt levels we do not get anywhere near balanced inventories as you can see by the table below.
In order to improve inventories we need to see a dramatic improvement in the demand trend. Alan Beaulieu of the Institute for Trend Research projected a better 2016 than 2015 but the end of the year of 2015 was going to be weak.
SMU is of the opinion that it will take into late first quarter and possibly as late as second quarter before we see a major reduction in inventories at the flat rolled steel distributors.
Price Forecast
With the excessive inventories looking like they will remain through the balance of calendar year 2015 and into 1st Quarter 2016 we are holding our Momentum Indicator at “Neutral” with benchmark hot rolled prices to remain within a very narrow range of $420-$460 per ton. At the moment our HRC price average is $440 per ton and is the lowest of all of the averages followed by SMU. We believe domestic spot prices could trade as low as $400 per ton to extremely large buyers and there could be further weakening should US Steel and ArcelorMittal not have any labor issues (lockout) and foreign steel imports take longer to dip below 24 percent of the overall market.
On the upside we would need to see an extended work outage at one (or both) of the integrated steel mills (USS/AM) and an uptick in demand. As we mentioned earlier, we do not believe the demand scenario is there through the end of the year and we are not yet convinced that the mills will lockout the union. We spoke with an financial analysts who met with Mario Longhi recently and left with the opinion that US Steel will not lockout the union (and the union is not going to strike). We think we will have more clarity on this subject once we move into the month of October and once we get some sort of resolution at ATI.
As you all know – forecasting flat rolled prices is not something that we advertise or claim to be experts at. So, take our numbers with a grain of salt and provide us with your opinion as to where you see prices headed over the next 5-6 months. You can reach us at: info@SteelMarketUpdate.com.