

Market Data

September 28, 2015
Key Market Indicators - September 27, 2015
Written by Peter Wright
An explanation of the Key Indicators concept is given at the end of this piece for those readers who are unfamiliar with it.
The total number of indicators considered in this analysis is currently 36.
![]()
Please refer to Table 1 for the view of the present situation and the quantitative measure of trends. Readers should regard the color codes in the present situation column as a quick look at the current market condition. This is a subjective analysis based on our opinion of the level of each indicator. The “Trend” columns of Table 1, are also by their color codes designed to give a quick visual appreciation of the direction in which the market is headed. However the quantitative analysis of the value and direction of each indicator over time are the latest “facts” available. There is nothing subjective about the trends section which is designed for those readers who want to dig deeper. All data included in this table was released in September, the month or specific date to which the data refers is shown in the second column from the far right and all data is the latest available as of September 26th.
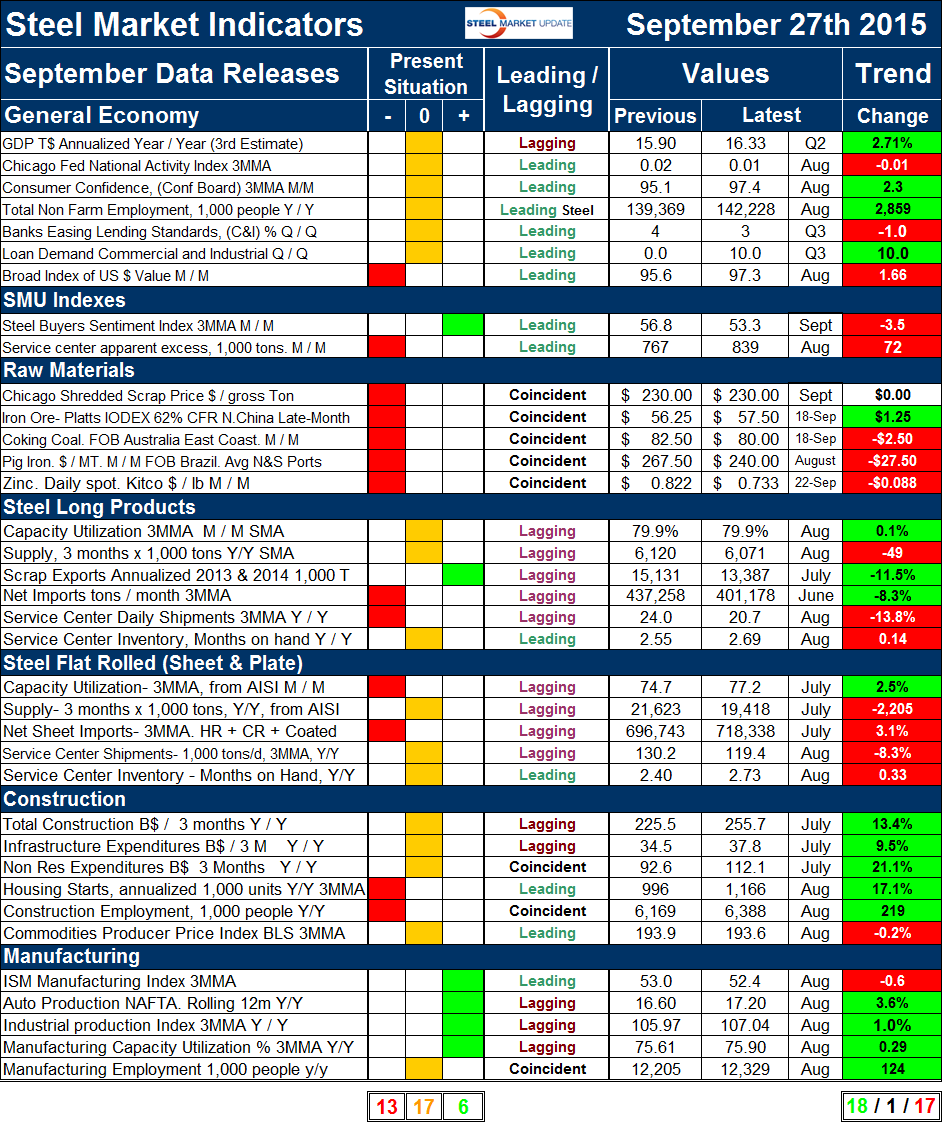
Present Situation. There was no change in the classification of the present situation since we last published this analysis on August 30th. Six of the thirty six indicators are rated as positive at present, seventeen are neutral and thirteen are negative. In the general economy section except for the value of the US $ which we regard as a negative, all other indicators are ”OK” meaning that by historical standards they are mid-range, neither great nor problematic. GDP growth in the 2nd Q was revised up again last week but the trailing 12 month value at 2.72 percent was below the 3.0 percent threshold that we consider to be positive. Of the SMU proprietary indexes, the steel buyer’s sentiment continues to be positive and service center excess inventory continues to be negative, both have been unchanged in the last eleven months. All the raw material indexes are negative at present meaning that their low prices are indicative of a general situation of oversupply and weak pricing power. Capacity utilization of the long product mills is classified as neutral and of the flat roll mills as negative. This is not an apples and apples comparison because the performance of the long product mills is based on SMA data and of the flat rolled mills on AISI data. There is a difference in mill participation rates between these organizations and the SMA data is one month more current. The apparent supply of both long and flat products is rated as neutral, net imports are negative for both and service center inventories measured as months on hand are neutral for both. As we have reported constantly since the recession, service center shipments of long products have had a dismal recovery and flat products shipments are historically on the weak side of OK with sheet being better than plate. The construction indicators are currently weak to OK and manufacturing indicators are OK to strong.
Trends. Eighteen of thirty six indicators were trending positive on September 27th which was a decrease six since the August 30th update. Seventeen are trending negative and one, the price of Chicago shredded was unchanged. At first glance this is quite a severe deterioration but it was strongly influenced by a strong result last month. Compared to July the number of indicators trending negative is only up by one. In spite of all the negatives in today’s press, the sky is not falling as indicated by the fact that half the indicators we consider are still trending positive. This analysis is in general agreement with the SMU steel buyers sentiment index.
Changes in the individual sectors are described below. (Please note in most cases this is not September data but data that was released in September for previous months.)
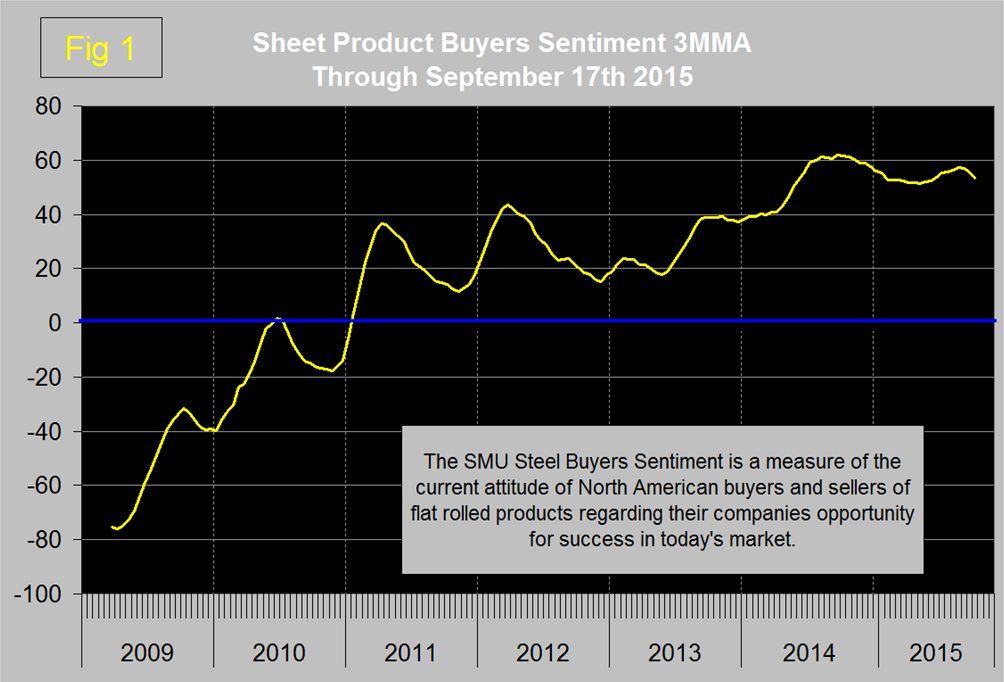
In the general economy there was one trend reversal and this was very slight. The Chicago Fed National Activity Index changed from + 0.08 in July to – 0.01 in August. Both results are almost exactly on the neutral threshold meaning that the economy is expanding at a historically normal rate. The trade weighted value of the US dollar which had been declining in May took off again in June, July and August a trend that we regard as a negative for net steel imports. The trends of the two Steel Market Update proprietary indicators were both positive in June and July saw a reversal in the service center excess value in August and a reversal of steel buyer’s sentiment in September with the result that both trended negative in this latest report. Steel buyer sentiment declined to 53.3 on September 17th from 56.8 on August 20th but as shown in Figure 1 is still at a historical high level.
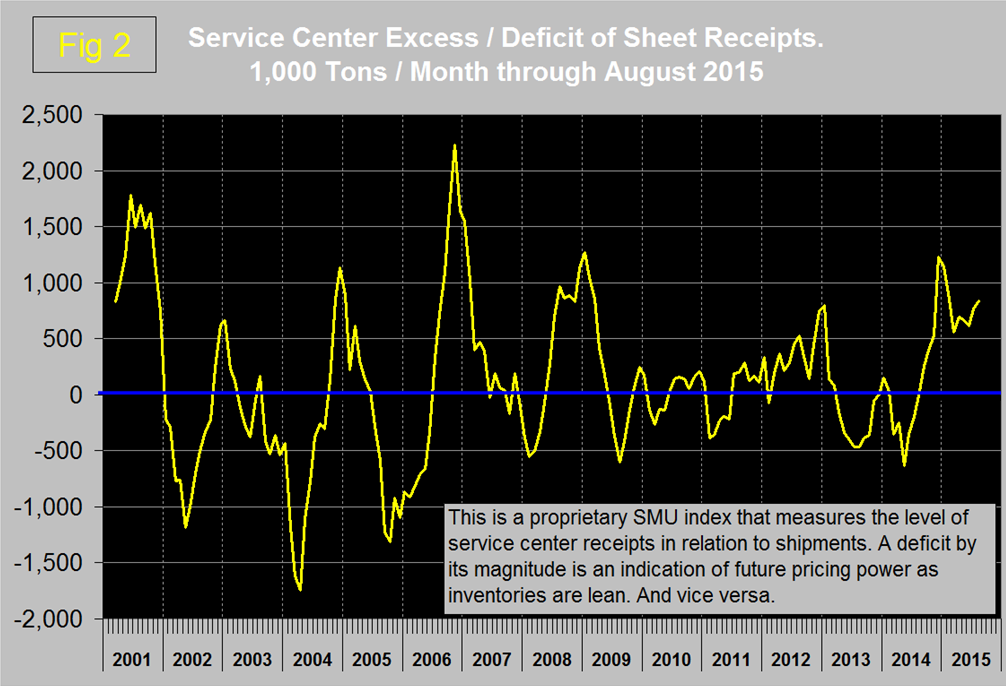
Service center excess which increased from 767,000 tons to 839,000 tons. We regard this as indicative of weak pricing power going forward (Figure 2).
All five of the steel raw materials prices that we track here declined in July but in our August update, the Platts IODEX iron ore price delivered N. China and coking coal FOB Australia’s E. Coast both enjoyed small price increases. In September iron ore had another small increase to $57.50 from $56.25 in August but coking coal went into reverse and declined to $80.00 from $82.50 in August. Chicago shredded dropped $35 in August and held steady at $230 in September, we expect another $20 decline in October. There were no trend reversals for the long product market indicators. Flat rolled had an increase of one in the negative category as net sheet imports increased to 718,338 tons. In Our August 30th update, all the construction and manufacturing indicators were trending positive. In this latest update, two have had a trend reversal. The producer price index of commodities declined in the August value published by the Bureau of labor Statistics. We regard this indicator as leading for industrial construction projects, a large proportion of which are energy related. The ISM manufacturing index contracted in the August data published by the Institute of Supply Management.
We believe that a continued examination of both the present situation and direction of these 36 indicators is a valuable tool for corporate business planning. SMU has several benchmark analyses that show steel demand has recovered more slowly than the general economy and is still not where it should be at this stage of a recovery.
Explanation: The point of this analysis is to give both a quick visual appreciation of the market situation and a detailed description for those who want to dig deeper. It describes where we are now and the direction in which the market is headed and is designed to give a snapshot of the market on a specific date. The chart is stacked vertically to separate the primary indicators of the general economy, of proprietary Steel Market Update indices, of raw material prices, of both flat rolled and long product market indicators and finally of construction and manufacturing indicators. The indicators are classified as leading, coincident or lagging as shown in the third column.
Columns in the chart are designed to differentiate between where the market is today and the direction in which it is headed. It is quite possible for the present situation to be predominantly red and trends to be predominantly green and vice versa depending on the overall direction of the market. The present situation is sub-divided into, below the historical norm (-) (OK), and above the historical norm (+). The “Values” section of the chart is a quantitative definition of the market’s direction. In most cases values are three month moving averages to eliminate noise. In cases where seasonality is an issue, the evaluation of market direction is made on a year over year comparison to eliminate this effect. Where seasonality is not an issue concurrent periods are compared. The date of the latest data is identified in the third values column. Values will always be current as of the date of publication. Finally the far right column quantifies the trend as a percentage or numerical change with color code classification to indicate positive or negative direction.


