

Prices

November 6, 2015
Flat, Long, and Semi-Finished Steel Imports Analysis
Written by Peter Wright
License data for October was updated on November 3rd through the Steel Import Monitoring System of the US Commerce Department. At SMU we perform a detailed analysis of this data, an explanation of our methodology is given at the end of this write up.
![]() Total rolled product licensed imports in the single month of October were 2,269,273 short tons up by 8.7 percent from the preliminary September volume. We prefer not to dwell on single months results because of the extreme variability that can occur in individual products. In the comments below we use three month moving averages (3MMA) to get a more representative picture. The 3MMA through October was 2,249,408 tons, down by 3.5 percent from September. On the same basis flat rolled was down by 6.8 percent, long products up by 7.6 percent and pipe and tube down by 7.2 percent.
Total rolled product licensed imports in the single month of October were 2,269,273 short tons up by 8.7 percent from the preliminary September volume. We prefer not to dwell on single months results because of the extreme variability that can occur in individual products. In the comments below we use three month moving averages (3MMA) to get a more representative picture. The 3MMA through October was 2,249,408 tons, down by 3.5 percent from September. On the same basis flat rolled was down by 6.8 percent, long products up by 7.6 percent and pipe and tube down by 7.2 percent.
Figure 1 shows the 3MMA through October licenses for semi-finished, flat and long products.
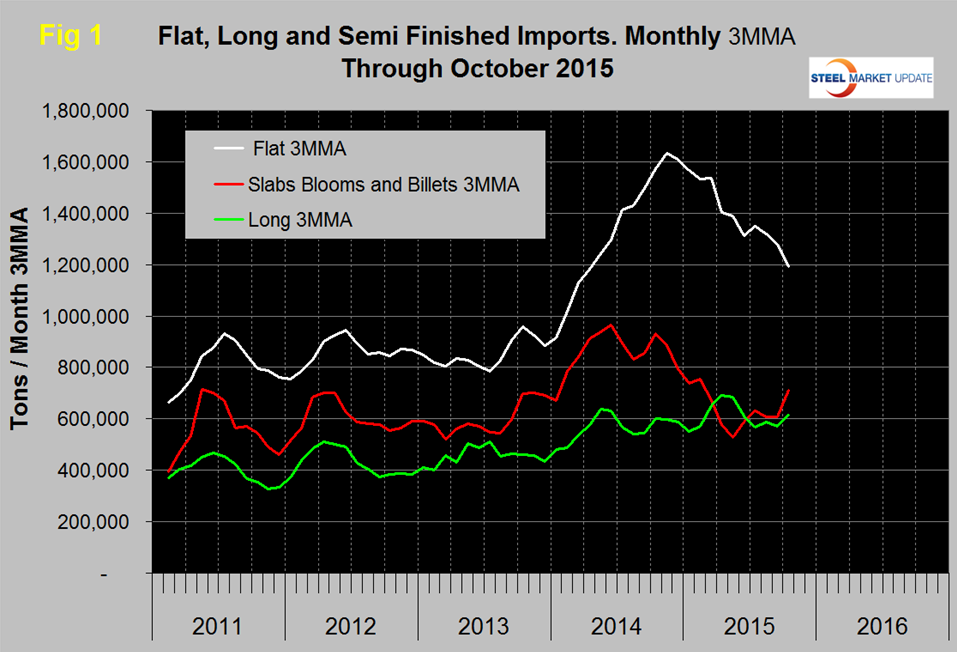
Flat includes all hot and cold rolled sheet and strip plus all coated sheet products including tin-plate plus both discrete and coiled plate. The 3MMA of flat rolled imports peaked at 1,634,000 tons in November last year and has since declined to 1,192,320 tons in October. In October last year the 3MMA of semi-finished imports was 930,000 tons, this volume declined to 527,000 tons in May and has since increased to 712,000. Long product imports have been stuck in the range 519,000 tons to 772,000 tons since March last year with no particular trend evident. In October the 3MMA of long product imports was 615,469 tons.
Figure 2 shows the trend of sheet and strip products since January 2011.
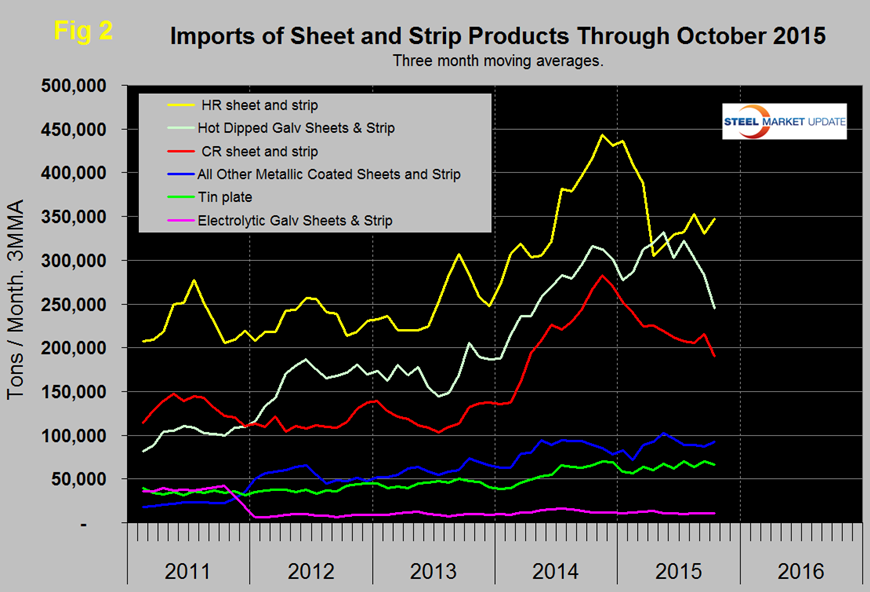
Of the big three tonnage items, HR, CR and HDG, hot rolled which was down by 21.2 percent in April steadily increased in May through August, declined in September then increased again in this latest data. Cold rolled peaked at 283,000 tons in November and has steadily declined since then with a small upward blip in September. Hot dipped galvanized imports increased in February through May and have been on a downward trend since then. All other metallic coated (mainly galvalume) and tin plate have been relatively flat for the last four months. Electro-galvanized keeps on rolling along with little change in three years.
Table 1 provides an analysis of major product groups and of sheet products in detail.
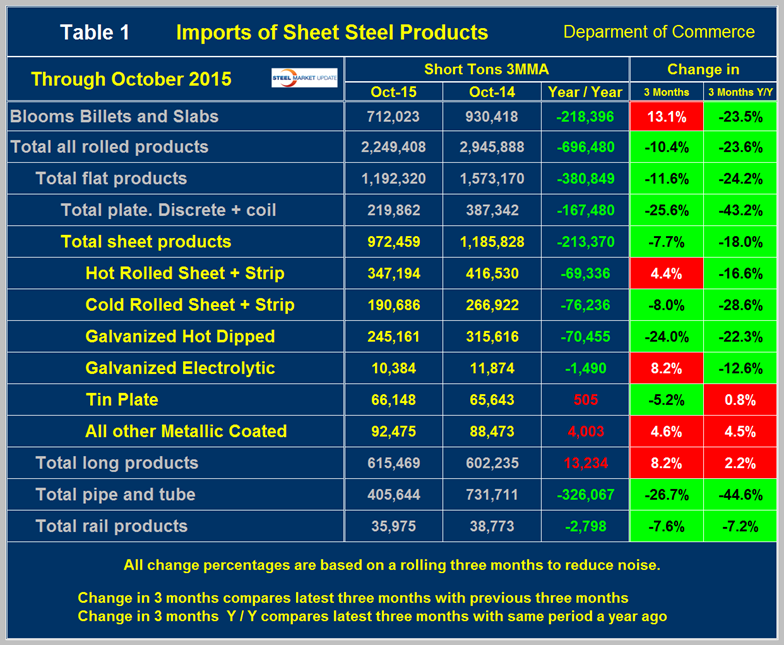
It compares the average monthly tonnage in the latest three months through October with both three months through July (3M/3M) and three months through October last year (Y/Y). Semi-finished slabs, blooms and billets were up by 13.1 percent 3M/3M but down by 23.5 percent Y/Y. The total tonnage of hot worked products was 2,249,408 tons in October on a 3MMA basis, down by 696,480 tons from October last year. The total hot worked tonnage was down by 10.4 percent 3M/3M and down by 23.6 percent Y/Y. These trends indicate that in the big picture the peak of import volume has passed but there are still some short term blips. The color codes in Table 1 for the three month and year over year change show which products are improving and which have still experienced import volume increases in these two time frames. It sometimes seems to us as we write these reports that we are contradicting ourselves but if readers use the tables for short term evaluation and the graphs for long term then our analysis should make sense.
Table 2 shows the same analysis for long products.
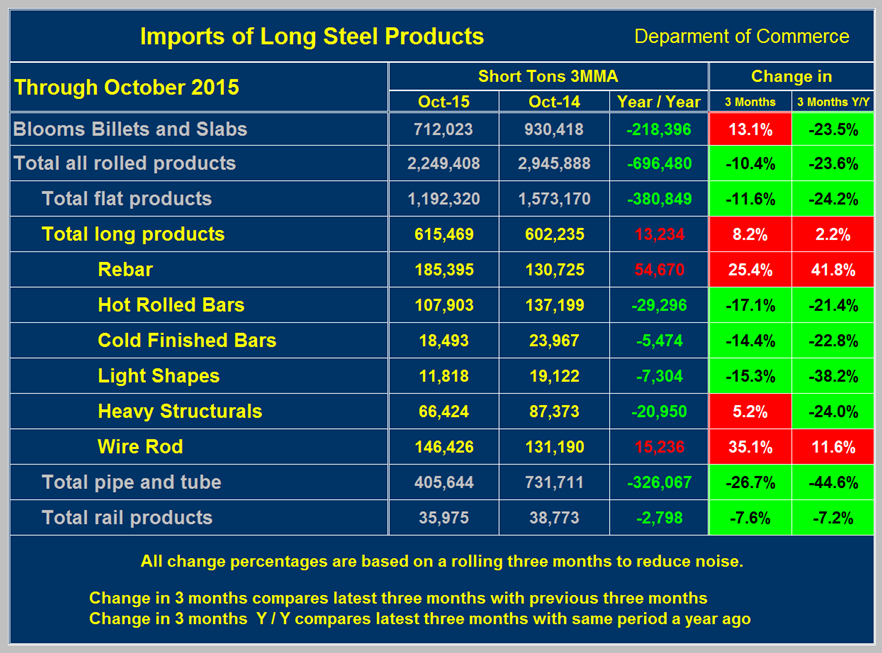
For total long products the tonnage was up by 13,234 tons Y/Y which was 2.2 percent. In 3M/3M the volume was up by 8.2 percent. Rebar and wire rod had substantial increases in both time comparisons and heavy structurals were up 3M/3M. Imports of pipe and tube declined by 26.7 percent 3M/3M and by 44.6 percent Y/Y. Rail products have been in a fairly narrow range since January last year.
Figure 3 shows the import market share of sheet and long products through August which is the latest data available for total steel supply.
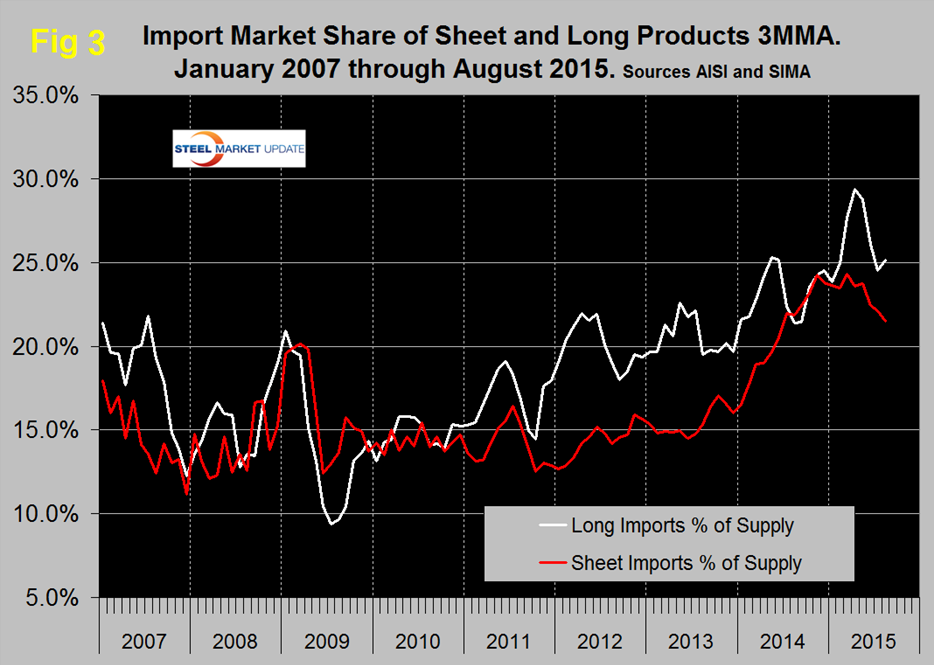
The import market share of sheet products peaked at 24.3 percent in March and fell to 21.5 percent in August. For long products the import share skyrocketed in January through April then declined sharply in May, June and July with a small uptick in August.
Explanation: The SMU publishes several import reports ranging from this very early look using licensed data to the very detailed analysis of final volumes by product, by district of entry and by source nation which is available on the premium member section of our web site. The early look, the latest of which you are reading now has been based on three month moving averages (3MMA) using the latest licensed data, preliminary data for the previous month and final data for earlier months. We recognize that the license data is subject to revisions but believe that by combining it with earlier months in this way gives a reasonably accurate assessment of volume trends by product as early as possible. We are more interested in direction than we are in absolute volumes at this stage. The main issue with the license data is that the month in which the tonnage arrives is often not the same month in which the license was recorded. In 2014 as a whole our data showed that the reported licensed tonnage of all carbon and low alloy products was 2.3 percent less than actually receipts, close enough we believe to confidently include licensed data in this current update. The discrepancy declined continuously during the course of the twelve month evaluation as a longer time period was considered.


