

Market Data

December 28, 2015
Currency Update for Steel Trading Nations
Written by Peter Wright
On December 16th the Federal Reserve raised the federal funds rate for the first time in almost a decade.
![]()
In the United States, the federal funds rate is “the interest rate” at which depository institutions (banks and credit unions) actively trade balances held at the Federal Reserve, called federal funds, with each other, usually overnight, on an uncollateralized basis.
Currency traders make bets on their assumptions of what central banks will do. Approaching the previous FOMC meeting in September the dollar strengthened in anticipation of a rate increase. Then about six days ahead of the September 17th announcement, the smart money correctly concluded the Fed would not act and the dollar gave back some gains. This did not happen prior to the December 16th meeting when the Fed finally pulled the trigger. Figure 1 clearly shows these gyrations, FOMC meetings circled in red.
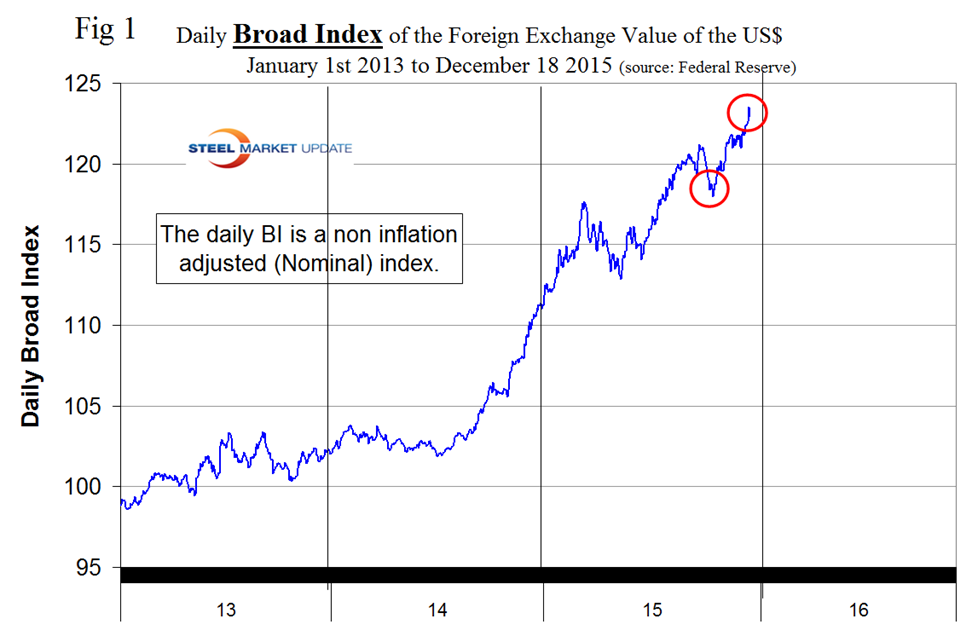
Figure 2 shows schematically when the 17 individual members of the board of the Federal Reserve expect interest rates to increase and by how much.
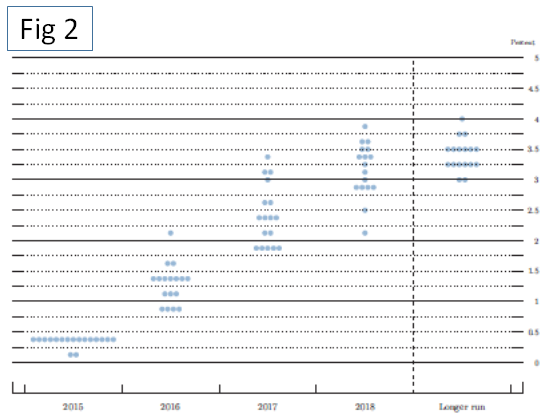
This is known as a “dot plot.” There is a wide spread between the member’s thoughts for the next three years.
As of December 25th, the latest data for the Broad Index value of the US $ against the currencies of our major trading partners was December 18th, two days after the increase in the federal funds rate and seven days behind the individual steel trading currency data that we are presenting here. This is important because currencies are volatile in the current environment where the US is raising interest rates and Europe and Japan are intensifying quantitative easing. The daily BI peaked on December 17th at 123.5, its highest value since March 2003. On December 18th it fell to 122.9
On December 18th, Jeremy Siegel wrote, “On December 16th, the Federal Reserve raised rates by 25 basis points (bps), effectively raising its target band for the Federal Funds Rate to 25-50 bps. A widely anticipated move, it is an important and positive development for risk markets such as equities in that it removes a level of uncertainty. Following that decision, Fed chairman Janet Yellen’s statement was generally dovish, placing a large emphasis on “gradual” rate hikes in the upcoming months. The dot plots that reflect projections from members of the Fed committee suggest that median estimates for Fed fund rates in 2016 lie between 1.25 and 1.50 percent. This implies there will likely be four rate hikes in 2016.
“While many ponder the unintended consequences of the Fed keeping rates low over the past seven years, academic research has shown that market forces have largely contributed to these low rates, namely outsized demand for ‘safe’ liquid assets. To add fuel to the fire, record-low inflation, low economic growth, high risk aversion and an aging investor class are also partly responsible for this risk aversion. It was a combination of risk aversion and low growth that have kept rates this low for this long.”
This month we have decided to take a closer look at the effect of the Fed’s actions on the currencies of the 16 countries of most interest to steel executives. Table 1A shows the number of currency units of steel trading nations that it took to buy one US dollar on December 17th, the day the BI peaked and one day after the Fed’s announcement.
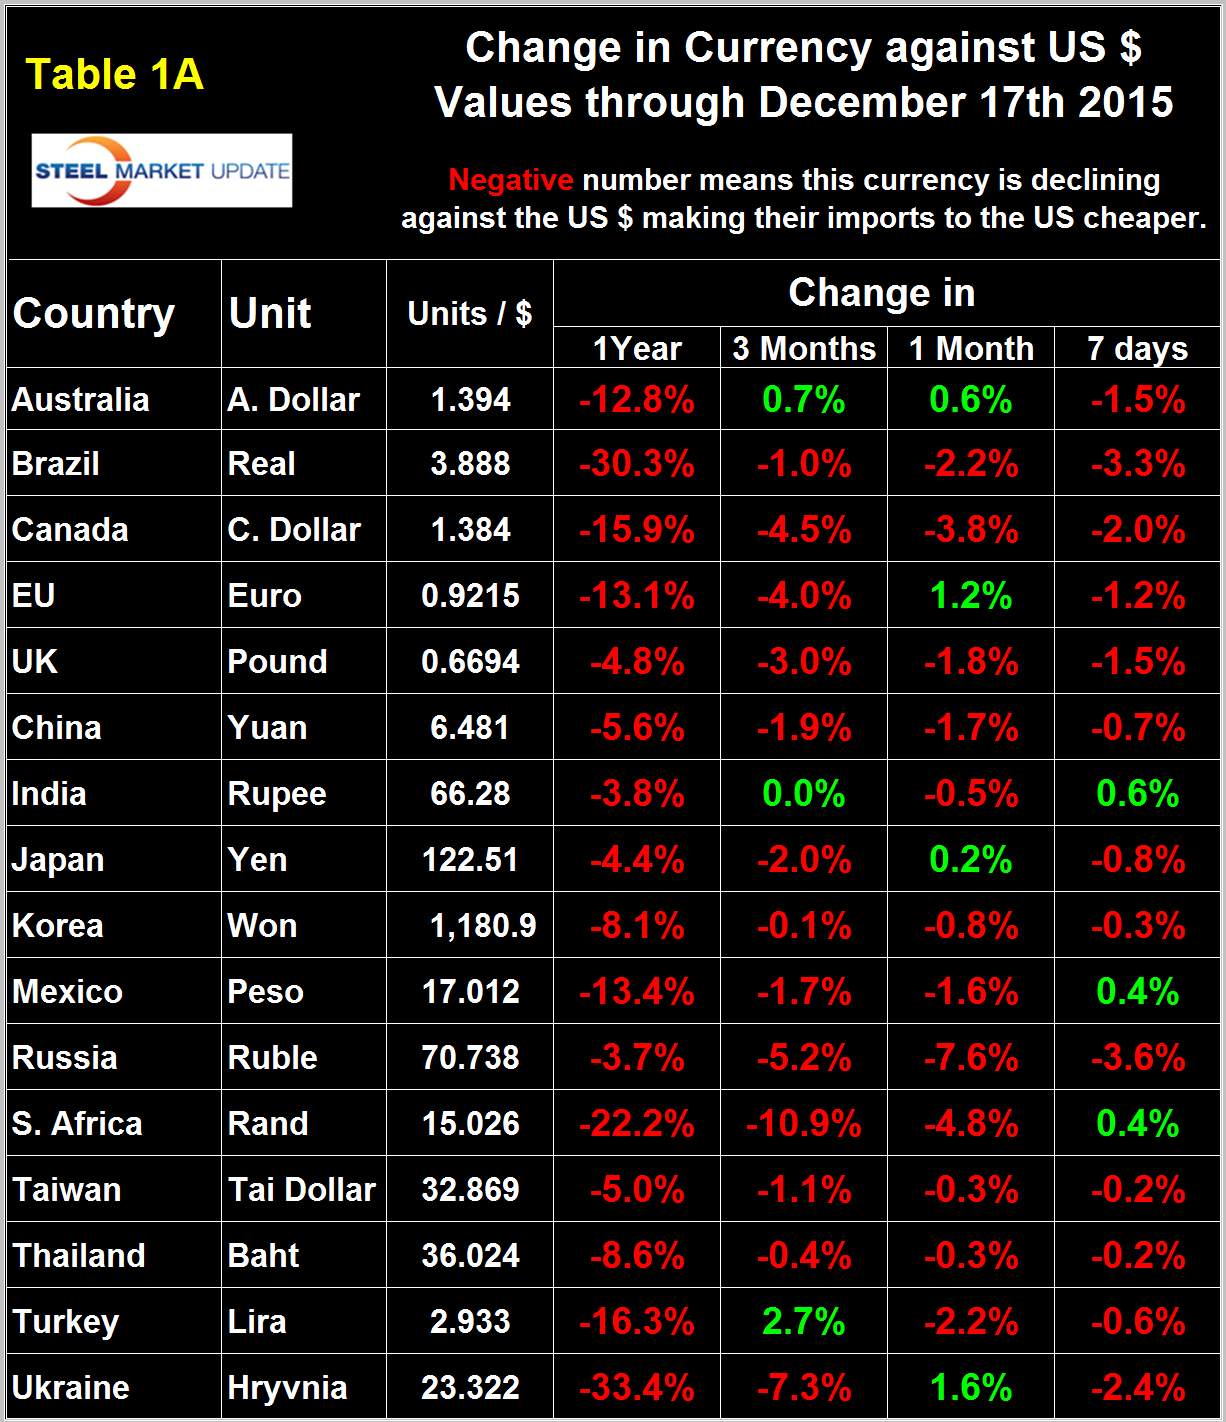
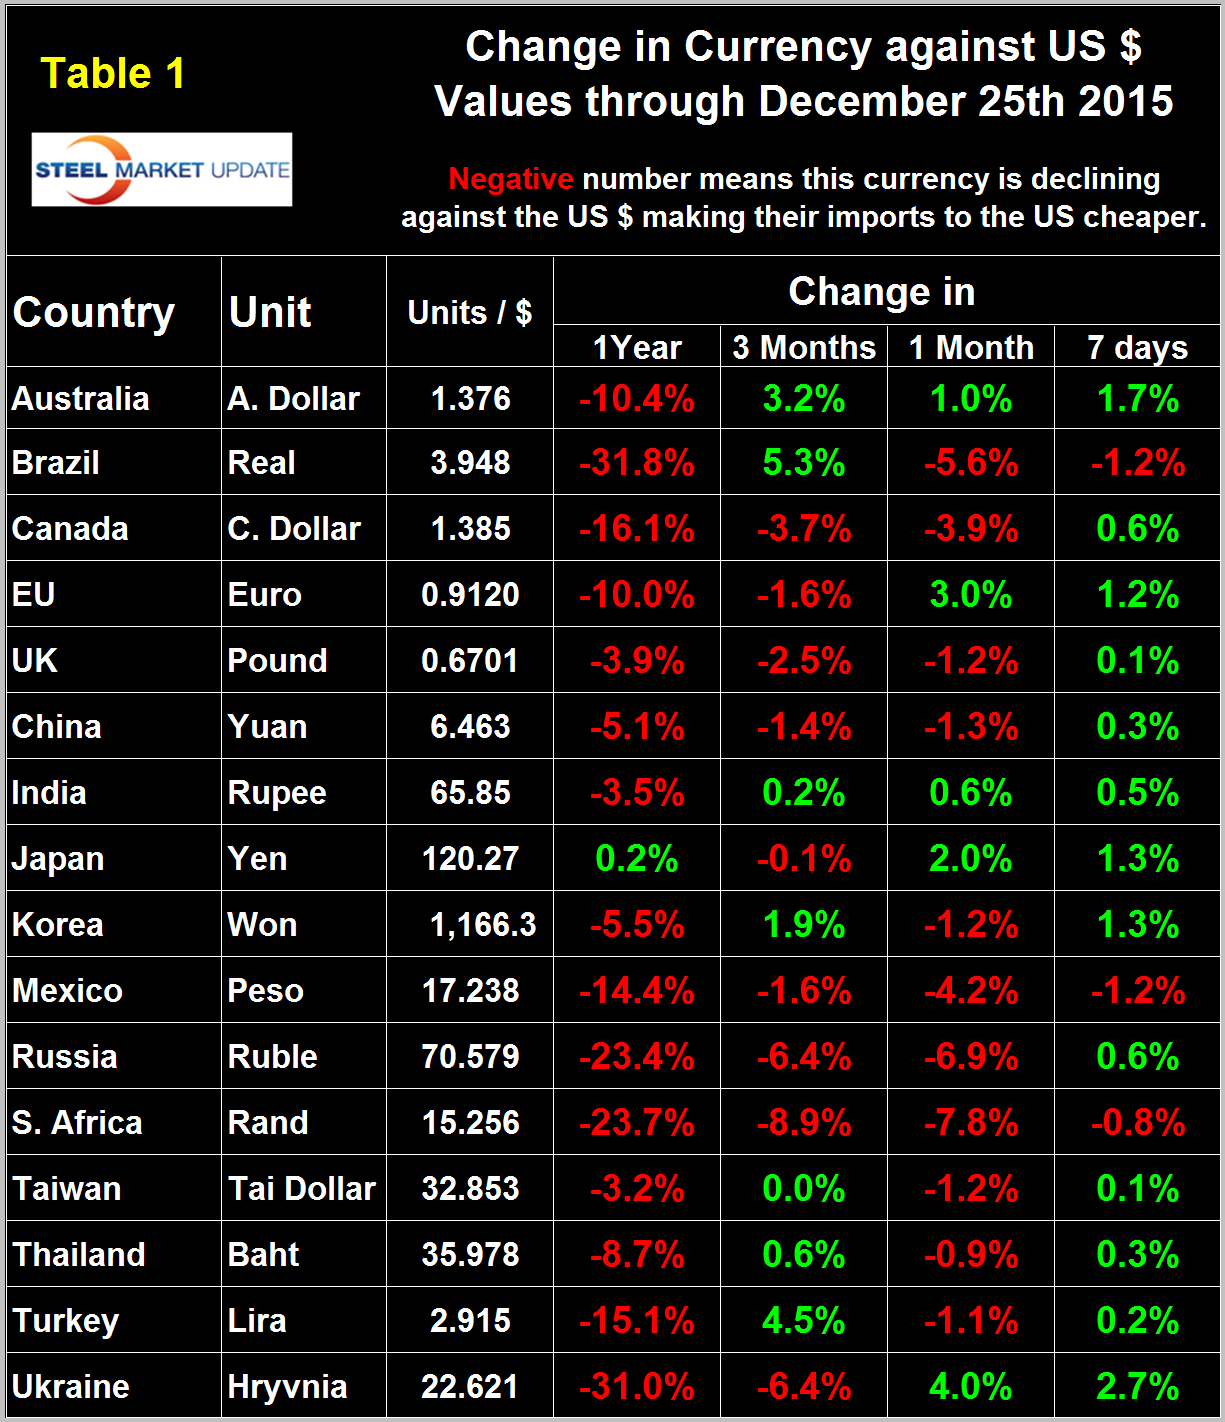
The table also shows the change in one year, three months, one month and seven days for each currency and is color coded to indicate strengthening of the dollar in red and weakening in green. We regard strengthening of the US Dollar as negative and weakening as positive because the effect on net imports. In 2014, 25 percent of the U.S. economy was related to international trade, therefore, currency swings can have a huge effects on the economy in general and of the steel industry in particular. In the seven days before the 17th the dollar strengthened against 13 of the 16 currencies under consideration as traders increased their dollar positions to obtain a better return on their assets. As stated above, the BI peaked on the 17th and declined on the 18th, which may or may not be the start of a new trend. However, our data for the 16 steel currencies goes through the 25th and, in the 8 days between the 17th and the 25th, the dollar did a complete reversal and weakened against 13 of the 16 steel and raw materials trading currencies (Table 1).
Does this mean the currency traders over-bought the dollar and then decided to reduce their positions? We don’t know the answer to that and limit ourselves to providing facts that we find significant for their implications for steel trade both into and out of the US.
In each of these reports we comment on a few of the 16 steel trading currencies listed in Table 1 and include extracts from sources that we have come across and that we deem credible. Charts for each of the 16 currencies listed in Table 1 are available through December 25th for any reader who requests them.
The Euro
On December 25th it took 1.0965 US dollars to buy one Euro (Figure 3).
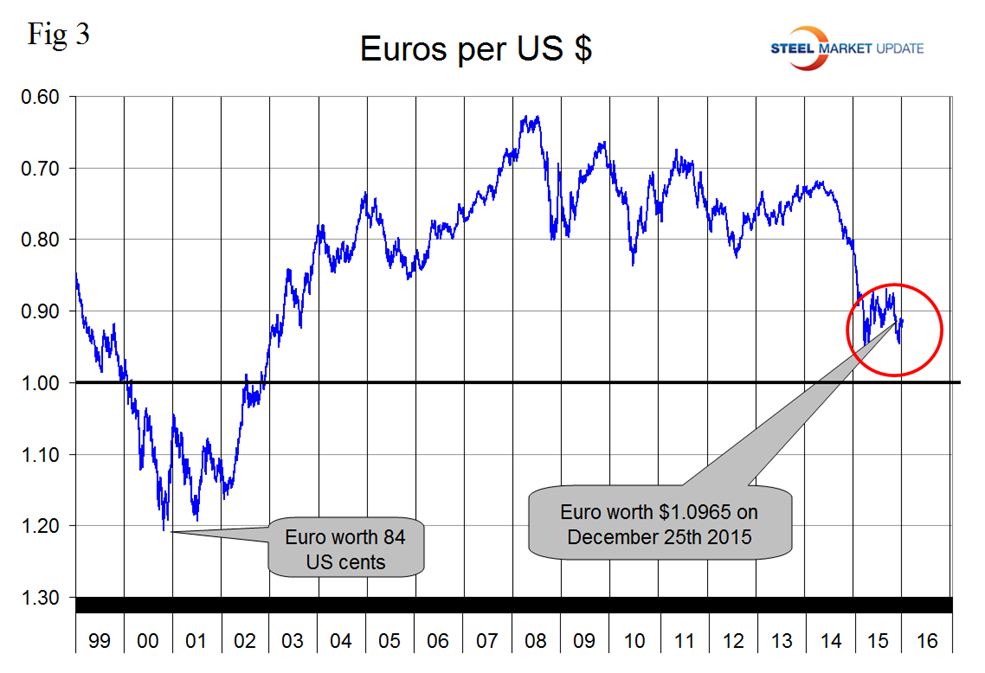
Through that date the Euro had weakened by 10.0 percent in one year and had strengthened by 3.0 percent in the last month. In the seven days prior to December 17th the Euro was down by 1.2, in the seven days prior to the 25th it was up by 1.2 percent. The euro has been under pressure because of the monetary policy divergence between the Fed and the ECB. Mario Draghi, ECB President, famously said in 2012 that he would do “whatever it takes” and investors are now getting ready for another round of stimulus.
The Brazilian Real
On December 25th the Brazilian Real was worth $ 0.253, it has lost 31.8 percent of its value in the last year and 5.6 percent in the last month (Figure 4).
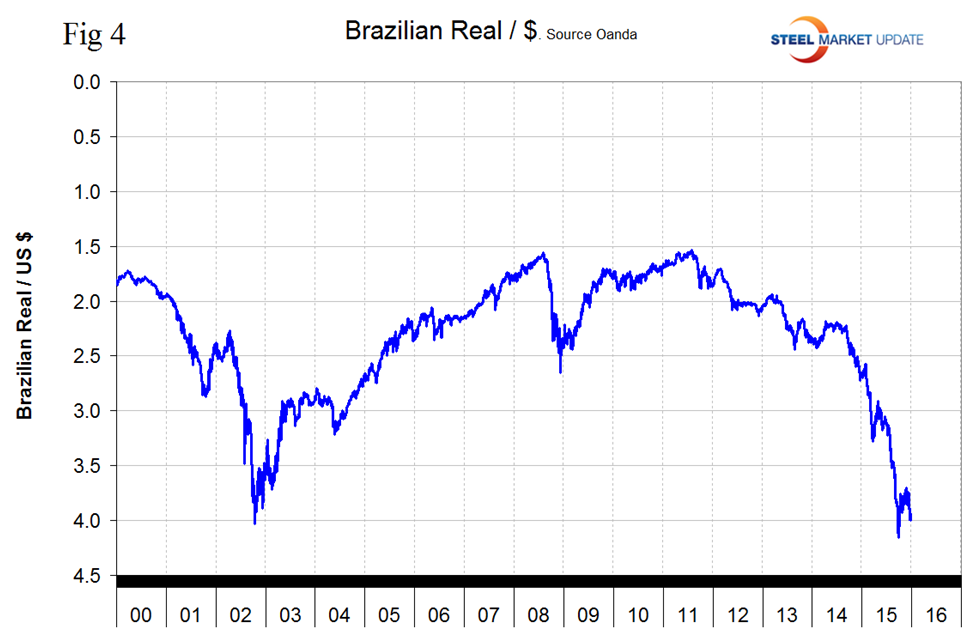
On December 22nd Bret Jensen of Premium Research wrote: things are likely to get much worse before they get any better. The country is being wracked by the largest corruption scandal in its history that has implicated most of the political leaders of the country, including its president who had impeachment proceedings recently implemented against her. Unfortunately, due to the agreed upon structure of these procedures, the president is likely to stay in office despite approval ratings hovering around 10 percent.
This is unlikely to help the dismal mood of the country and will distract political focus on fixing the economy and debt situation. Expect to see widespread protests later in 2016 as the Olympics are hosted by the country.
Throughout 2015, the country’s sovereign debt has faced continuous downgrades and has recently entered into junk territory. This will cause Brazil to pay higher interest rates on any new debt and worsen an already dismal budget outlook.
The Canadian Dollar
On December 25th the Canadian dollar was worth 72.2 US cents, it was down by 16.1 percent in one year and by 3.9 percent in the last month (Figure 5).
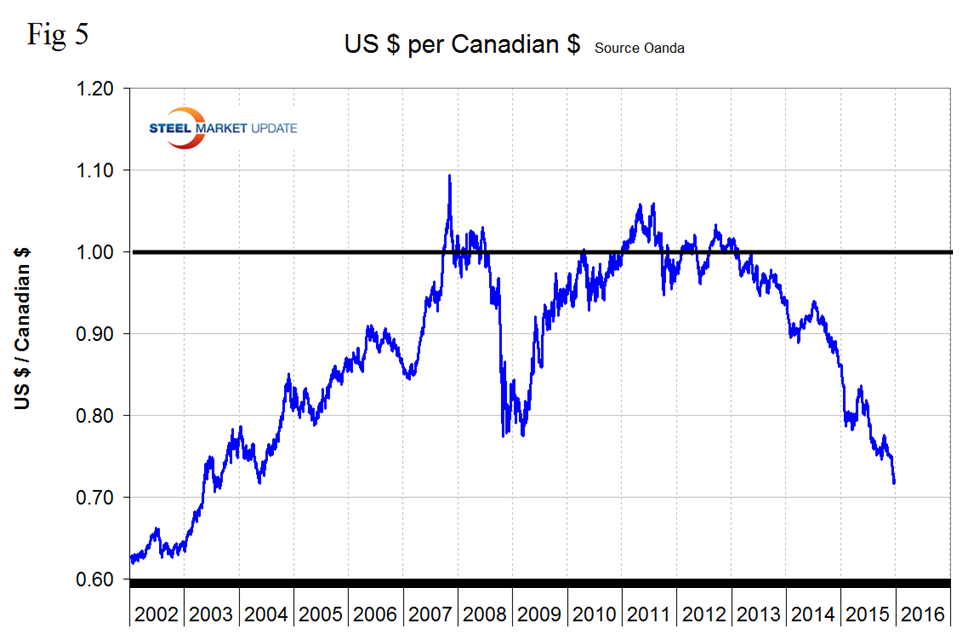
On December 26th the Market Master, an independent Financial Education and Discretionary blog wrote, “Despite the fall in oil prices, the Canadian economy is beginning to show signs of a bottom and turnaround, with GDP growth looking to have taken a turn back up. Canadian employment data also suggests that a falling unemployment rate, coupled with rising average hourly wages, indicates the resilience of the job market in Canada despite the pain felt in the oil industry. Business and consumer confidence also continue to tick up despite all that has happened with oil which should bode well for the future of the Canadian economy in terms of economic momentum and growth as businesses begin to invest in growth again. This should be especially evident if oil finds a bottom as expected and rebounds accordingly which would help lift the oil sector in Canada. With the continued resilience in the Canadian economy and a potential recovery in oil prices, it is likely that the Canadian economy should have a good 2016, especially given the expected continued economic growth outlook for the US economy in 2016. This should eventually lead to the BOC having a change in monetary policy stance which should lead to significant CAD appreciation in 2016.”
The Japanese Yen
On December 25th it took 120.27 Yen to buy one US dollar. The Yen was up by 0.2 percent in one year and by 2.0 percent in the last month (Figure 6).
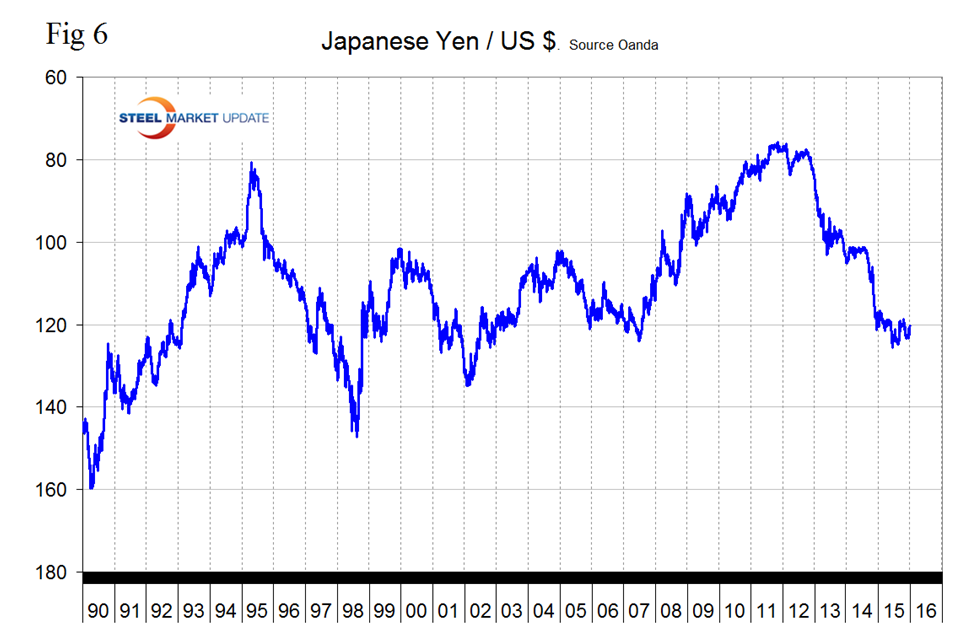
The Asian Development Bank (ABD) released data last week showing just how far China has usurped Japan’s regional export dominance. The latest report on the high-tech industry shows that China’s regional export share rose to 43.7 percent in 2014 from 9.4 percent in 2000; whilst Japan’s share slid to 7.7 percent last year from 25.5 percent in 2000. A further attempt to weaken the Yen must be very tempting to Japan, especially as China is expected to be doing some currency devaluation of its own in the near future. Observers and pundits are becoming concerned about the inertia of the BOJ, whilst the ECB is noisily expanding QE and the PBoC is stealthily weakening the yuan.
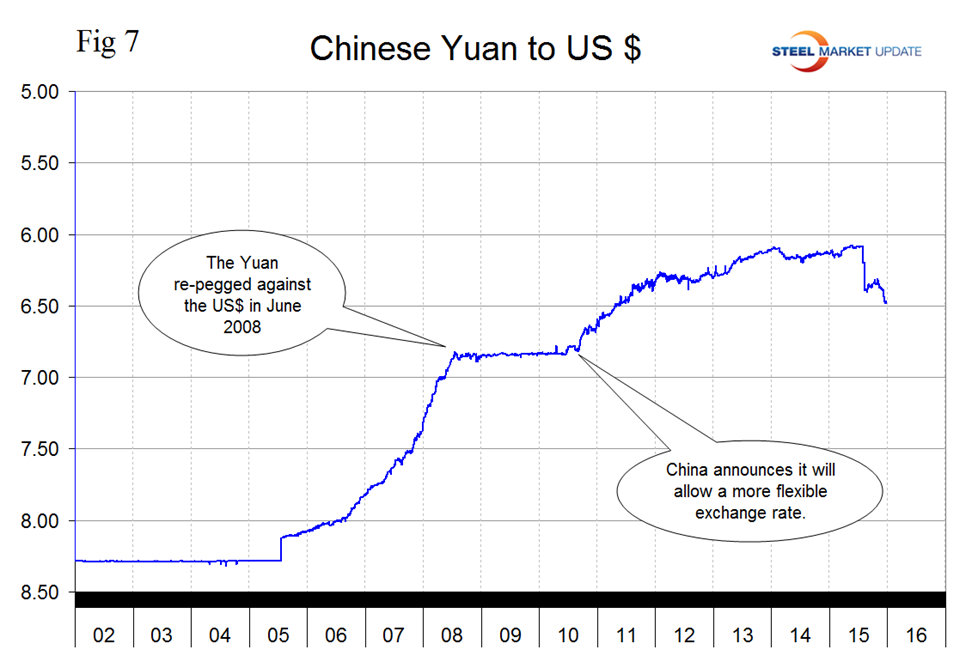
The Chinese Yuan
Following the devaluation in August the Yuan bottomed out at 6.4028 on August 27th. Then it recovered to 6.3185 on October 31st and has since weakened again to 6.4633 on December 25th. In the last year the Yuan is down by 5.1 percent and by 1.3 percent in the last month (Figure 7).
On November 30th the IMF released its decision on inclusion of the Yuan, also known as the Renminbi, in the basket of currencies that underwrite the SDR (Special Drawing Rights). The currency fell ahead of the announcement as its lack of convertibility could affect the final weighting it has on the SDR. The IMF stated that effective October 1, 2016 the RMB is determined to be a freely usable currency and will be included in the SDR basket as a fifth currency, along with the U.S. dollar, the euro, the Japanese yen and the British pound. Launching the new SDR basket on October 1, 2016 will provide sufficient lead time for the Fund, its members and other SDR users to adjust to these changes.
Explanation of Data Sources: The broad index is published by the Federal Reserve on both a daily and monthly basis. It is a weighted average of the foreign exchange values of the U.S. dollar against the currencies of a large group of major U.S. trading partners. The index weights, which change over time, are derived from U.S. export shares and from U.S. and foreign import shares. The data are noon buying rates in New York for cable transfers payable in the listed currencies. At SMU we use the historical exchange rates published in the Oanda Forex trading platform to track the currency value of the US $ against that of sixteen steel trading nations. Oanda operates within the guidelines of six major regulatory authorities around the world and provides access to over 70 currency pairs. Approximately $4 trillion US $ are traded every day on foreign exchange markets.


