Government/Policy

January 31, 2016
Foreign Steel Imports from Countries Associated with Trade Cases
Written by John Packard
We spent some time combing through the latest foreign steel import trade data provided by the U.S. Department of Commerce by product to see what impact, if any, the trade suits have been having on tonnages coming into the U.S.
In the tables we have provided, we are showing the months of November (Final Census), December (Preliminary Census) and January (License Data) as well as the 12 month moving average (12MMA) and 3 month moving average (3MMA). The moving averages are based on months with final census data in place.
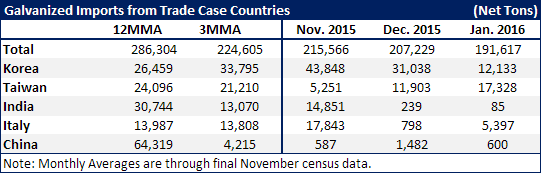
Galvanized Imports
The first suit filed was on corrosion resistant steels and we should see the biggest impact on galvanized since both the countervailing duty (CVD) and antidumping duty (AD) preliminary determinations have been made.
In January 2015 there were 269,955 net tons of galvanized imports (all countries). Of those the largest country exporting GI to the U.S. was Canada with 75,033 net tons. China was second with 49,802 net tons. Taiwan had 24,243 tons, India 3,364 tons, Korea 37,678tons and Italy 16,823 tons.
Galvanized imports surged to a high of 365,491 net tons by the month of March with China responsible for 90,490 tons of the total (the prior month China shipped 110,906 net tons).
China is the one country that was hit very hard in both the CVD and AD portions of the preliminary determinations. As you can see their tonnage is quickly approaching zero tons. India is another country who has taken their tonnage close to zero. Taiwan, Korea and Italy to a lesser extent have continued to ship steel albeit at slightly lower rates.
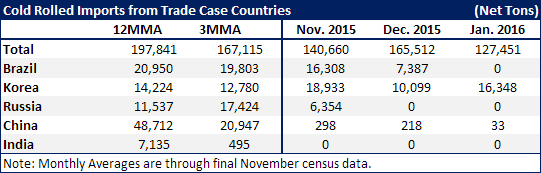
Cold Rolled Imports
The second trade suit filed was on cold rolled steels.
As you can see in the table below cold rolled imports have been coming down with China, which shipped 48,750 tons during January 2015, quickly approaching zero tons (as have India, Brazil and Russia). In January 2015 the U.S. received 230,802 net tons of CR imports. This was the largest number of tons of imported CR for calendar year 2015.
South Korea continues to ship cold rolled at rates in line (or slightly higher) with their 12 month moving average.
Hot Rolled Steel
Hot rolled steel imports appear poised to drop below 200,000 net tons during the month of January 2016. One year earlier (January 2015) were a staggering 515,634 net tons with Korea being the largest exporter at 124,121 net tons. Korea continues to ship HRC into the U.S. but at reduced rates than what we were capturing in our 12MMA and 3MMA.
Hot rolled was the last of the flat rolled cases to be filed in August 2015. We are beginning to see the results of the filing with the United Kingdom, Turkey and the Netherlands scaling way back or already at zero tons. Other countries seem to be less deterred by the rulings that have come out to date and either continue to ship or have begun shipping again (Australia).
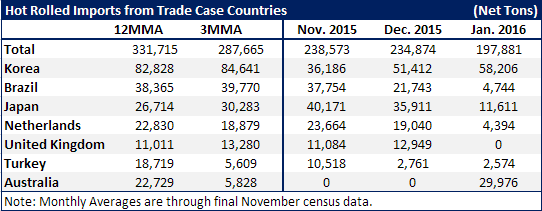
Looking at the three products: galvanized, cold rolled and hot rolled steel, in January 2015 the U.S. received a total of 1,016,391 net tons of these products. This year we are trending toward 516,949 net tons, which would be almost 500,000 tons lower than one year ago…