Prices

March 31, 2016
Hot Rolled Futures: HRC Bull Market has Officially Arrived
Written by John Packard
The following article on the hot rolled coil (HRC), busheling scrap (BUS), and financial futures markets was written by Dave Feldstein. As Flack Steel’s director of risk management, David Feldstein is an active participant in the hot rolled coil (HRC) futures market and we believe he will provide insightful commentary and trading ideas to our readers. Besides writing Futures articles for Steel Market Update, David produces articles that our readers may find interesting under the heading “The Feldstein” on the Flack Steel website (www.FlackSteel.com).
HRC BULL MARKET HAS OFFICIALLY ARRIVED!!!!!!!!!!

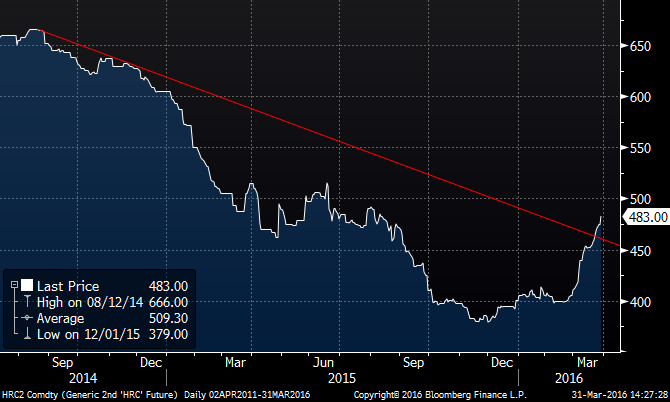
The rolling 2nd month HRC future is now up 27 percent from the low of $379/st on Dec. 1st, 2015. The downtrend has been breached!!
In the holiday shortened week, 29,780 short tons traded hands in the HRC futures markets. We saw trades all the way out to Q2 2017.* Last Thursday we saw trades at $475/st in June and Q316. Monday saw prices push higher as 500 tons of May traded $477 followed by 300 st/m of August and September at $485. Tuesday saw Q2 trade $480 and an awesome 3000st/m trade in Q3 at $482 (that’s 9000 tons!). Wednesday’s index print emboldened the bulls as Q2 and Q3 traded $489 and $490. A flat Q2 Q3 spread was traded. What that means is one participant bought Q2 and sold Q3 to the other side and there was no difference in price i.e. all tons were priced at $489. Thus the curve shifted from contango to flat. Next stop backwardation? Today’s trades included May, June, July and Aug. at $490/st, 1kst/m** of Q3 at $489 and 500 st/m of Q2 2017 at $490 st/m.
If the HRC futures market was Peter Frampton, then bust out your record player because Frampton Comes Alive!!!!!

Oooohh baby I love your way!!! And I love a good rally!!!
The HRC bull market is officially on like LeBron!!! The big question is how long will it last?
The table below shows the daily settlements, the change from last Thursday’s until Wednesday’s settlements and a chart of the curve for each day.
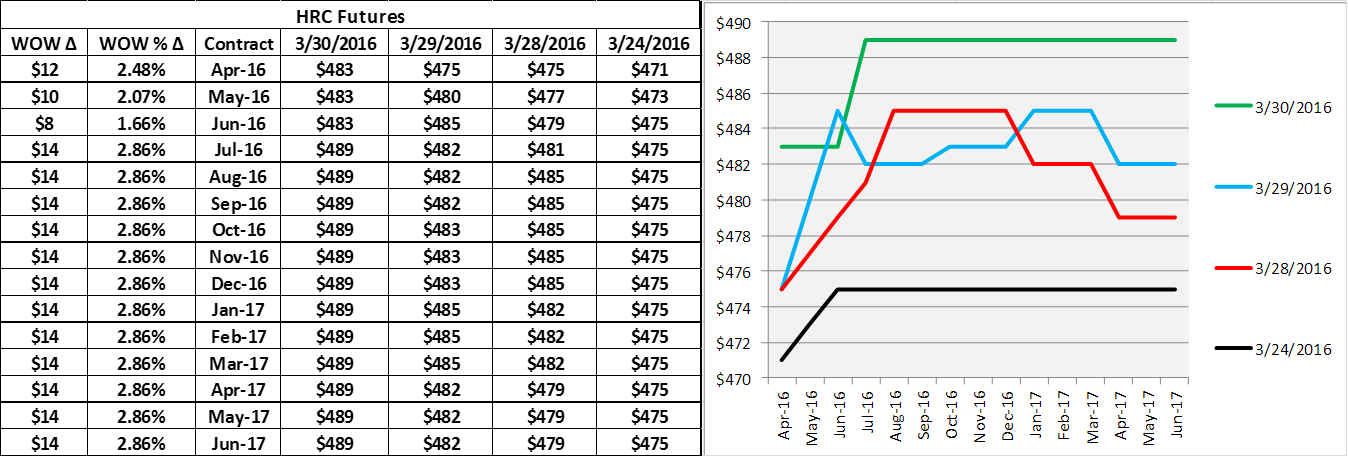
*CME HRC futures are traded each month out 24 months. A quarterly reference ie Q3 2016 refers to each month in Q3. If 500 t/m of Q3 traded at $485/st, that is 1500 short tons total, 500 in July, 500 in Aug and 500 in Sept.
** 1kst/m is 1000 short tons per month.