

Market Data

June 29, 2016
Currency Update for Steel Trading Nations
Written by Peter Wright
The Broad Index value of the US $ is reported several days in arrears, the latest value we have was dated June 24th, the day that the result of the UK’s referendum became known. There was no significant move in the value of the dollar on that day which may have been published before the results had been digested by the market (Figure 1).
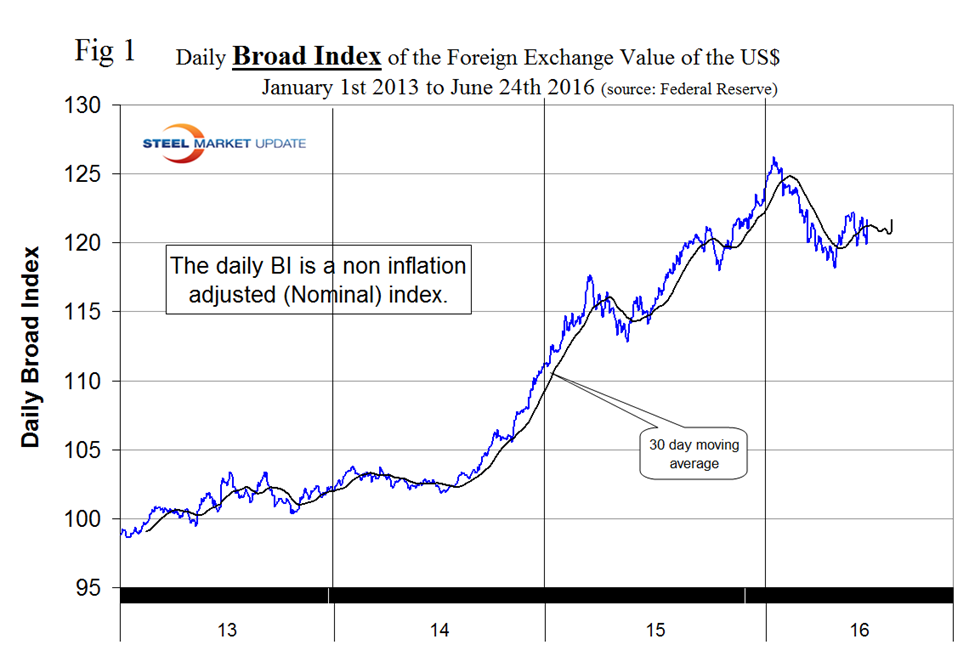
The other event of significance this month was the FOMC meeting of June 14th and 15th at which it was decided not to raise rates. This was also a nonevent in terms of dollar value since traders had correctly anticipated the lack of action following the release of the May employment result. Prior to the release of May’s employment result the dollar was trading above its 30 day moving average but that changed when the poor results were reported.
On June 26th Macro Investing wrote the following: Brexit has created an obscene level of uncertainty in financial markets. So much so there have been reports that a rate cut, rather than a rate rise, is the most likely next move from the Federal Reserve following the Brexit. Although at this point there is only a slim chance, with the market pricing in a 10 percent chance of a cut between now and September, the key here is that rate rises appear to be off the table completely this year. In fact, some predictions that there will be no increases in 2017 are looking reasonably credible now.
Table 1 shows the value of the US $ measured in the currencies of 16 steel and iron ore trading nations on June 26th. It reports the changes in one year, three months, one month and seven days for each currency and is color coded to indicate strengthening of the dollar in red and weakening in green. We regard strengthening of the US Dollar as negative and weakening as positive because the effect on net imports.
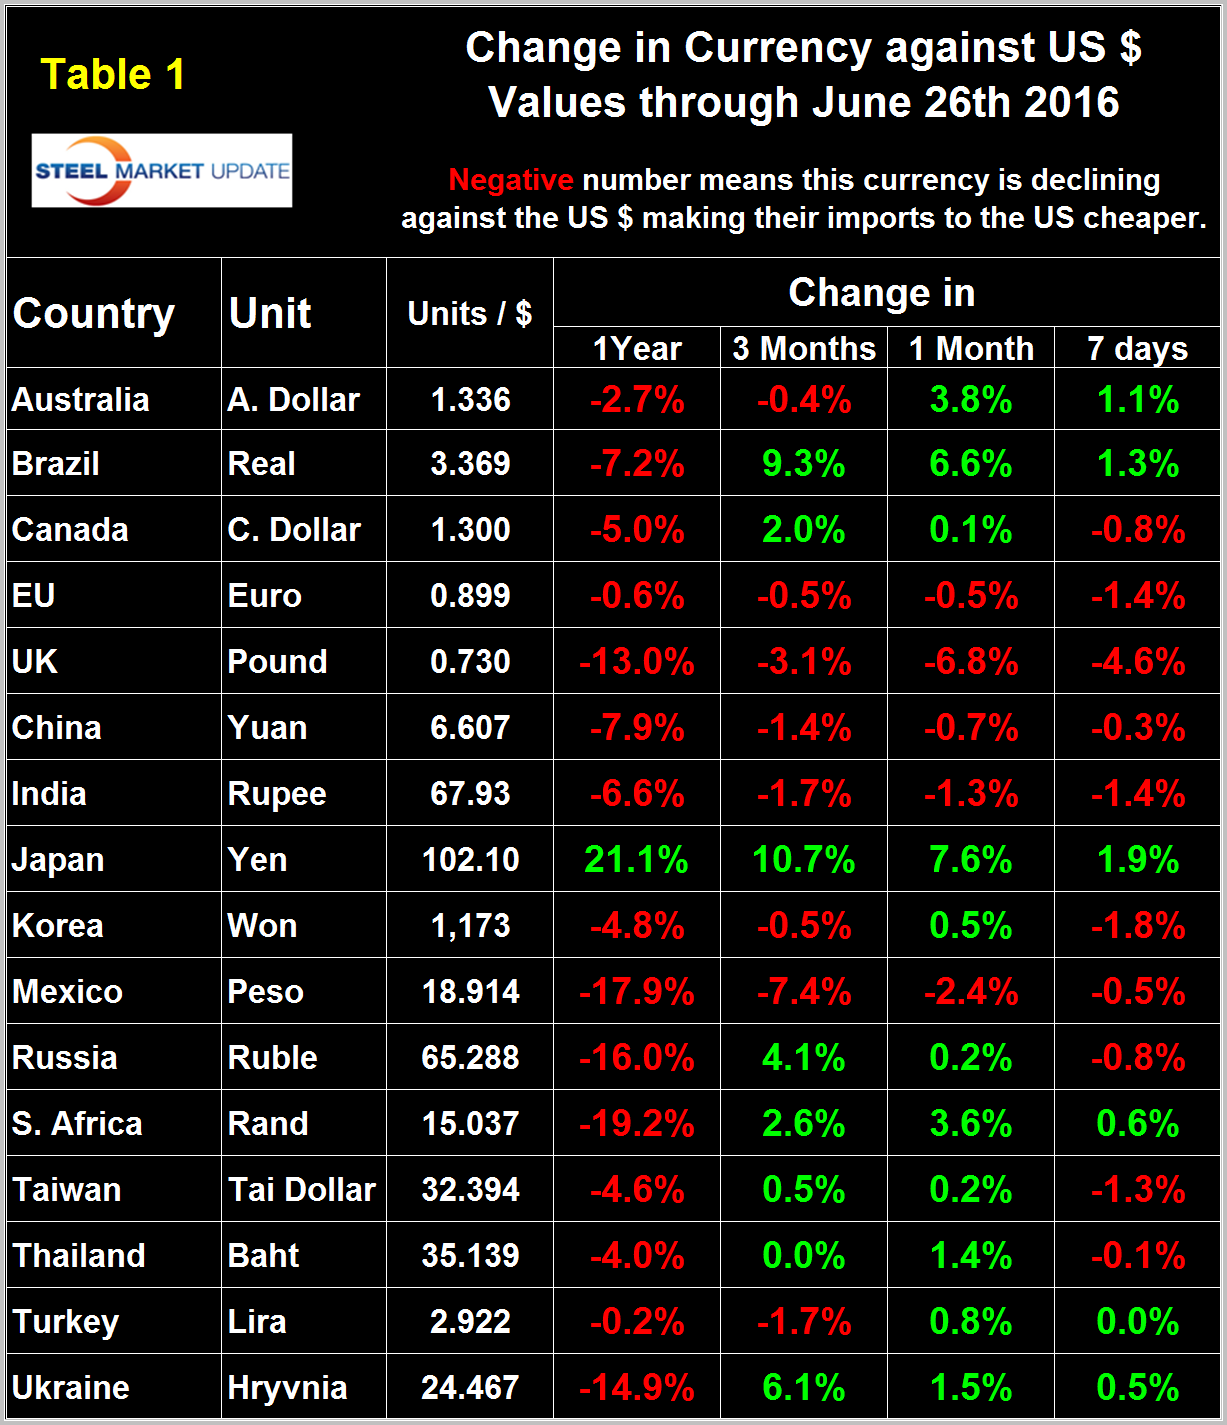
An estimated 25 percent of the U.S. economy had some involvement in international trade therefore currency swings can have a large effects on the economy in general and of the steel industry in particular. Compared to our previous report of May 24th there was a noticeable change but the dollar has been on a roller coaster this year so we can’t state with any confidence that the Brexit drove the dollar higher against the steel trading currencies. In 30 days prior to May 24th the dollar weakened against 11 of the 16 and in the 30 days before the latest data it strengthened against 11 of 16. At the 7 day level the dollar strengthened against 10 of the 16 which we don’t regard as much evidence of a flight to safety.
In each of these reports we comment on a few of the 16 steel trading currencies listed in Table 1 and include extracts from sources that we have come across that we deem credible. This month we will focus on the Euro. Charts for each of the 16 currencies listed in Table 1 are available through June 26th for any reader who requests them.
The Euro
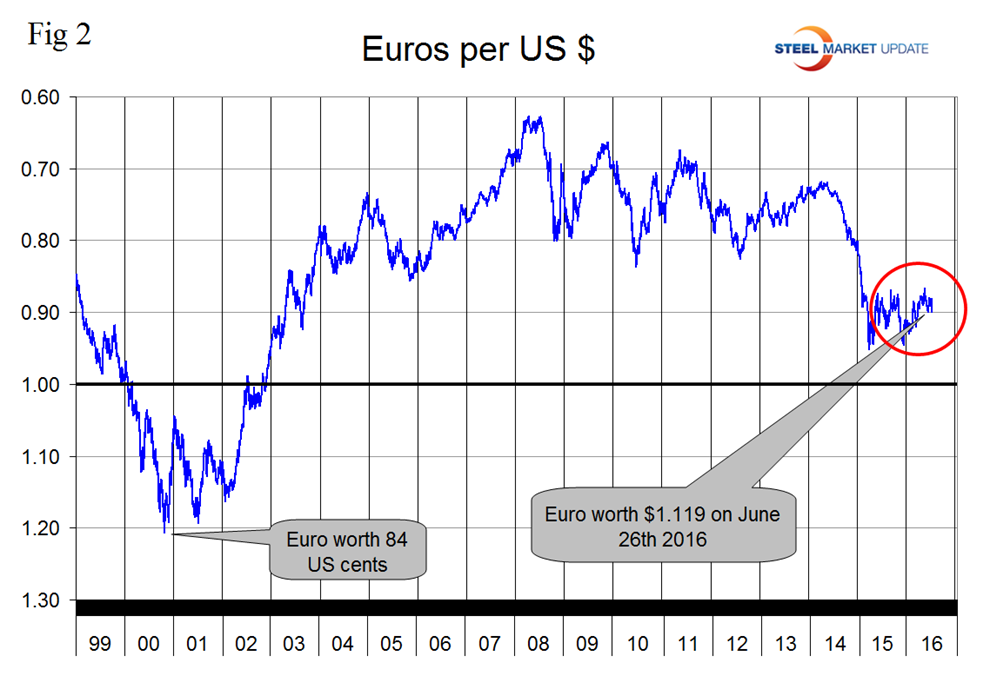
On June 26th it took 1.119 US dollars to buy one Euro (Figure 2). Through that date the Euro had weakened by 1.4 percent in seven days and was down by a lesser amount in the other three time comparisons. The Euro had a recent low of 1.0580 on November 30th.
June 26th the Market master wrote: With a no confidence vote now official by the UK, there is a high chance of extremism in other EU nations coming to the forefront with voices in France and Italy gaining traction to leave the EU as well following the Brexit outcome. Billionaire investor George Soros has already warned that Brexit could very well be the start of the disintegration of the European Union.
Also on June 26th RadaEcoWatch wrote: The main problem for the ECB is that the euro is significantly undervalued against major international currencies according to the OECD estimate of purchasing power parity. This could increase upward pressure on the euro. The undervaluation range is from a low of 9.4 percent against the Canadian dollar to a high of 35 percent against the Swiss franc with the US $ overvalued by 13.4 percent. Now that Brexit has become reality, the uncertainties for the Eurozone economy abound. A collapse in exports to UK could have a negative impact on the Eurozone economy even if it is not likely to cause a recession by itself. The political outlook is in our view the main source of concern as other countries could start considering leaving the EU. This could depress business and consumer confidence, lowering investments and consumptions. In this scenario, we think the ECB focus over the next few months will be on the euro exchange rate, even if it will never admit that the euro is a monetary policy objective. On Friday, the forex reaction to Brexit was mixed: the Euro declined against the US dollar, the Australian dollar and the New Zealand dollar but strengthened against the British Pound, the Swedish and Norwegian Krone.
On June 28th Ivan Martchev presented a different point of view when he wrote: The disintegration of the UK (by Scotland leaving) or the EU (by more countries leaving), or both, would be the type of events that could provide the necessary level of uncertainty to reach extremes for the GBP/USD exchange rate, and the EUR/USD exchange rate for that matter.
If Brexit and a potential Scotland exit are bearish for the pound, they are also clearly bearish for the euro and bullish for the U.S. dollar. While Britain never joined the euro, any more Eurozone countries leaving the EU would put a serious strain on the common currency. I have great difficulty seeing who will want to hold euros if some Eurozone countries start leaving. I do not believe that euro-dollar parity (1:1) will hold as support. I wrote previously that the euro would fall to parity based on the deflationary pressures in Europe, even without Brexit. Brexit simply means that the euro will decline faster towards parity with the dollar.
The Japanese Yen
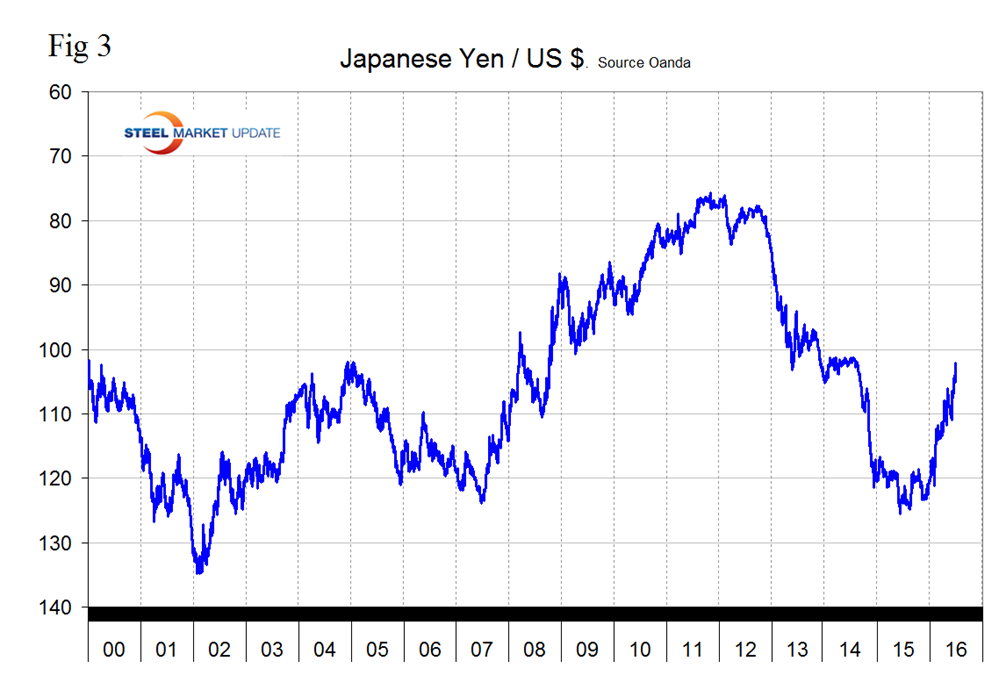
Figure 3 shows the value of the Yen since January 2000. The Yen has had a bull run for a year now and in that period has strengthened by 21.1 percent against the US dollar. This trend continued as the yen strengthened by 10.7 percent in 3 months, by 7.6 percent in one month and by 1.9 percent in 7 days to close at 102.10 on June 26th. It doesn’t seem long since John Maudlin was predicting a rate of $200 yen/dollar.
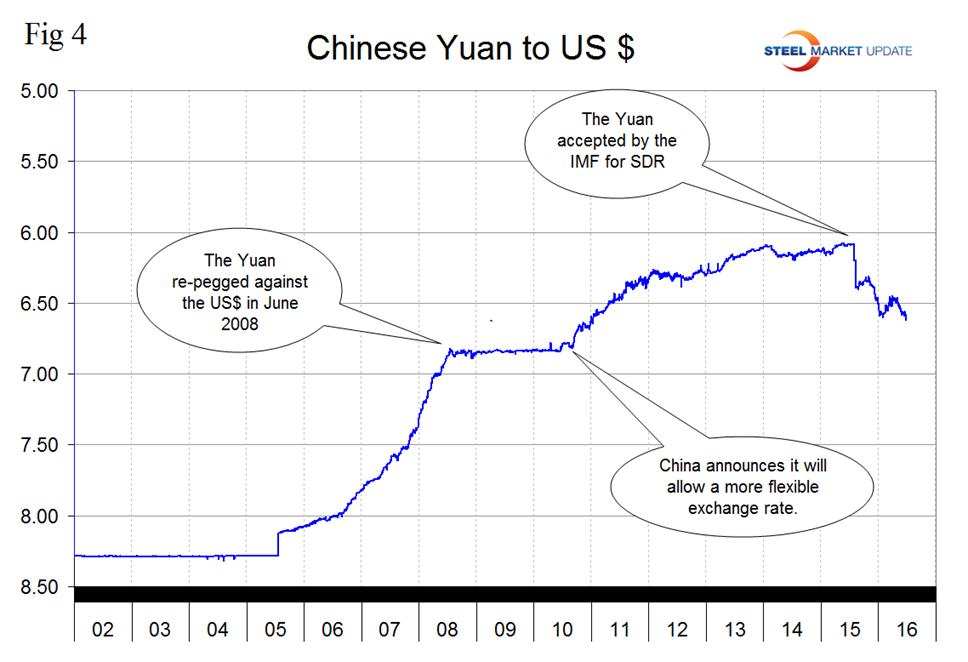
The Chinese Yuan
Figure 4 shows the history of the Yuan against the US $ since January 2002. The Yuan broke through 6.5/US $ on May 9th and through 6.6/US $ on June 24th. In the last 30 days the Yuan has weakened by 1.4 percent and by 7.9 percent in the last year.
Explanation of Data Sources: The broad index is published by the Federal Reserve on both a daily and monthly basis. It is a weighted average of the foreign exchange values of the U.S. dollar against the currencies of a large group of major U.S. trading partners. The index weights, which change over time, are derived from U.S. export shares and from U.S. and foreign import shares. The data are noon buying rates in New York for cable transfers payable in the listed currencies. At SMU we use the historical exchange rates published in the Oanda Forex trading platform to track the currency value of the US $ against that of sixteen steel trading nations. Oanda operates within the guidelines of six major regulatory authorities around the world and provides access to over 70 currency pairs. Approximately $4 trillion US $ are traded every day on foreign exchange markets.


