

Prices

July 7, 2016
Flat, Long, and Semi-Finished Imports through June 2016
Written by Peter Wright
Licensed data for June was reported by the Steel Import Monitoring System of the US Commerce Department on July 5th. An explanation of the methodology that we at SMU use to analyze the trade data is given at the end of this piece.
![]() Total rolled product licensed imports in the single month of June were 2,169,434 short tons with a three month moving average (3MMA) of 2,037,652 tons. There hasn’t been much change in the total monthly volume in the last 10 months. We prefer not to dwell on single months results because, even though the monthly total has been quite steady, there is often extreme variability in individual products. In the comments below we use only three month moving averages to get a more representative picture.
Total rolled product licensed imports in the single month of June were 2,169,434 short tons with a three month moving average (3MMA) of 2,037,652 tons. There hasn’t been much change in the total monthly volume in the last 10 months. We prefer not to dwell on single months results because, even though the monthly total has been quite steady, there is often extreme variability in individual products. In the comments below we use only three month moving averages to get a more representative picture.
Figure 1 shows the 3MMA through June licenses for semi-finished, flat and long products since January 2004.
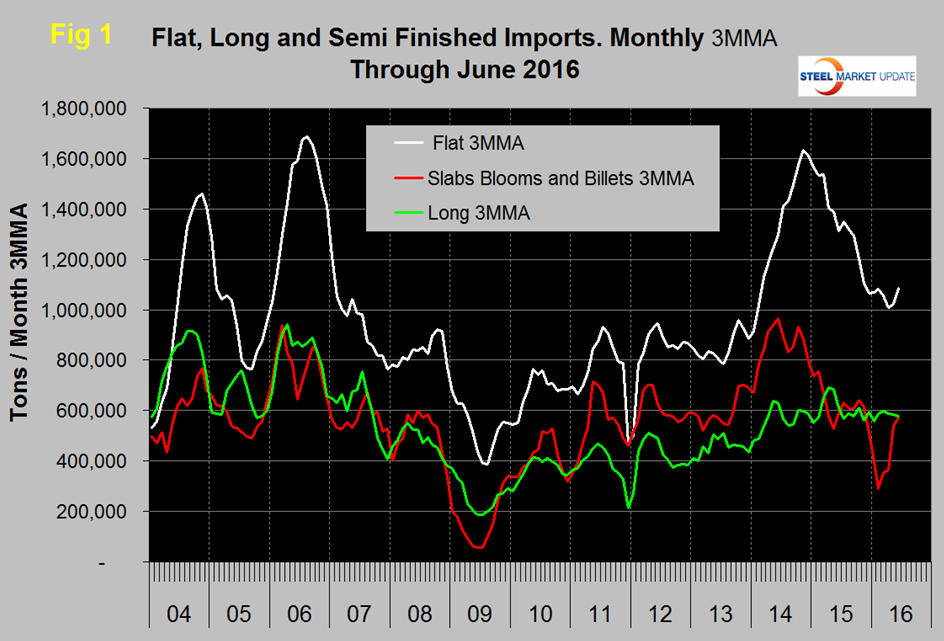
Imports of semi-finished in June were 586,745 tons with a three month moving average of 572,659 tons. The June semi-finished volume was down by 8.0 percent from the monthly average of 2015. February this year had a very low volume of semis as shown by the red line in Figure 1. The 3MMA of flat rolled imports peaked at 1,634,000 tons in November 2014 and fell to 1,008,718 in April and picked up slightly in to reach 1,085,763 tons in June. “Flat” includes all hot and cold rolled sheet and strip plus all coated sheet products plus both discrete and coiled plate. Long product imports have been range bound between 519,000 tons and 772,000 tons since March 2014 with no particular trend evident. In June the 3MMA of long product imports was 576,222 tons.
Figure 2 shows the trend of sheet and strip products since January 2004 on a rolling three months basis.
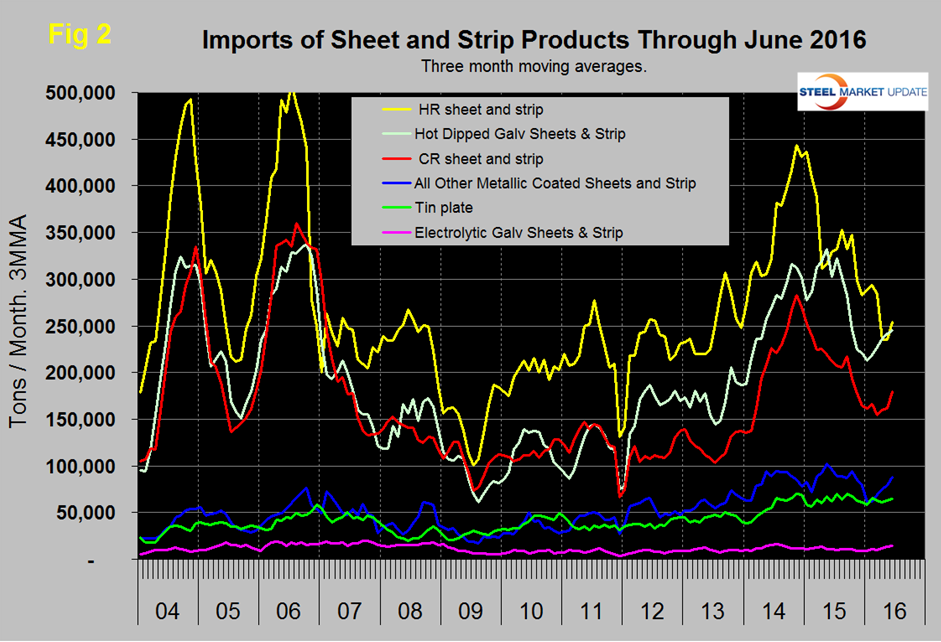
Hot rolled, cold rolled, HDG and other metallic coated (mainly Galvalume) have all reversed course and trended back up recently. Tin plate and electro-galvanized have been little changed in the last 18 months.
Table 1 provides an analysis of major product groups and of sheet products in detail.
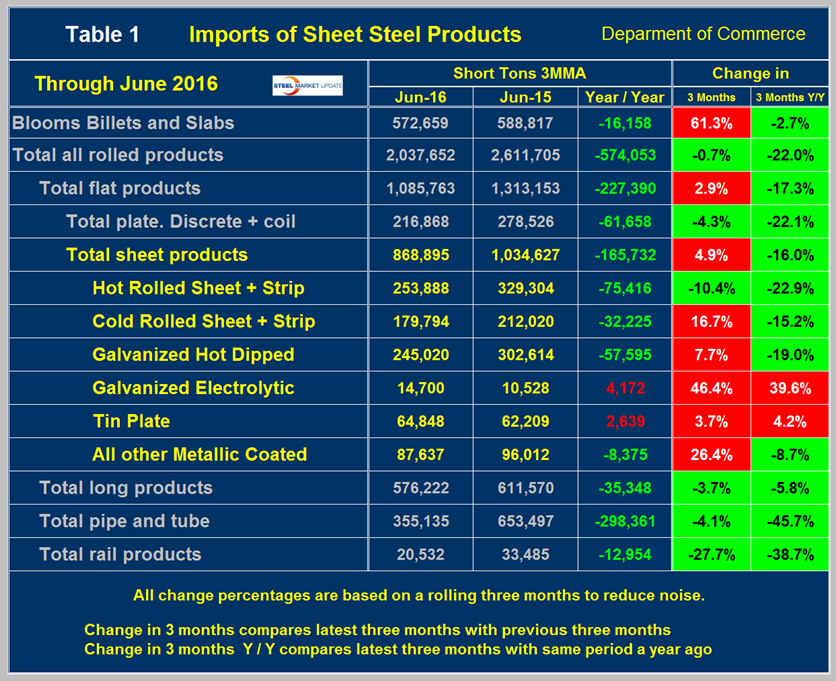
It compares the average monthly tonnage in the latest three months through June with both three months through March (3M/3M) and three months through June 2015 (Y/Y). On a Y/Y basis the total of all rolled products was down by 574,053 tons or 22.0 percent, as total sheet products were down by 16.0 percent. Tubular products were down by 45.7 percent. Semi-finished slabs, blooms and billets were down by 2.7 percent and long products were down by 5.8 percent. Electro-galvanized and tin plate were the only sheet products to have a Y/Y increase. There was an increase in many categories on a 3M/3M basis as indicated by the color code red. The extremely large 3M/3M increase in semis was a result of the very low February volume. The total volume of hot worked products was up by 0.7 percent 3M/3M driven entirely by sheet products which all except for hot rolled increased. The color codes in Tables 1 and 2 for the three month and year over year change show which products are improving and which have experienced import volume increases in these two time frames.
Table 2 shows the same analysis for long products.
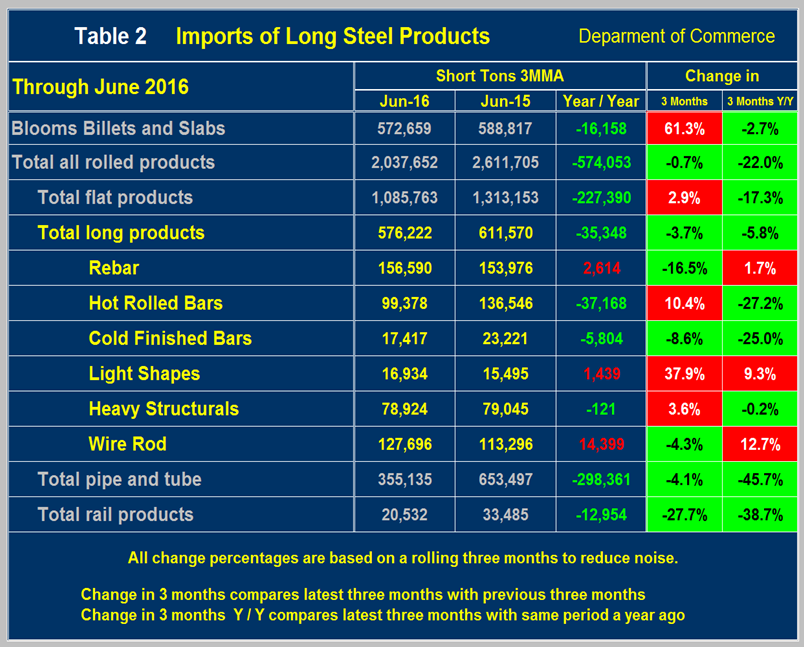
The total tonnage of long products was down by over 35,000 tons per month Y/Y. Rebar, wire rod and light shapes were the only product to have a volume increase on this basis. On a 3M/3M basis the total volume of long products decreased by 3.7 percent led by rebar that was down by 16.5 percent.
Explanation: The SMU publishes several import reports ranging from this very early look using licensed data to the very detailed analysis of final volumes by product, by district of entry and by source nation which is available on the premium member section of our web site. The early look, the latest of which you are reading now has been based on three month moving averages using the latest licensed data, either the preliminary or final data for the previous month and final data for earlier months. We recognize that the license data is subject to revisions but believe that by combining it with earlier months in this way gives a reasonably accurate assessment of volume trends by product as early as possible. We are more interested in direction than we are in absolute volumes at this stage. The main issue with the license data is that the month in which the tonnage arrives is often not the same month in which the license was recorded. In 2014 as a whole our data showed that the reported licensed tonnage of all carbon and low alloy products was 2.3 percent less than actually receipts, close enough we believe to confidently include licensed data in this current update. The discrepancy declined continuously during the course of the twelve month evaluation as a longer time period was considered.


