

Market Data

August 23, 2016
Service Center Apparent Inventory Deficit Short Lived
Written by John Packard
The following article is normally shared with just our Premium level members.
Steel Market Update (SMU) has a proprietary product whereby we analyze the Metal Service Center Institute (MSCI) carbon flat rolled shipments and inventories at the end of each month. Based on our model, we come up with a number indicating whether service center inventories are out of balance and by how much. As of the end of June distributors inventories were in a deficit by 210,000 net tons.
Our July forecast called for daily shipments to decline from June to 101,400 tons per day with flat rolled shipments totaling 2,028,000 tons. Shipments actually were down 29,000 tons more than we predicted with total shipments coming in at 1,999,000 tons.
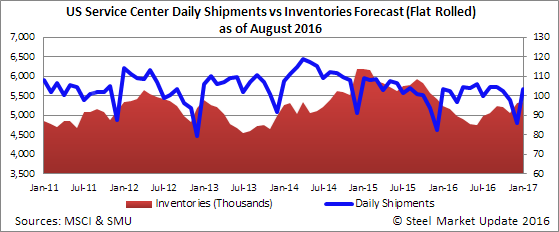
Where our forecast totally missed the mark was in receipts and total inventory. SMU believed receipts would be 2 percent below the 3 year average. Instead, receipts were actually 5.2 percent higher totaling 110,950 tons per day. This was the biggest month for receipts since December 2014.
Service center flat rolled steel inventories came in at 4,974,000 tons which is 181,000 tons above where we thought inventories would be.
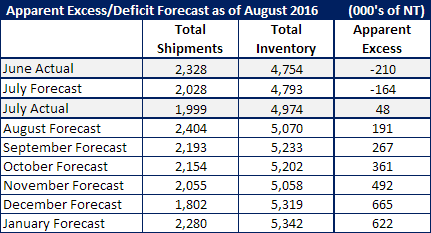
We forecast service center apparent deficit would drop from -210,000 tons to -164,000 tons. With the extra 181,000 tons of receipts our proprietary model shows the distributors as having gone back into an excess inventory situation by +48,000 tons.
Inventory Apparent Excess/Deficit Forecast
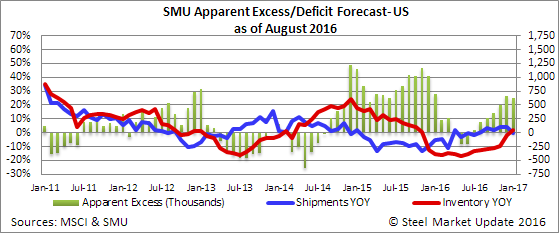
As we looked at where we thought shipments and receipts will be over the next few months we first studied to see how they have been performing over the past 12 months compared to a 3 year average as well as last year.
What we have seen going back to August 2015 shipments were down every month against the 3 year average. The lowest month was only down 1.7 percent (August 2015) with the largest shipping deficit being 11.8 percent during March 2016. The average of August 2015 through July 2016 is for shipments to be 5.31 percent lower than the 3 year average.
Ever the optimist we are suggesting that shipments will average 3 percent less than the 3 year average.
Receipts during the same time frame have also been lower than the 3 year average each and every month except for two: August 2015 and July 2016. Some of the numbers are quite horrendous with December 2015 being off the 3 year average by 31.0 percent. The average for the months of August 2015 through July 2015 was to have receipts 7.65 percent lower than the 3 year average.
We are (again) taking a more optimistic approach and suggesting receipts will be 3.0 percent lower than the 3 year average.
In the process what we are seeing (if correct) is for service center inventories to grow and the excessive inventory situation to remain in place into 2017. What would make these numbers change? A boost in shipments would change the tide.


