SMU Data and Models
![](https://www.steelmarketupdate.com/wp-content/uploads/sites/2/media/k2/items/src/f77a2c3c128d461ea4d17788728c4bc6.jpg)
SMU Apparent Excess/Deficit Forecast Nails Shipments/Deficit Shrinks
Written by John Packard
June 21, 2017
Last month Steel Market Update forecast steel shipments of carbon flat rolled would total 2,322,000 tons and, according to the MSCI data released last week, shipments were 3,319,000 tons. We missed the number by 3,000 tons…
Our forecast called for flat rolled inventories to total 4,344,000 tons at the end of May. We were off by 214,000 tons as inventories came in higher at 4,458,000 tons.
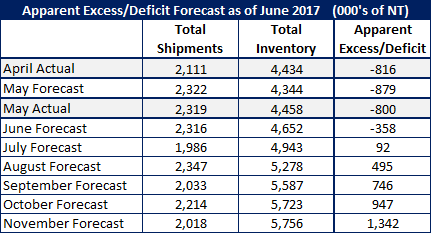
Based on the SMU Service Center Inventories Apparent Excess/Deficit model we calculated distributors were short 800,000 tons (our forecast was slightly higher deficit at -879,000 tons). We ended the month of April with a deficit of -816,000 tons.
All of these numbers are based on MSCI data and the assumption the numbers are accurate. Our own surveys and interactions with service centers are raising question as to whether the deficit is as large as our model is showing. For now, we do not have an alternative to the MSCI numbers and thus we are coming to the same conclusion that most of the domestic steel mills are making – service centers need to build back inventories.
June 2017 Forecast
Our forecast for the next few months is that shipments will be within the 4-year average putting June at 2,316,000 tons (almost exactly the same as May 2017).
Inventories of flat rolled will end the month up another 200,000 tons as we expect the month to end with 4,652,000 tons and the Apparent Deficit will, if we are correct, decline to -358,000 tons.
Here is what we are forecasting through November 2017:
![](https://www.steelmarketupdate.com/wp-content/uploads/sites/2/2023/04/john-packard.png)
John Packard
Read more from John PackardLatest in SMU Data and Models
![](https://www.steelmarketupdate.com/wp-content/uploads/sites/2/images/Featured_News_Icons/Premium1.png)
Steelmaking raw material prices ease in July
The majority of steelmaking raw material prices declined in June, following the same trend seen in May, according to SMU’s latest analysis.
![](https://www.steelmarketupdate.com/wp-content/uploads/sites/2/2024/01/cropped-SMU_Mobile_final.png)
SMU price ranges: HR declines moderate. Are we near a bottom?
SMU’s sheet price ranges slid again this week. But the declines were more pronounced on tandem products whereas prices for hot-rolled coil held roughly steady.
![](https://www.steelmarketupdate.com/wp-content/uploads/sites/2/images/Featured_News_Icons/Premium1.png)
Some SMU Key Market Indicators improve, others remain near historic lows
SMU’s Key Market Indicators include data on the economy, raw materials, manufacturing, construction, and steel sheet and long products. They offer a snapshot of current sentiment and the near-term expected trajectory of the economy. All told, nine key indicators point lower, 16 are neutral, and 13 point higher. One thing worth noting: The nine indicators pointing lower are all lagging indicators. Many of those pointing upward are leading indicators.
![](https://www.steelmarketupdate.com/wp-content/uploads/sites/2/2024/01/cropped-SMU_Mobile_final.png)
SMU survey: Steel Buyers’ Sentiment Indices rebound
SMU’s Steel Buyers’ Sentiment Indices both saw improvement this week. Current sentiment ticked higher but remains near the four-year low seen earlier this month. Future Sentiment continues to indicate that buyers are optimistic for future business conditions.
![](https://www.steelmarketupdate.com/wp-content/uploads/sites/2/images/Featured_News_Icons/Premium1.png)
SMU market survey results now available
The latest SMU market survey results are now available on our website to all premium members. After logging in at steelmarketupdate.com, visit the pricing and analysis tab and look under the “survey results” section for “latest survey results.” Historical survey results are also available under that selection. If you need help accessing the survey results, or if your […]