Market Data

July 19, 2017
Service Center Flat Rolled Apparent Inventory Deficit Shrinks
Written by John Packard
After a careful analysis of the Metals Service Center Institute (MSCI) carbon flat rolled shipment and inventories data, and then applying that data to our proprietary Apparent Excess/Deficit inventories model, we have determined that distributor inventories improved during the month of June.
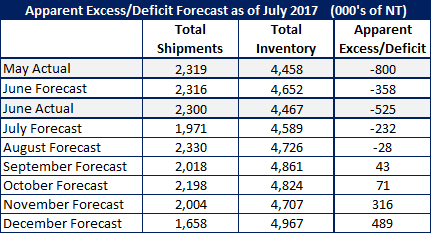
At the end of May, based on the MSCI data, SMU calculates that service centers had an 800,000-ton carbon flat rolled inventories deficit. Looking at the data just released for the month of June, the deficit continues, but it has dropped to -525,000 tons.
Looking at our original forecast for the month of June, we forecast shipments of 2,316,000 tons. We were very close as shipments came in at 2,300,000 tons.
At the same time, we forecast inventories of carbon flat rolled to be 4,652,000 tons at the end of June. Inventories, according to the MSCI, were 4,467,000 tons.
Our original forecast was for the Apparent Deficit to drop to -358,000 tons. We got the direction correct, but we were slightly too optimistic.
SMU Forecast for July 2017
We are continuing to use the same formula. Using a three-year average month-to-month change, our forecast calls for a continued drop in the Apparent Deficit. We anticipate that it will drop to -232,000 tons by the end of July. As you can see by the table below, we are forecasting shipments of 1,971,000 tons and end-of-July inventories to be 4,589,00 tons. We believe service centers will continue to grow their inventories through the end of the year.