Market Data

August 18, 2017
Distributors Flat Rolled Deficit to be Eliminated by End of August
Written by John Packard
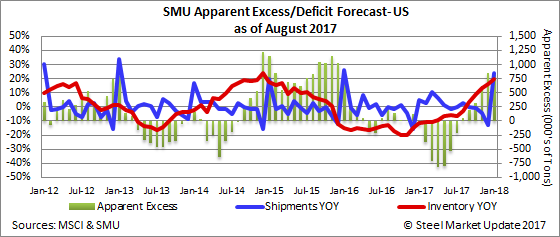
The Steel Market Update (SMU) Service Center Inventories Apparent Excess/Deficit forecast provided last month showed that the deficit in inventories being held by flat rolled distributors would shrink. We have worked with the MSCI carbon flat rolled shipment and inventory data and our model indicates the deficit did indeed shrink and is very close to our forecast.
The MSCI reported carbon flat rolled shipments at 1,991,000 tons. This is 20,000 tons more than our forecast of 1,971,000 tons.
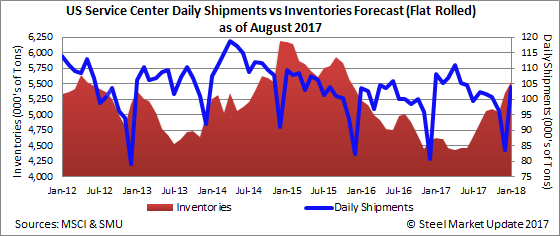
Inventories at the U.S. flat rolled service centers ended the month of July at 4,646,000 tons, which was slightly higher than our forecast of 4,589,000 tons.
Using our model, we show the distributors as having shrunk the inventory deficit from -525,000 tons down to -218,000 tons. The SMU forecast was for the deficit to shrink to -232,000 tons.
August Forecast
Steel Market Update is forecasting flat rolled shipments out of the U.S. service centers to be 2,352,000 tons for the month of August. Our forecast is based on the average monthly change for August over the past four years. In this case, the average change was +2.7 percent.
We are also forecasting that the flat rolled steel distributors will hold 4,862,000 tons of inventory at the end of the month.
If our shipment and inventory forecasts are correct, the service centers will have eliminated their inventory deficit and will be in a “balanced” position with +50,000 tons.
Looking at the months to come using the same formula, we then expect September through January to see a jump in inventories and, in the process, a jump in the amount of excess steel that will be on the distributors’ floors every month through January.