Prices
February 8, 2018
Foreign Steel Imports Rise 15% in 2017
Written by Brett Linton
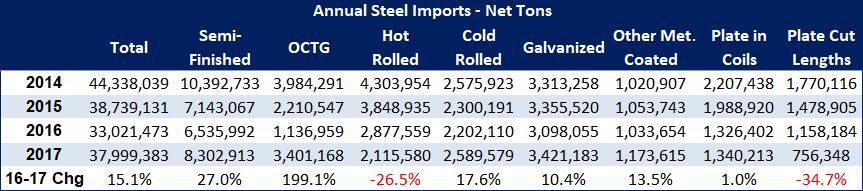
The U.S. Department of Commerce released the final accounting for December 2017 imports, which came in at 2,450,286 net tons. For the calendar year, foreign steel imports rose by 15 percent compared to 2016. Total steel imports rose to 37,999,383 net tons.
Steel Market Update is providing our readers with a detailed analysis of selected import products and how they compare to 2016, 2015 and 2014, the years prior to and just after the antidumping and countervailing duty trade suits filed during the summer of 2015.
2017 Foreign Steel Import Analysis
The only products followed by Steel Market Update that showed a year-over-year decline in imports were hot rolled and cut-to-length plate. Hot rolled, at 2,115,580 tons, was 27 percent lower than the previous year. CTL plate at 756,348 tons was 35 percent below 2016 levels.
All of the other products followed by SMU increased during 2017 compared to the prior year. The greatest “offender” was oil country tubular goods (OCTG), which at 3,401,168 tons was up 199 percent compared to the 1,136,959 tons received during 2016.
Other flat rolled and plate product imports were also higher: cold rolled up 18 percent, Galvalume up 14 percent, galvanized up 10 percent and coiled plate up 1 percent.
December 2017 vs. Previous Years
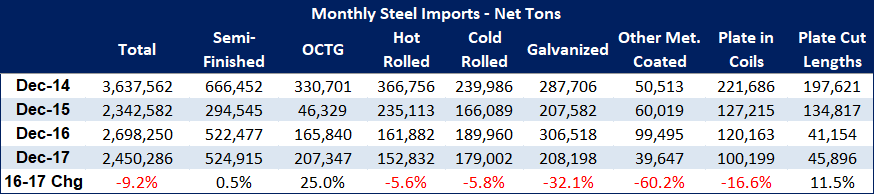
At 2,450,286 tons, December 2017 imported the least tonnage compared to 2016 and 2014. All items followed by SMU declined compared to December 2016 with the exception of semi-finished (slabs/billets), OCTG and CTL plate (see table).
Hot rolled and cold rolled imports both declined by 6 percent, galvanized was 32 percent lower and “other metallic” of which the majority is Galvalume was 60 percent lower. Finally, coiled plate was 17 percent below December 2016 levels.
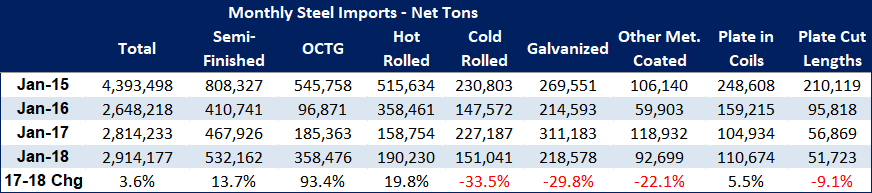
January 2018 Saw Mixed Results
The DOC reported revised import license data for January 2018 indicating the month should come in somewhere close to 2.9 million tons. This would be 4 percent higher than the previous January (2017) and higher than the 2.6 million tons imported in January 2016.
Semi-finished imports rose by 14 percent, OCTG by 93 percent, hot rolled by 20 percent and plates in coils by 6 percent over January 2017 levels.
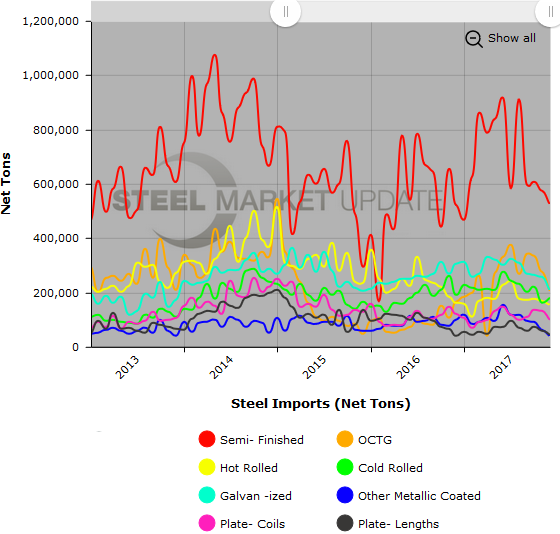
Below is a graph showing our steel imports history through final December data. You will need to view the graph on our website to use its interactive features, you can do so by clicking here. If you need assistance logging into or navigating the website, please contact our office at 800-432-3475 or info@SteelMarketUpdate.com.