

Market Data

March 11, 2018
New SMU Report Shows Imports Losing Market Share
Written by Peter Wright
Imports’ shares of the major steel product markets are all on the decline, reveals a new report on imports from Steel Market Update. The report examines the import share of sheet, plate, long and tubular products and 18 subcategories of these product groups. We think the introduction of this analysis is timely as a way to examine the effects of the Section 232 tariffs going forward.
Table 1 shows total supply to the market in three months through January and in 12 months through January for the four product groups and the 18 subcategories. Supply to the market is the total of domestic mill shipments to domestic locations plus imports. It shows imports on the same three- and 12-month bases and then calculates import market share for the two time periods for 18 products. Finally, it subtracts the 12-month share from the three-month share and color codes the result green or red. If the result of the subtraction is positive, it means that import share is increasing and the code is red. The big picture is that import share is declining for all four product groups: sheet, plate, longs and tubular products.
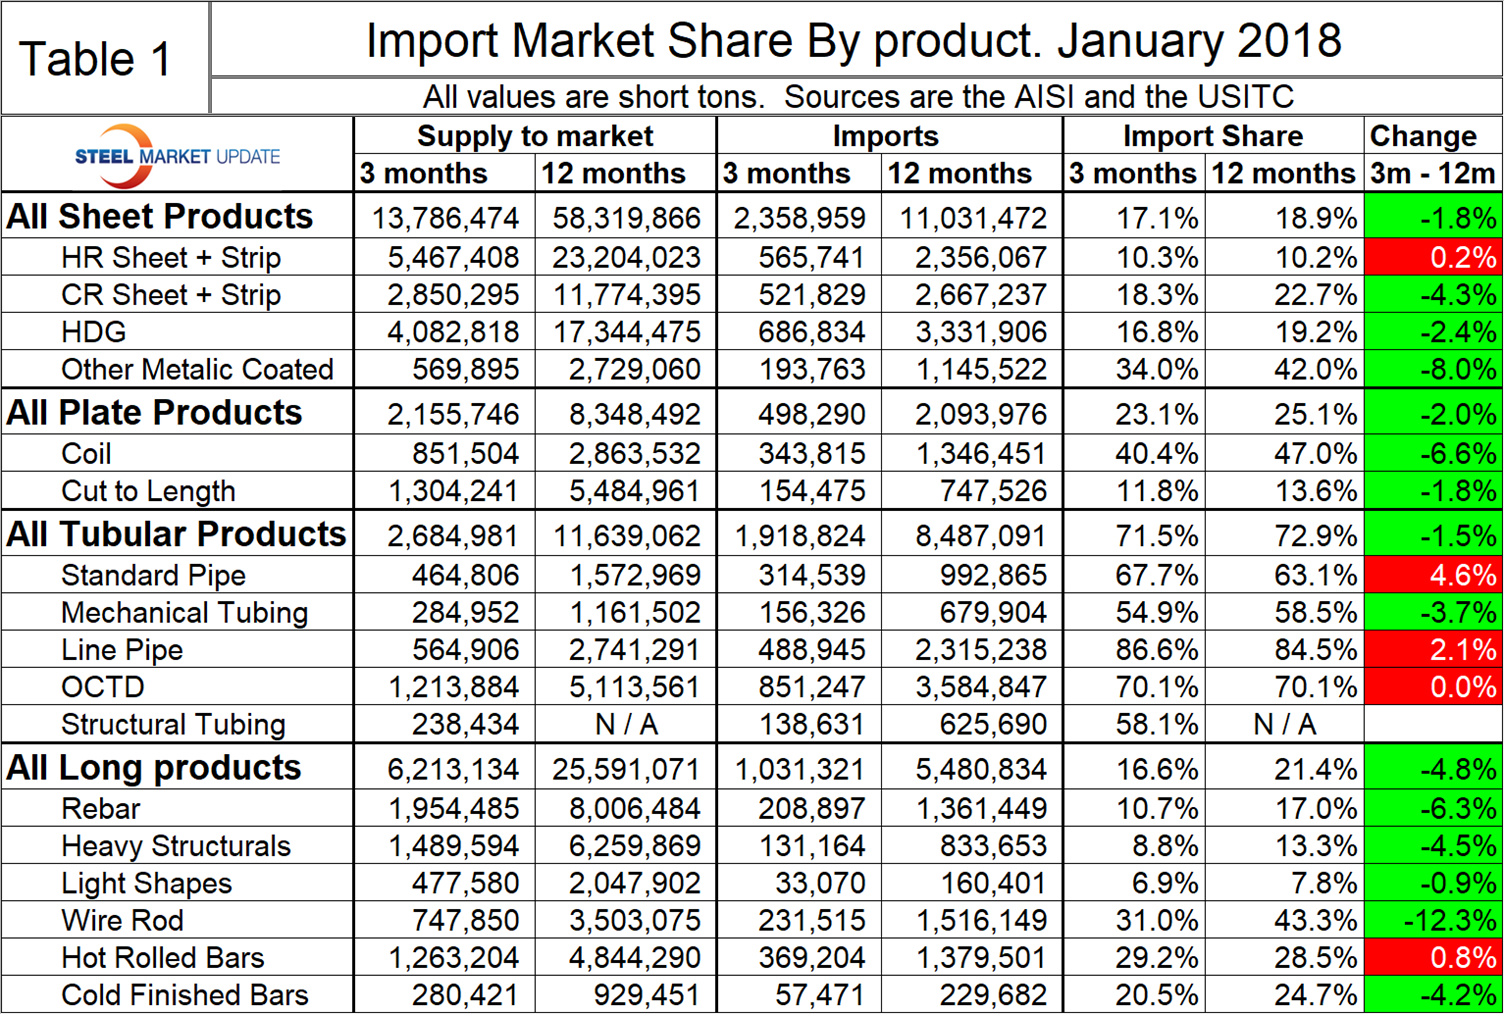
There is a huge difference in import market share between products with tubular goods being by far the worst case. In the tubular section, the import share of structural tubing is blank because the AISI data prior to March 2017 made no sense and we have not included it.
Figure 1 shows the historical import market share of plate and total sheet products. The import share of both has been decreasing for three years, though more so for plate, which started at a higher level.
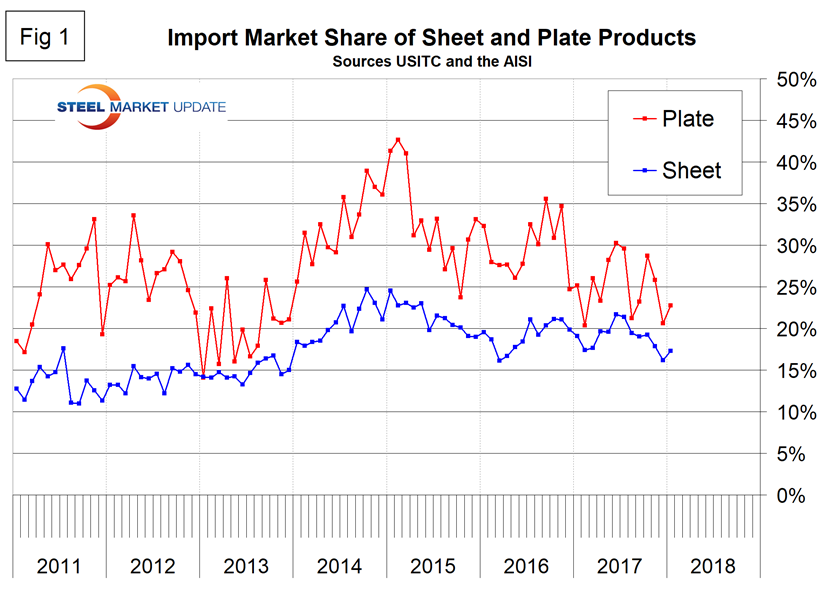
Figure 2 shows the same history for tubular and long products and the extreme import level of tubulars.
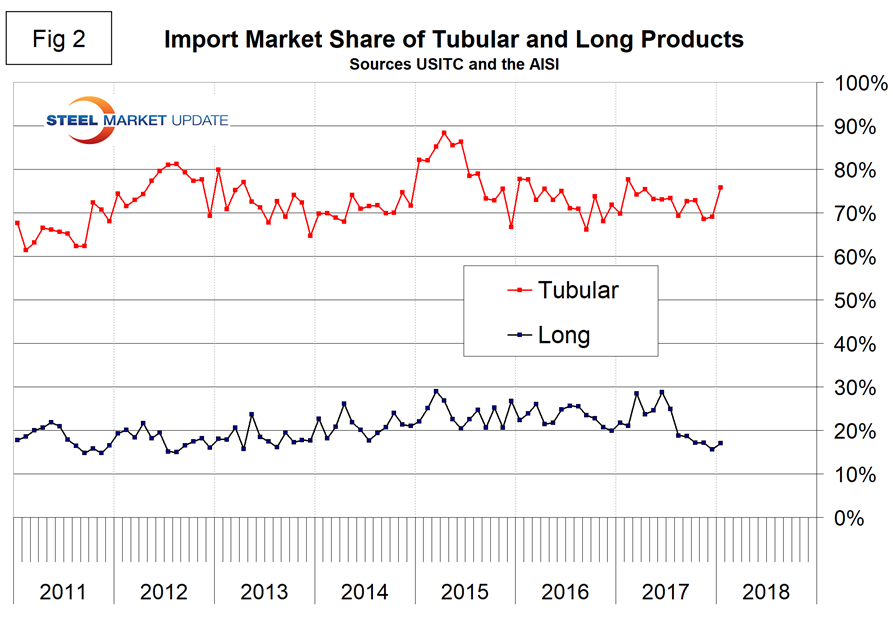
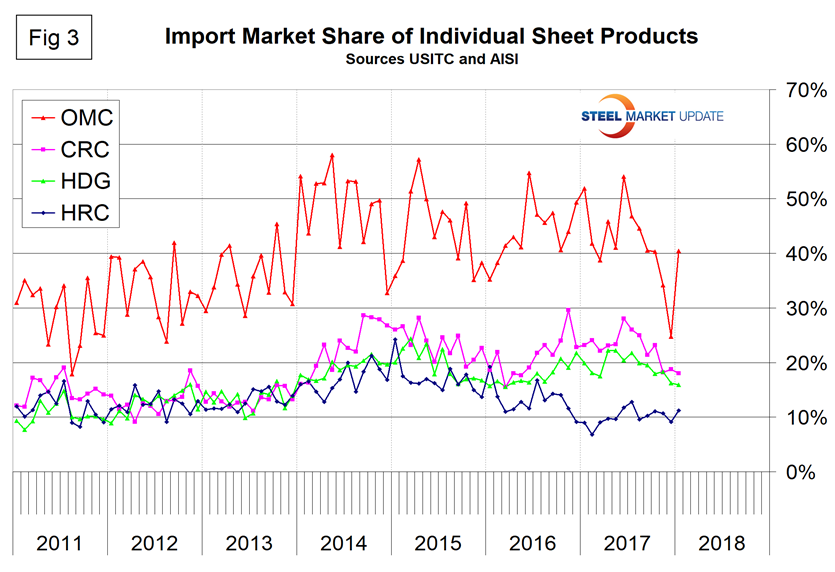
Figure 3 drills down to show the history of the four major sheet products. Other metallic coated, mainly Galvalume, has had by far the highest import share since our analysis begins in 2011.
This is a work in progress. As we develop it, we will drill down into the subcategories of plate, longs and tubular products. This should be complete for our February analysis.


