Market Data

May 14, 2018
Import Market Share Through March
Written by Peter Wright
Steel Market Update’s analysis of import market share for sheet, plate, long and tubular products and their 18 subcategories shows big disparities by product type.
Table 1 shows total supply to the market in three months through March and in 12 months through March for the four product groups and the 18 subcategories. Supply to the market is the total of domestic mill shipments to domestic locations plus imports. It shows imports on the same three- and 12-month basis and then calculates import market share for the two time periods for 18 products. Finally, it subtracts the 12-month share from the three-month share and color codes the result green or red. If the result of the subtraction is positive, it means that import share is increasing, and the code is red. The big picture is that in most cases import share is declining. Exceptions are HR sheet, mechanical tubing, OCTG and light shapes.
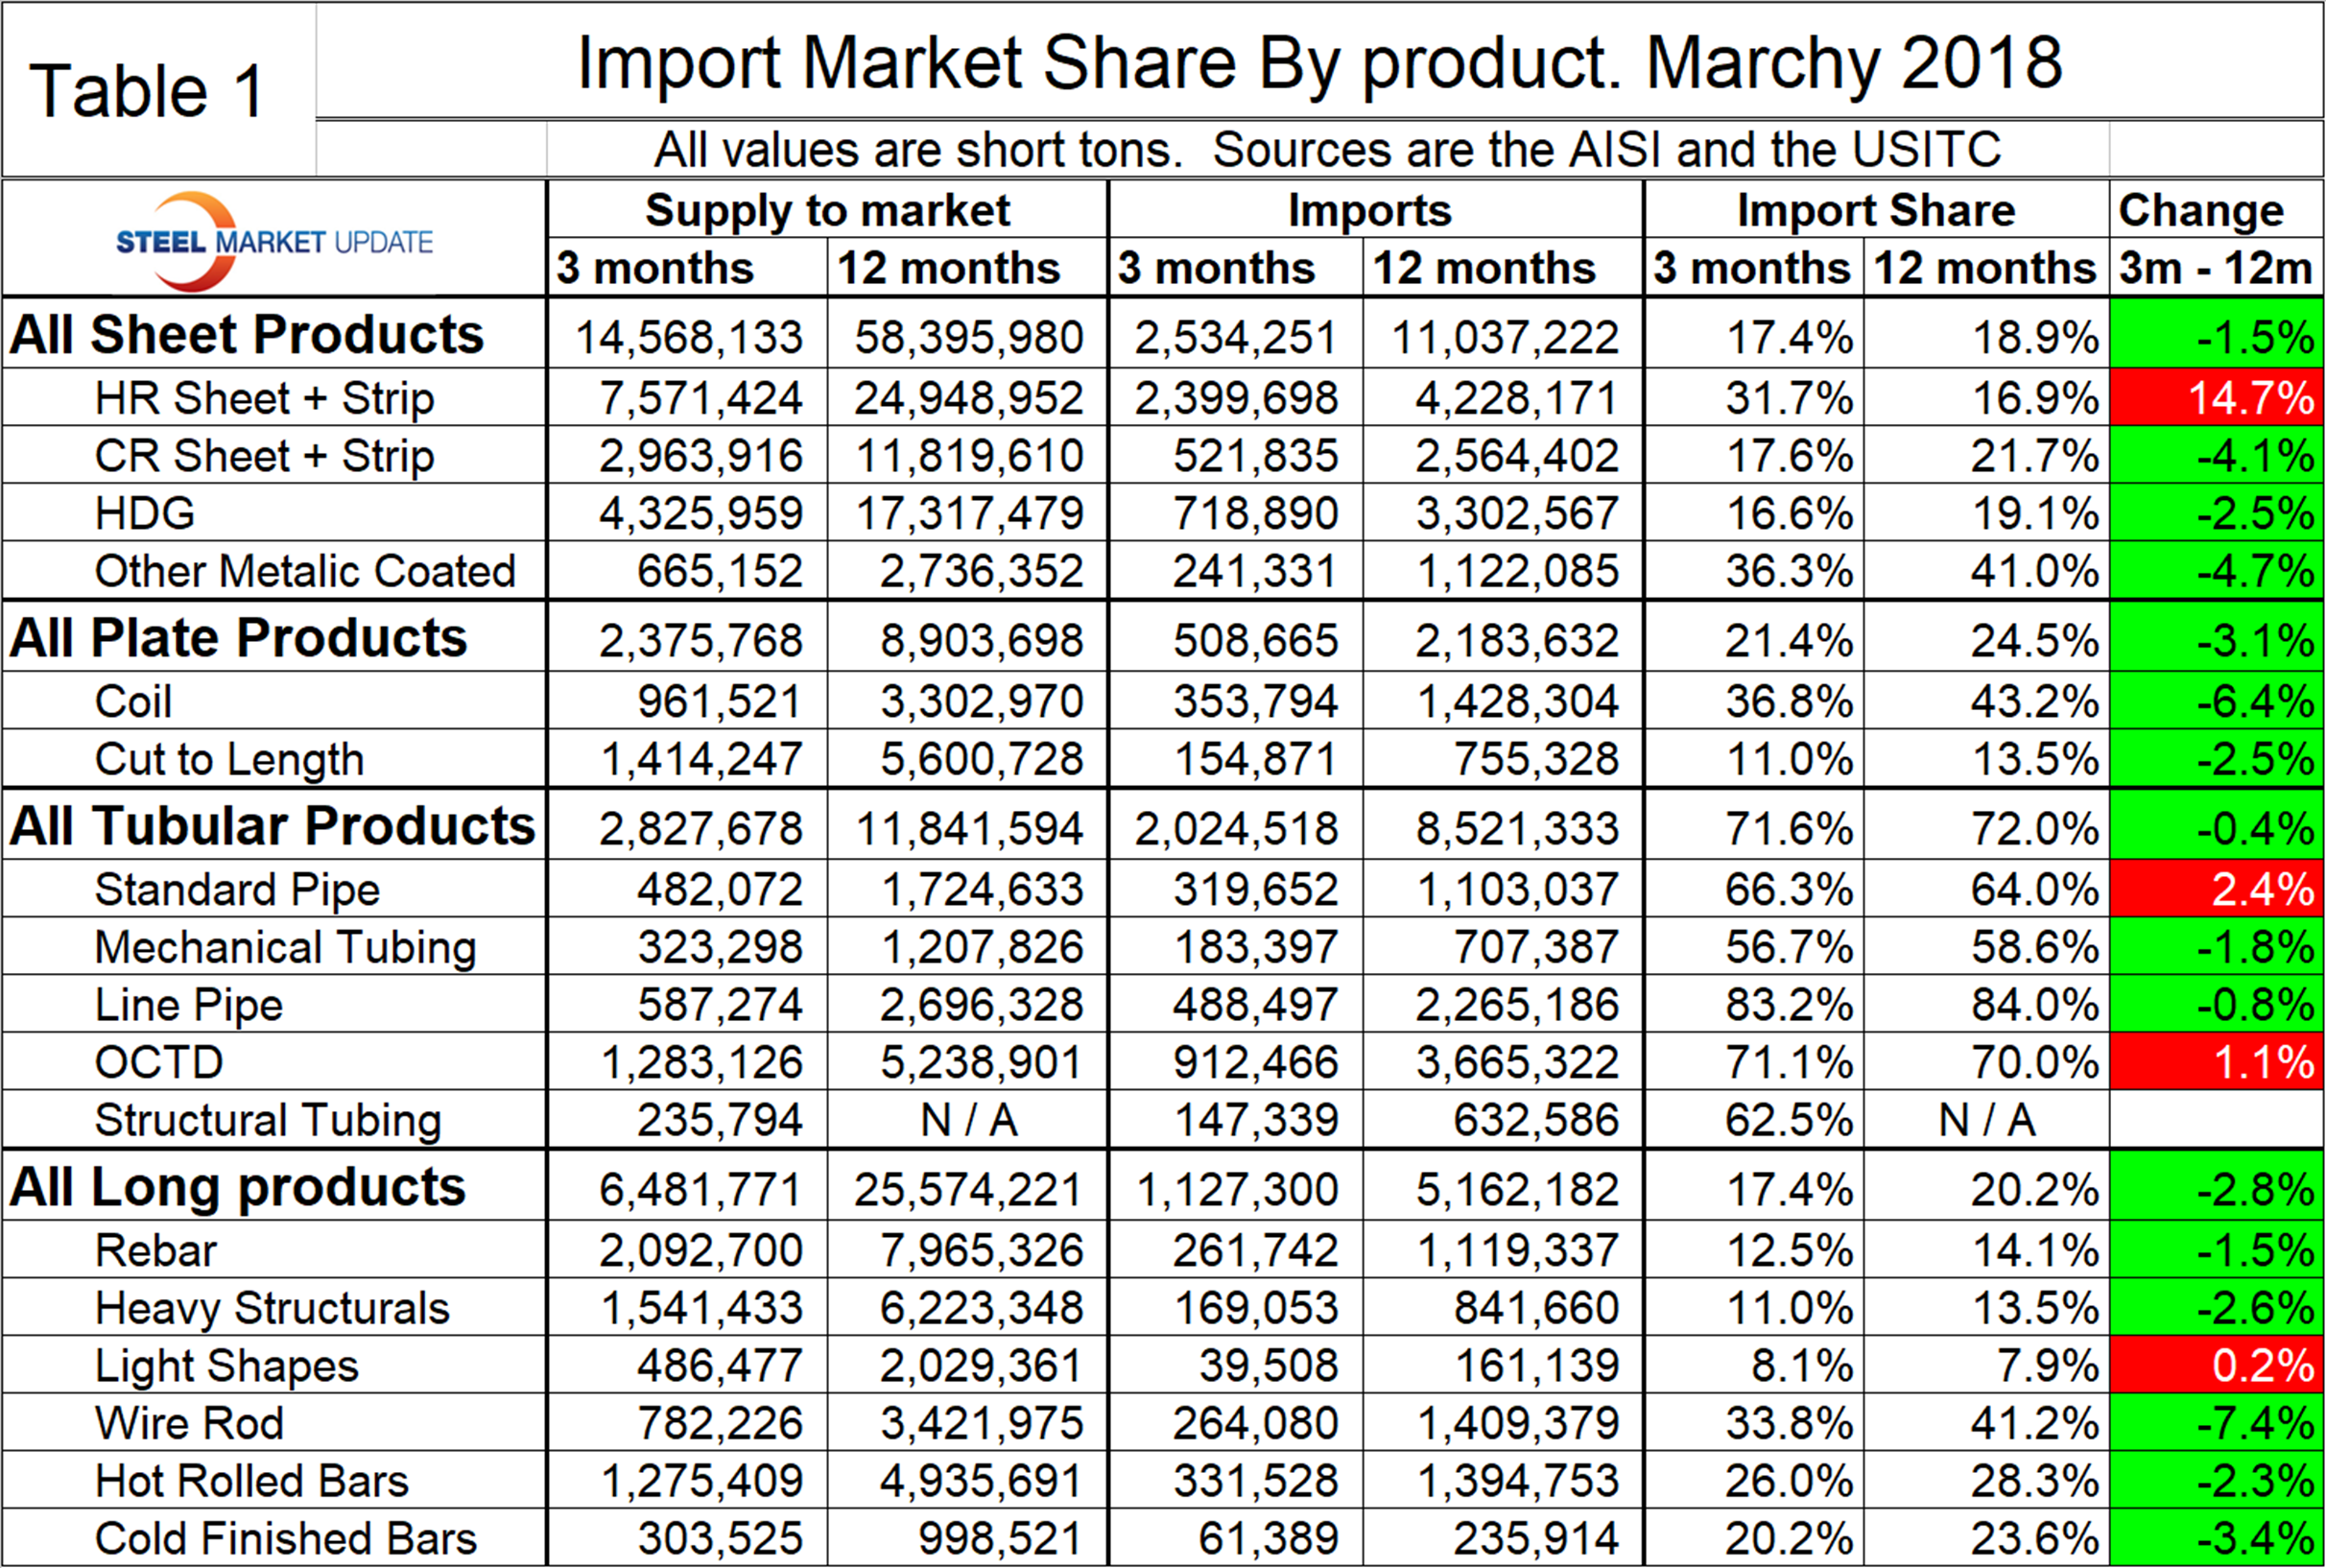
There is a huge difference in import market share between products with tubular goods being by far the worst case. In the tubular section of Table 1, the import share of structural tubing is blank because the AISI data prior to March 2017 made no sense and we have not included it.
Figure 1 shows the historical import market share of plate and total sheet products. The import share of both has been decreasing erratically for three years, though more so for plate, which started at a higher level.
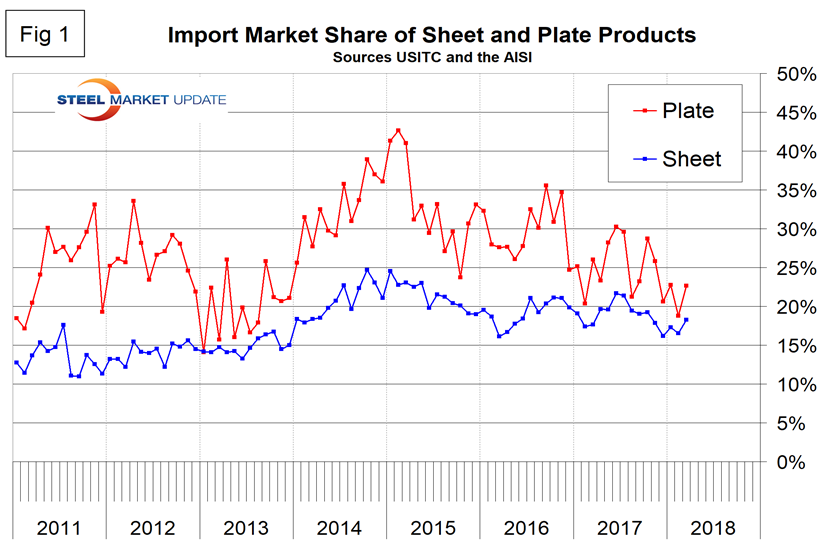
Figure 2 shows the import market share of the four major sheet products. Other metallic coated (mainly Galvalume) has by far the highest import market share and hot rolled has the lowest.
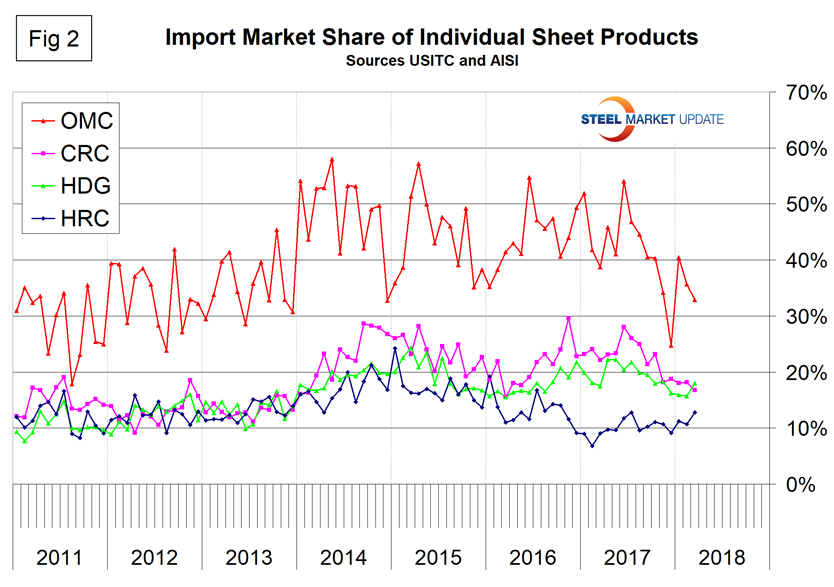
Figure 3 breaks out coiled and CTL plate from the total and shows that coil imports currently have almost four times the market share of CTL imports.
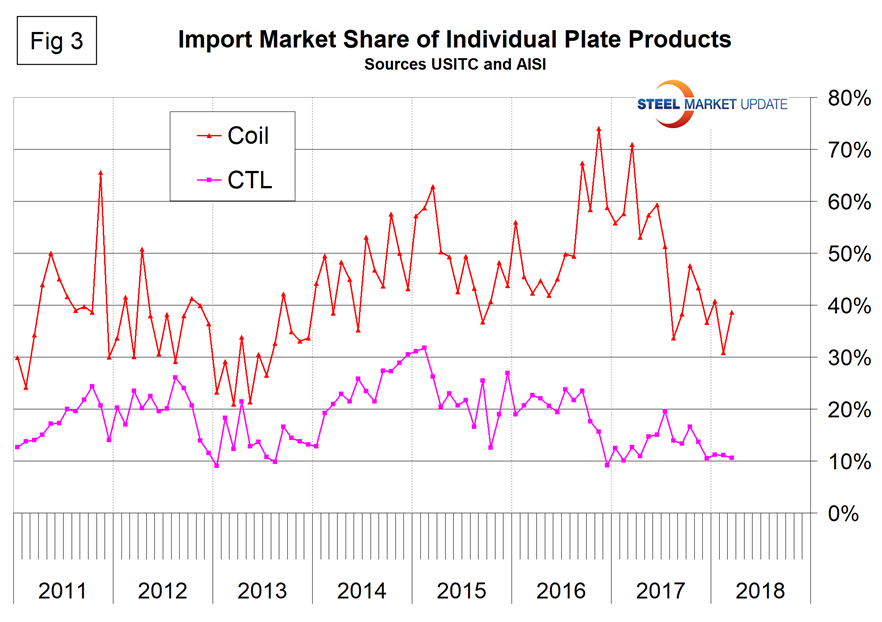
Figure 4 describes the total import share of tubular goods and long products. We’re not sure what to make of the tubular data. It is evident as we work the numbers that the AISI data for tubulars is much less reliable than that for other products. Domestic shipments are definitely understated for some products and we suspect for all. This is probably because of a more fragmented supply chain and the independent tubers not reporting to the extent that the steel mills do for other products. This has the result of increasing the apparent import market share. We would be delighted if tube specialists who read this report would comment. With permission, we will reproduce those comments for the benefit of all. We hope that at least the AISI tonnage deficit is consistent for each tubular product and that there is some value in the direction of the graphs. The import share of long products has decreased by over a third since June last year.
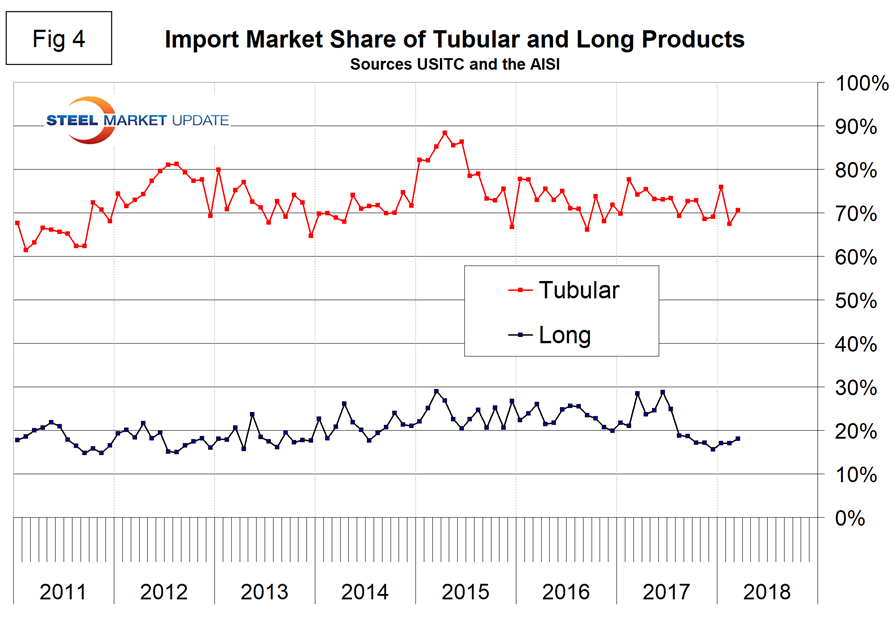
Figure 5 shows the import market share of the individual tubular products. Based on the information we have, all are very high compared to other steel product groups and line pipe is the worst.
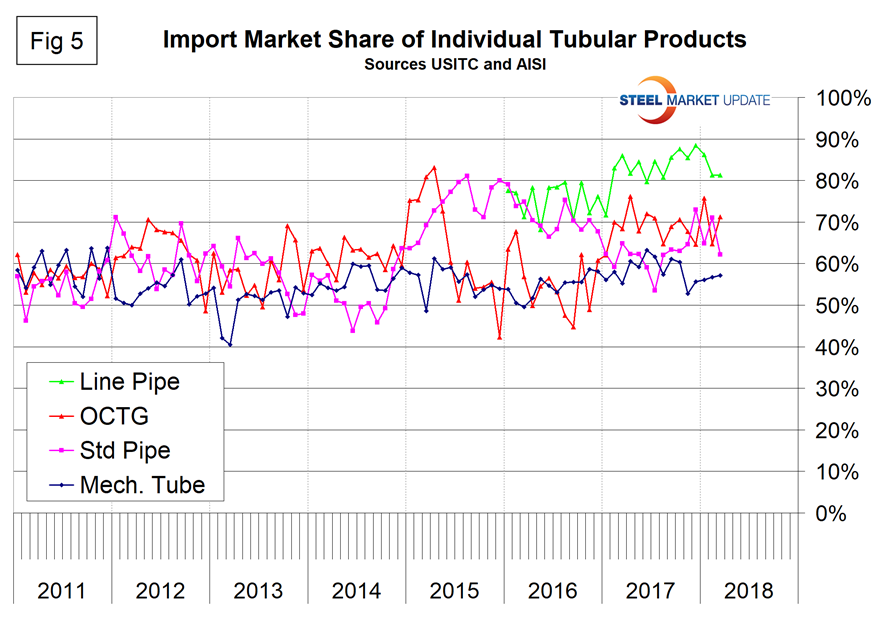
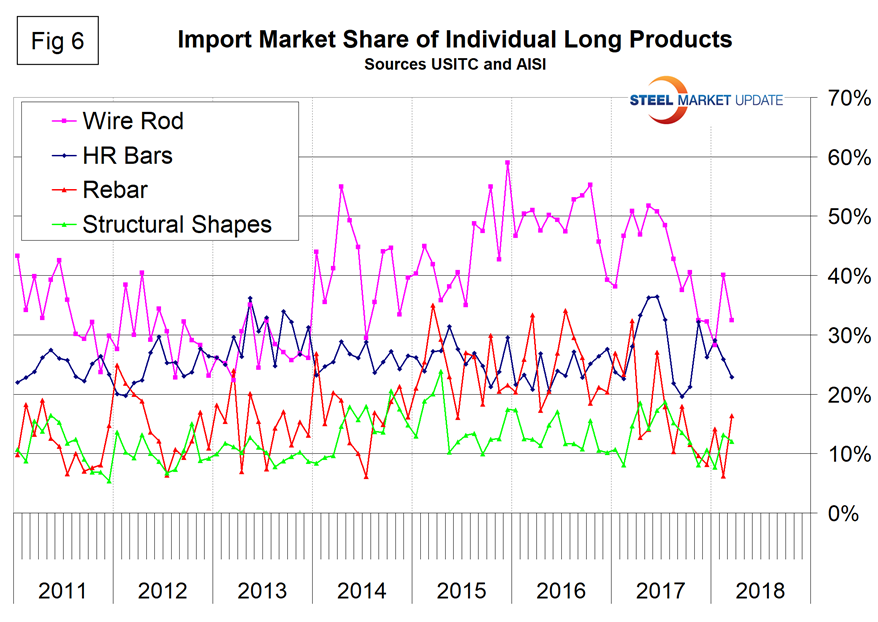
Figure 6 shows the detail for the four major sectors of the long products group. The import share of longs has increased slightly this year, but is still lower than at any time since mid-2014. Wire rod has historically had by far the highest import share, and to make matters worse the imports of drawn wire are also very high. The highest volume item of Chinese steel imports to the U.S. is currently drawn wire.