

Market Data

June 14, 2018
SMU Premium-Level Report: CRC Imports by Region
Written by Tim Triplett
Editor’s Note: Not a Premium-level subscriber to SMU? See the sample Premium report below:
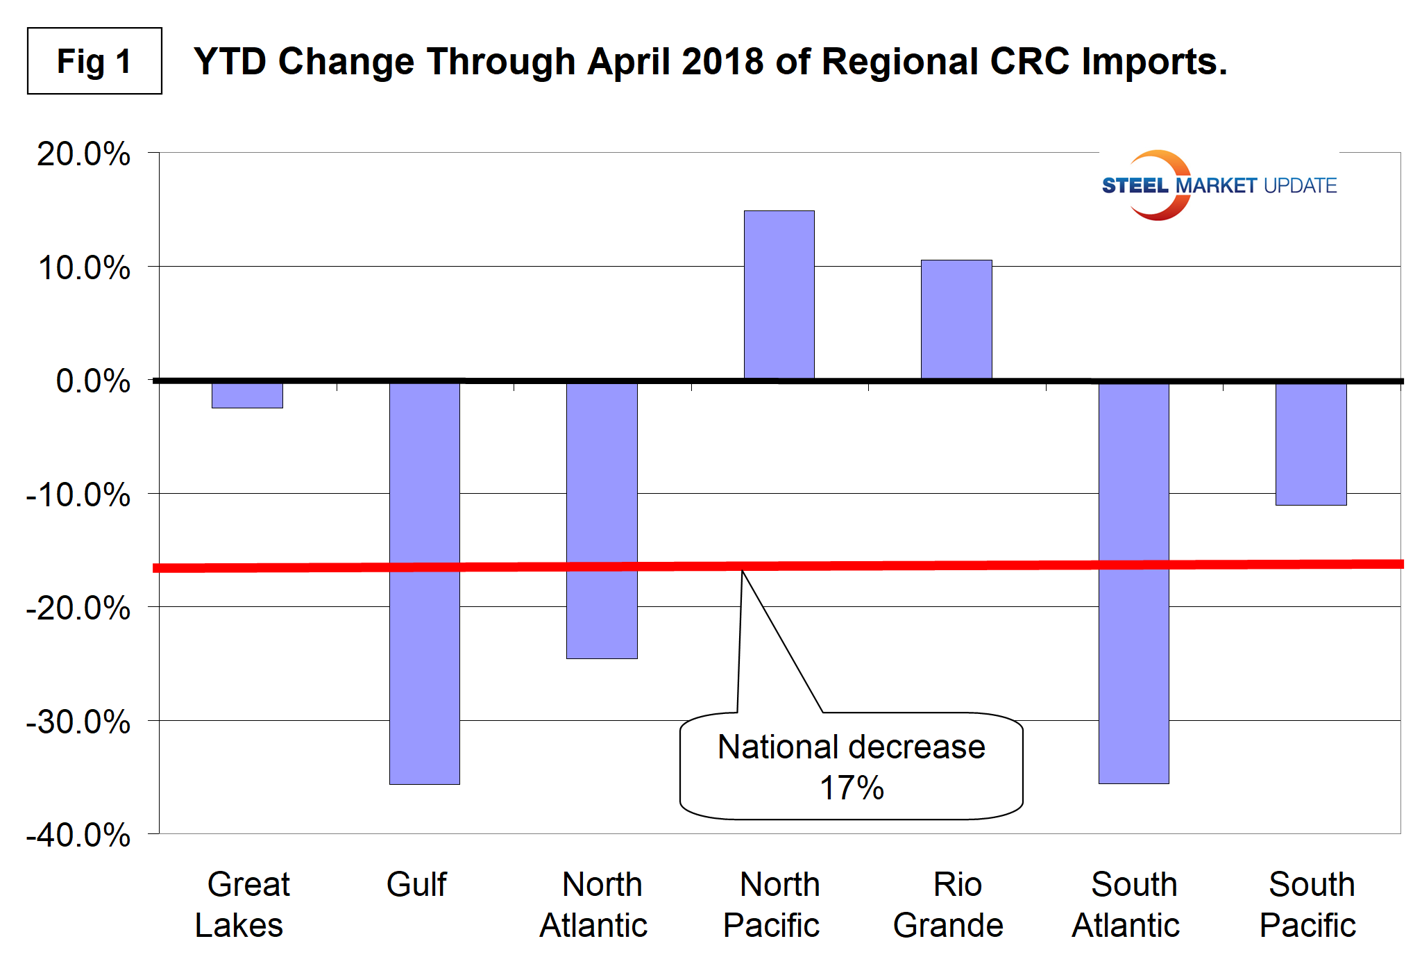
Overall, U.S. imports of cold rolled coil declined by 17 percent year to date through April, but some regions saw increases.
Imports can vary significantly from one region to another. Steel Market Update has produced import reports by product at the national level and detailed reports at the port level by source nation. This new analysis of U.S. International Trade Commission data plugs the gap between SMU’s other reports by identifying changes at the regional level. Produced for the first time this week are reports on hot rolled, cold rolled and hot-dipped galvanized steel.
Figure 1 shows the year-to-date change in CRC imports for each of seven regions and the change at the national level. The North Pacific and Rio Grande have experienced increased volume, the Great Lakes region has about broken even and the other regions have had substantial decreases.
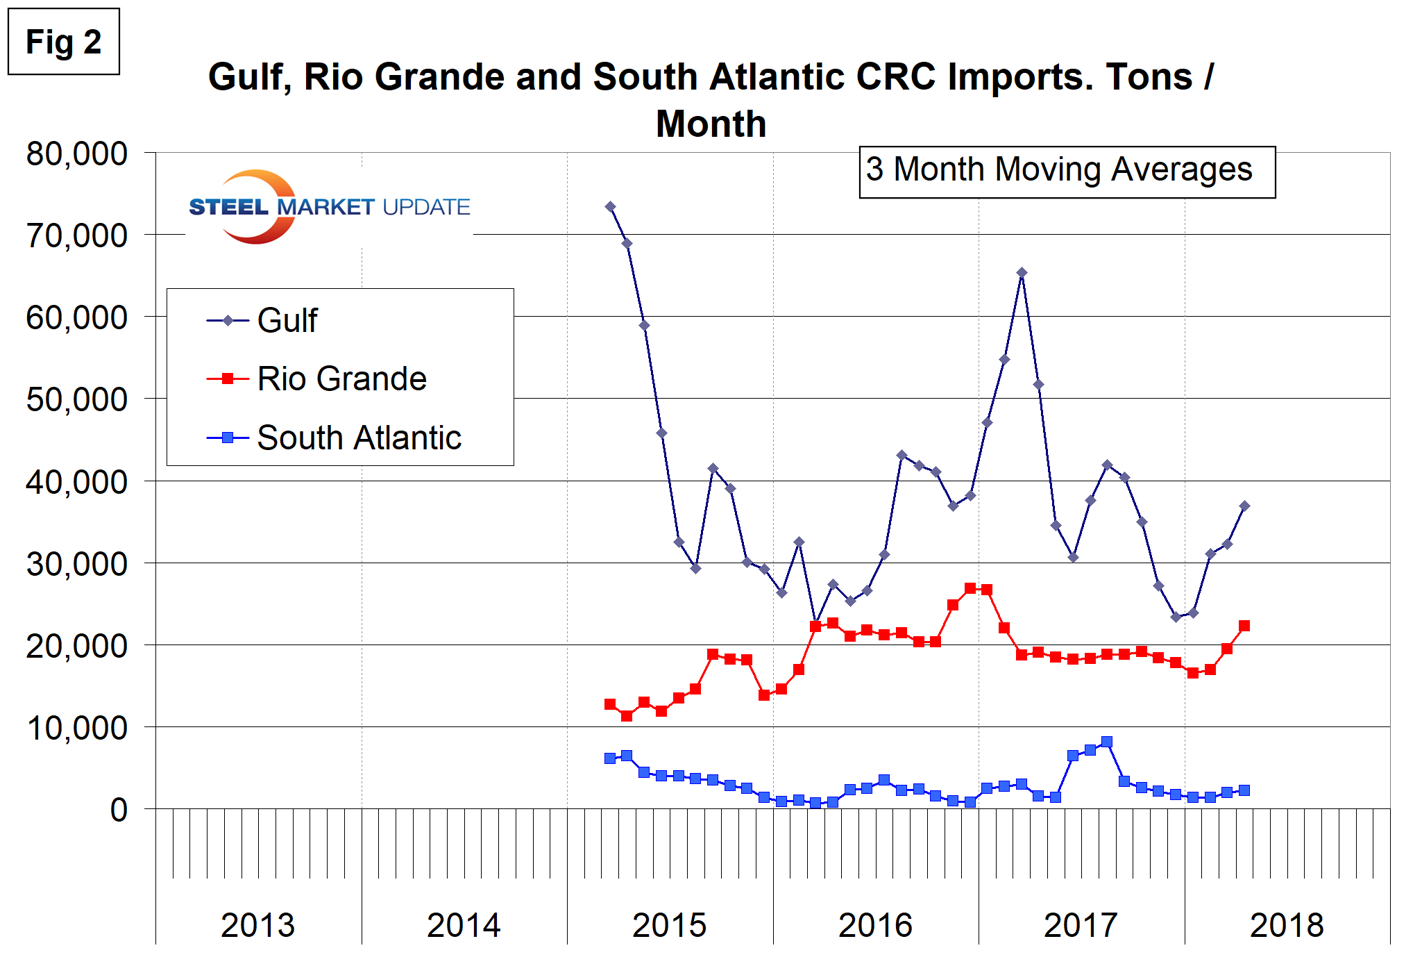
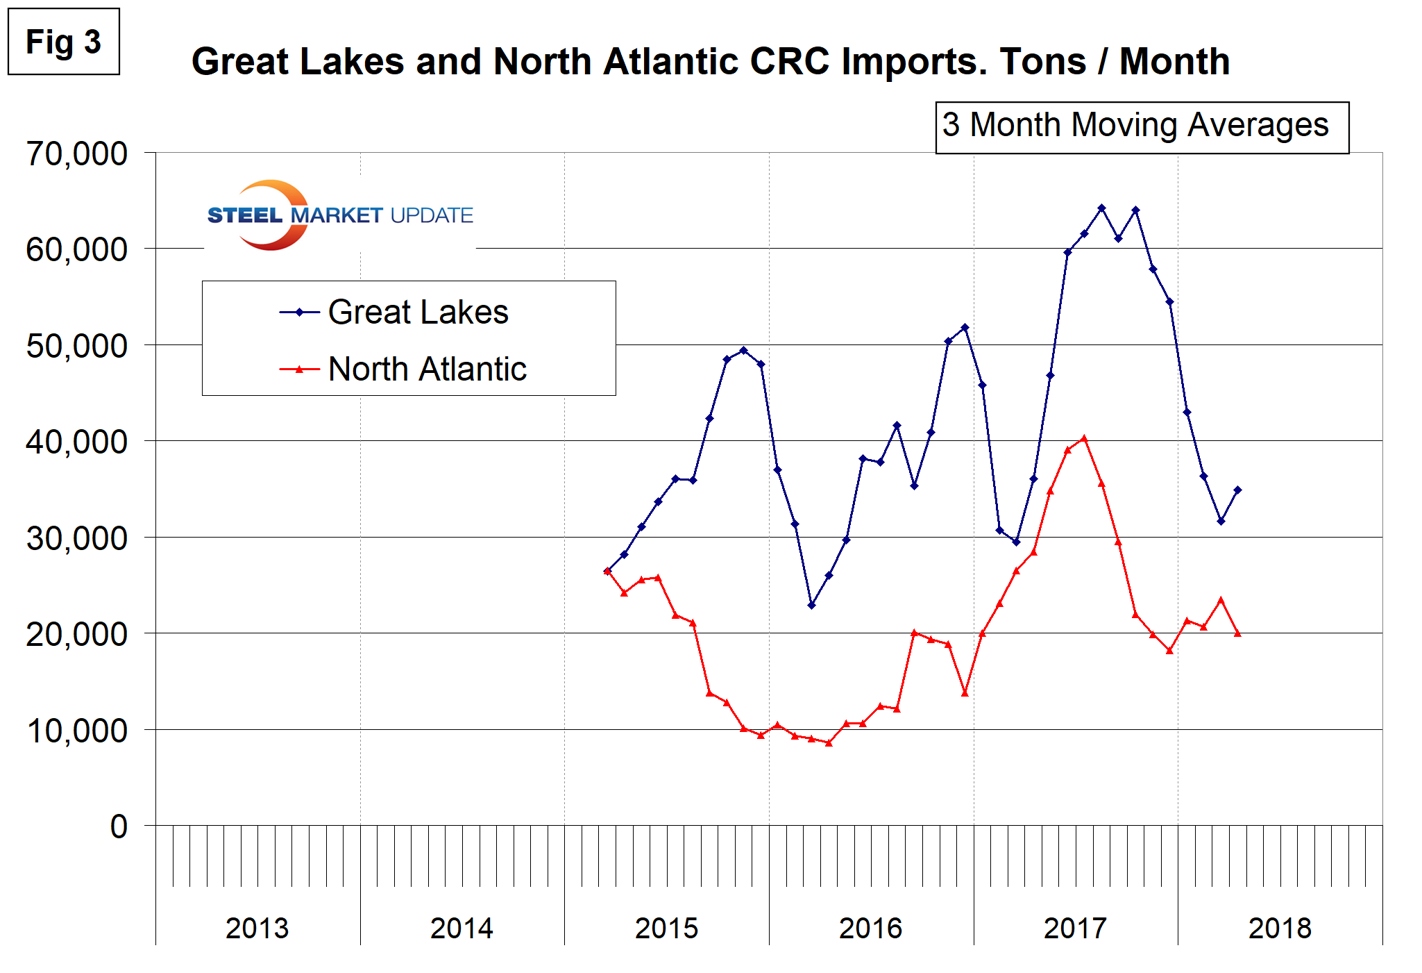
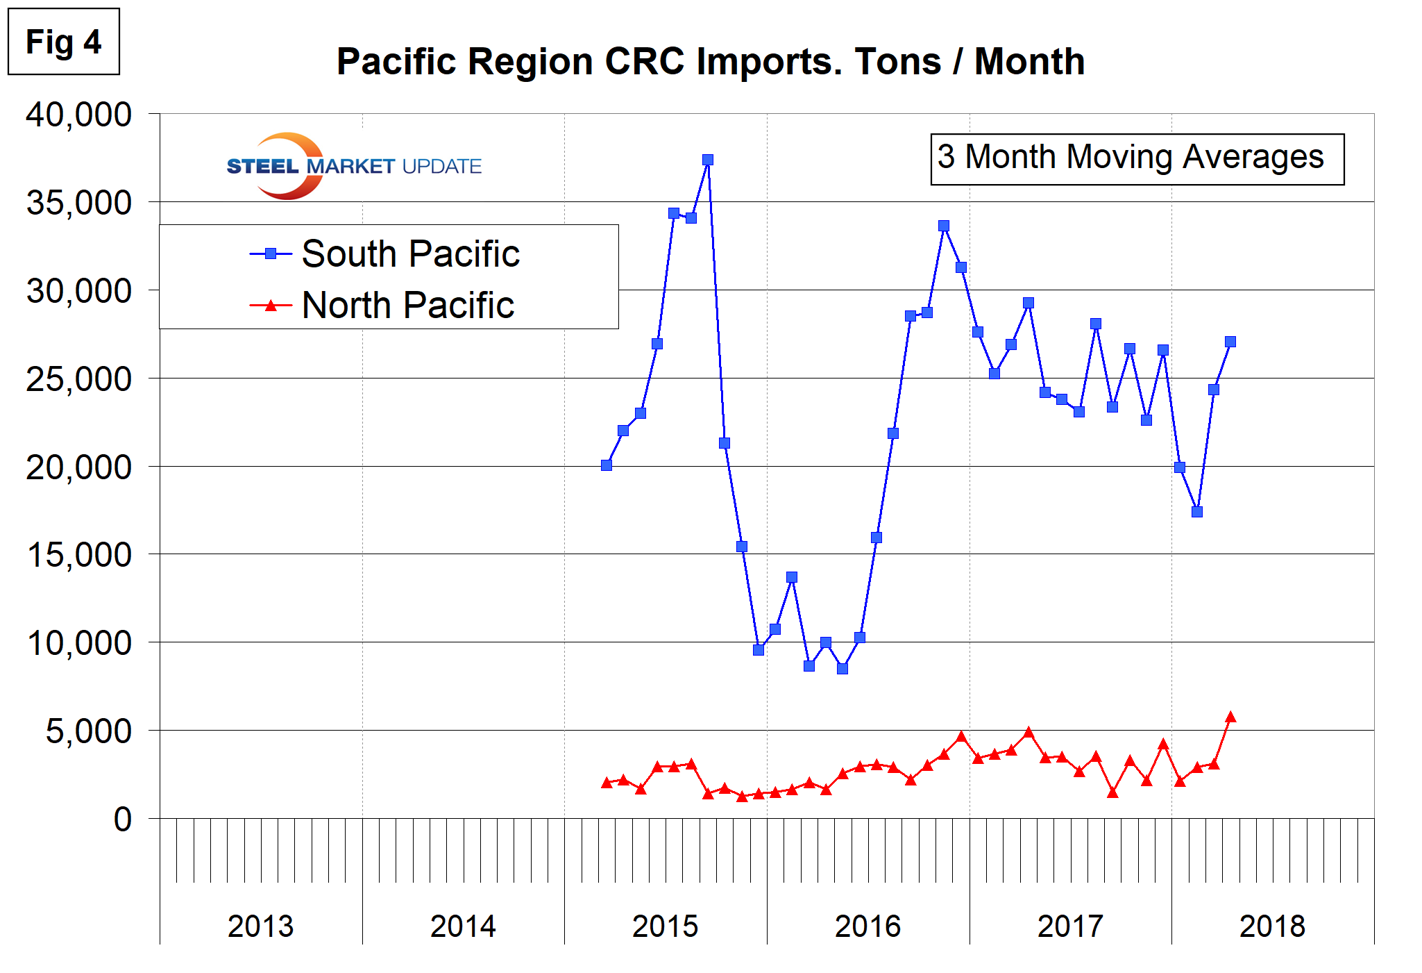
Figures 2, 3 and 4 show the history of CRC coil imports by region since March 2015 on a three-month moving average basis.
Imports into the Gulf have been very erratic with peaks in March 2015 and March 2017. Next time we publish, we will push this data back to March 2013. The Gulf currently has the highest volume, followed by the Great Lakes. Cold rolled imports coming across the Rio Grande and also into the South Atlantic have been fairly consistent for over three years.
The Great Lakes and North Atlantic regions have also been very erratic since March 2015, with recent peaks in the second half of last year.
Volume into the South Pacific ports of San Diego and Los Angeles collapsed in the second half of 2015, recovered in the second half of 2016, and has been on a declining trend since then. Volume into the North Pacific ports has been consistently low.
Executive-level subscribers can upgrade to Premium-level content by emailing info@SteelMarketUpdate.com or calling 772-245-8630.


